
In order to ensure that the improved structure can meet the requirements of stiffness, strength and dynamic performance, it is necessary to conduct free modal analysis and static structural strength analysis on the tractor gearbox shell casting, and compare the results with the original structural results to test the structural performance of the improved tractor gearbox shell casting.
1. Constrained modal analysis of improved tractor gearbox shell casting
The nephogram of constrained modal frequency and vibration mode of the improved tractor gearbox shell casting is shown in Figure 1; Table 1 shows the comparison of natural frequencies and vibration modes of constrained modes before and after improvement:
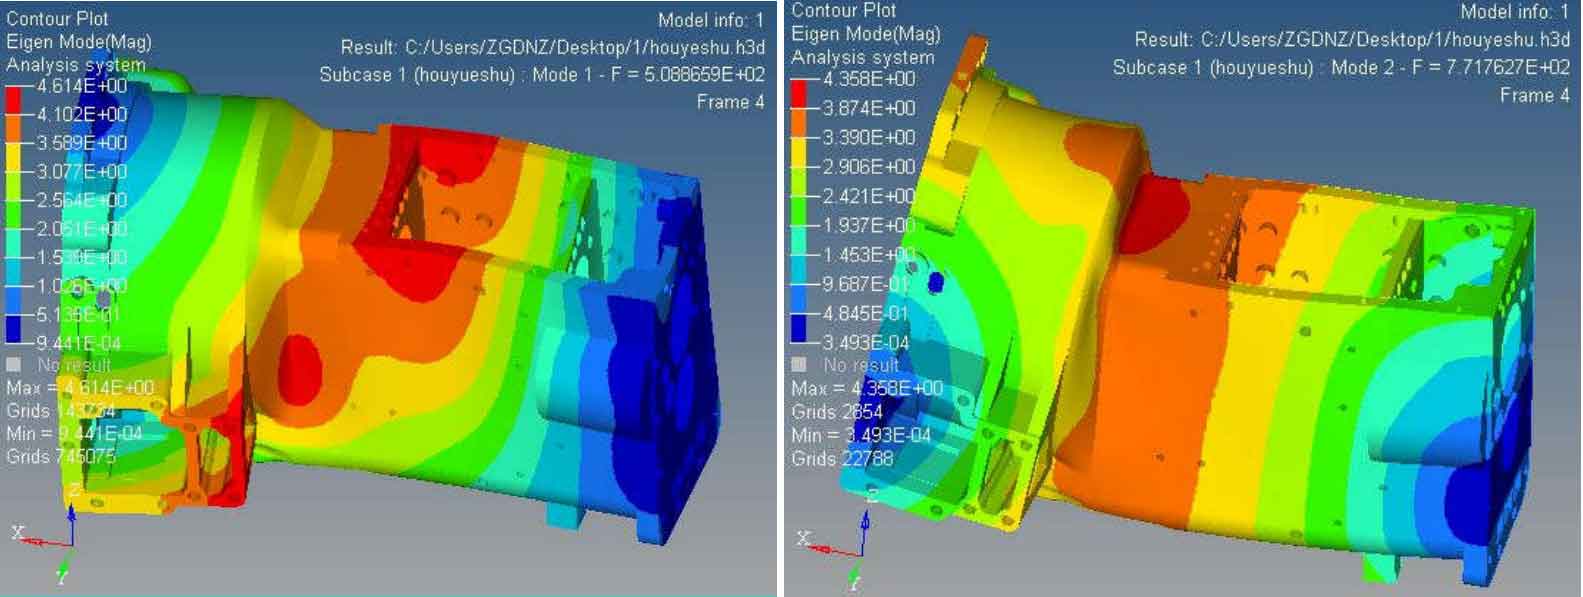
The second order (771.76hz) overall bending vibration around Y
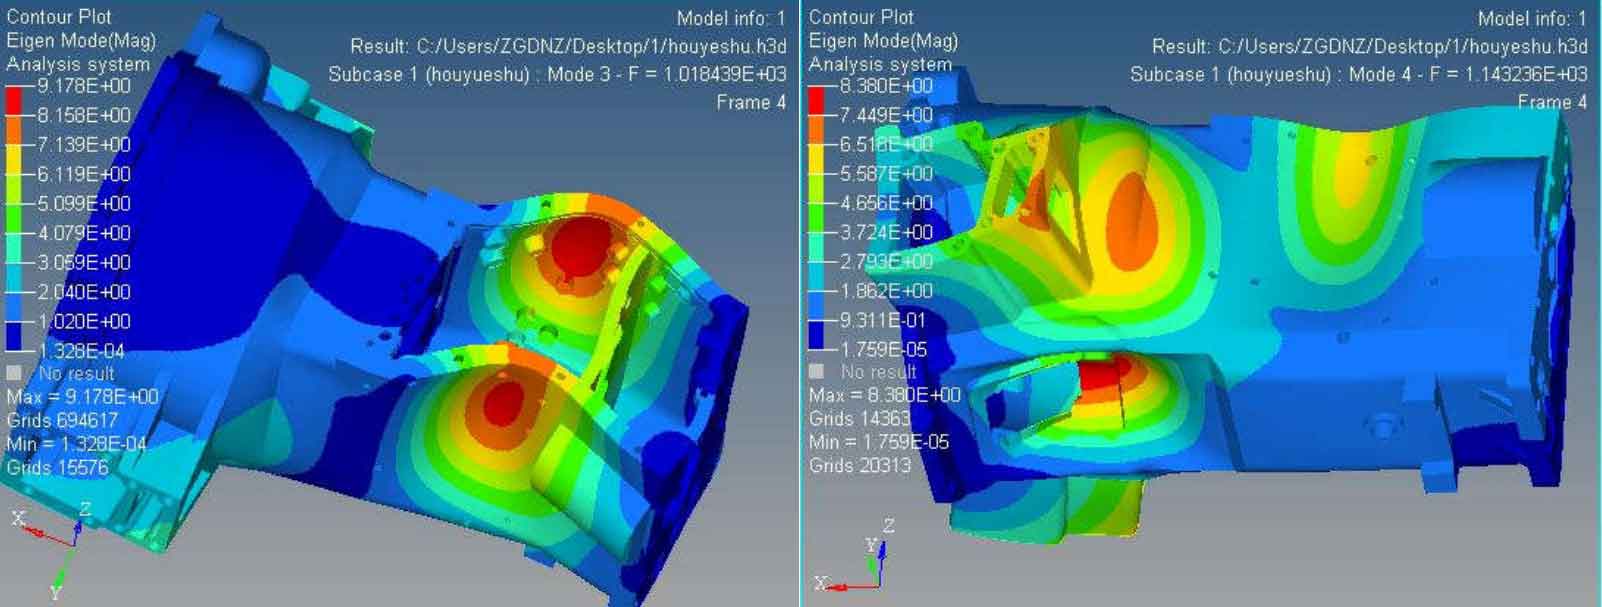
The 4th order (1143.23hz) overall tension bending vibration
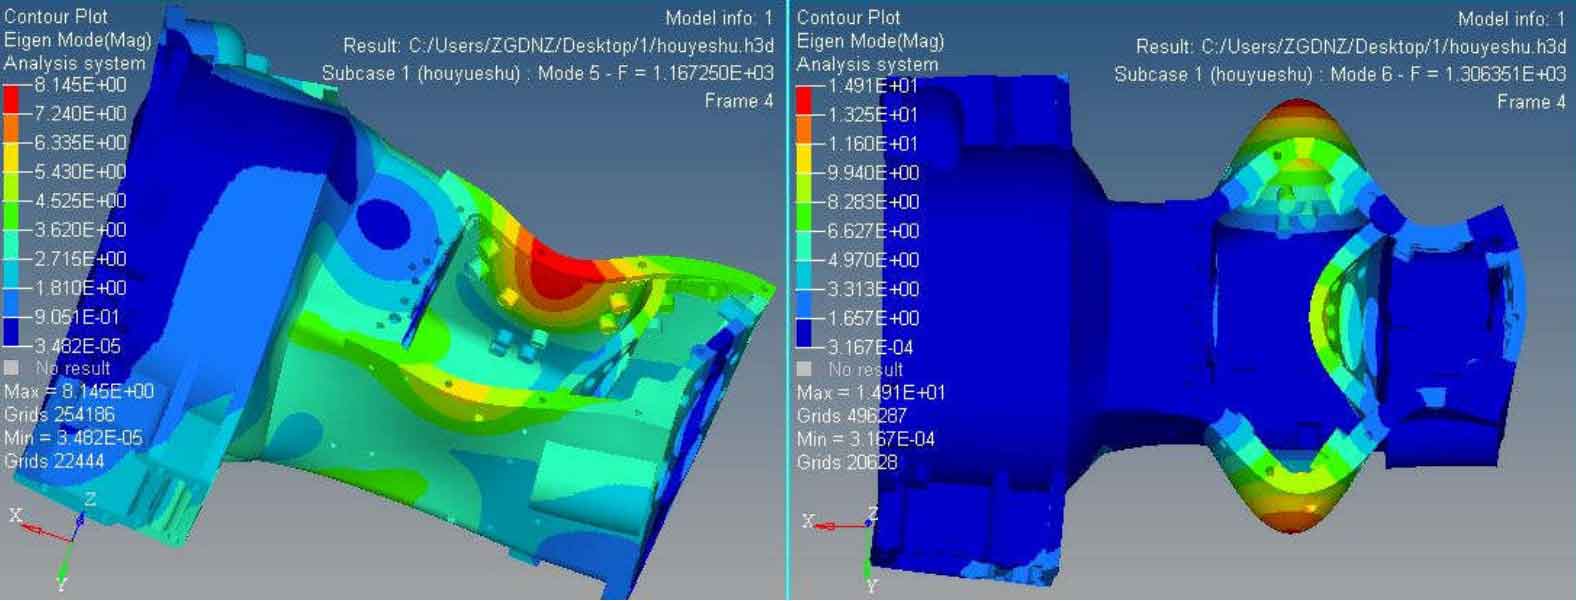
The 6th order (1306.35hz) overall tension bending vibration
From the comparison of the analysis results of constraint modes before and after optimization, it can be seen that the natural frequency of each order of constraint modes of the improved structure is about 50Hz higher than that of the improved structure, and the highest excitation frequency of the working environment is from the tractor engine, which is about 110hz. The dynamic characteristics of the gearbox shell casting of the optimized tractor are better than that of the original structure; The modal similarity of each order is also very consistent, which meets the requirements of vibration characteristics.
| Order | Frequency / Hz (rear) | Vibration mode (rear) | Frequency / Hz (front) | Vibration mode (front) |
| 1 | 508.86 | Overall bending vibration around Z | 459.58 | Overall bending vibration around Z |
| 2 | 771.76 | Overall bending vibration around Y | 691.59 | Overall bending vibration around Y |
| 3 | 1018.43 | Local bending vibration | 951.64 | Local bending vibration |
| 4 | 1143.23 | Integral tension bending vibration | 1127.61 | Integral tension bending vibration |
| 5 | 1167.25 | Overall torsional tension vibration | 1145.63 | Overall torsional tension vibration |
| 6 | 1396.35 | Integral tension bending vibration | 1243.15 | Integral tension bending vibration |
2. Static analysis and verification of improved tractor gearbox shell casting
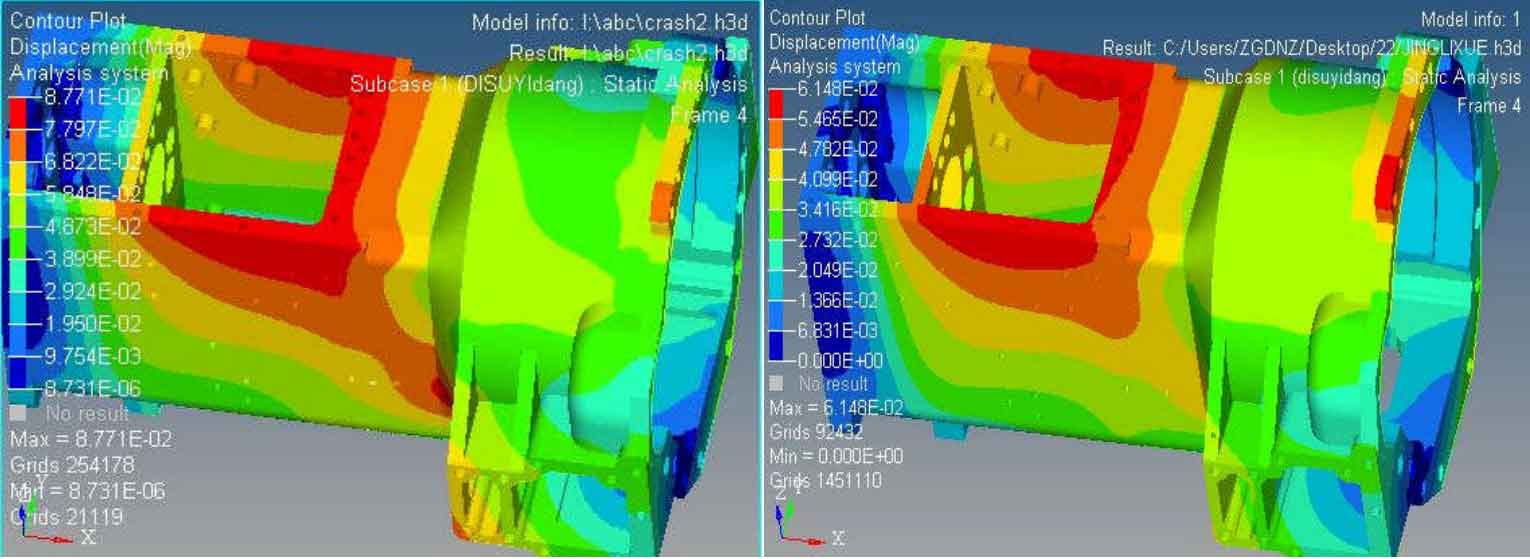
Structure displacement nephogram before optimization
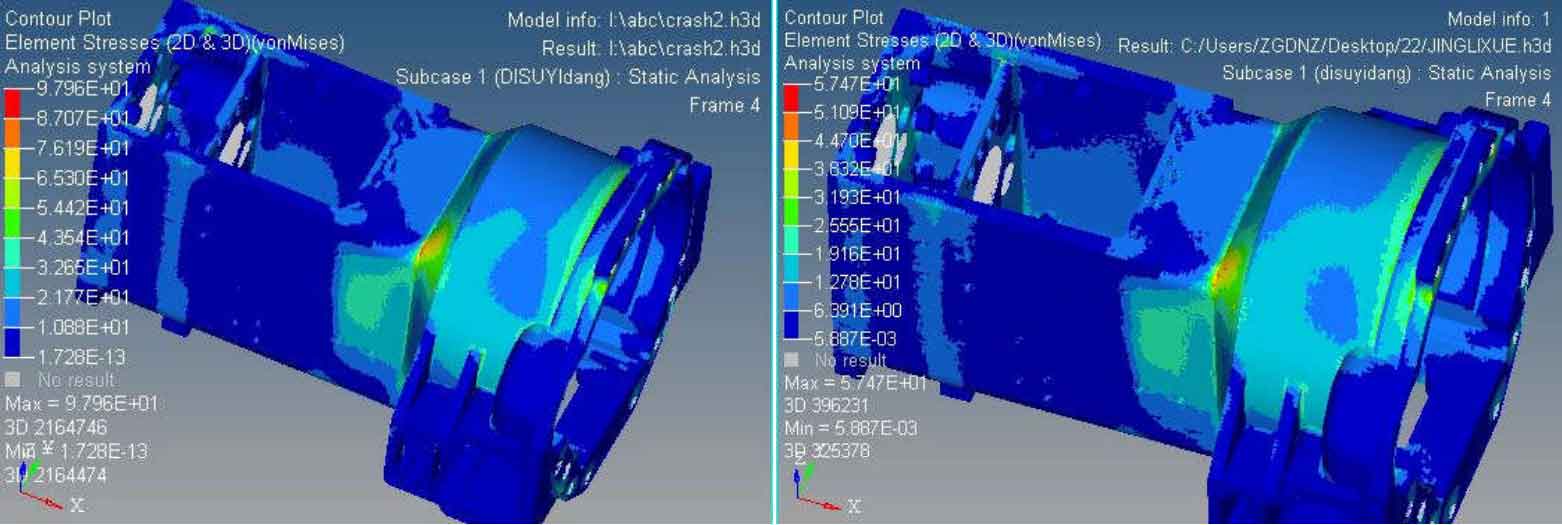
Structural stress nephogram before optimization
Verify whether the rigidity and strength of the improved tractor gearbox shell casting meet the requirements, conduct static analysis on the optimized tractor gearbox shell casting, and compare the analysis results with the analysis results before the improvement, as shown in Figure 2 and figure 3 and table 2 and table 3:
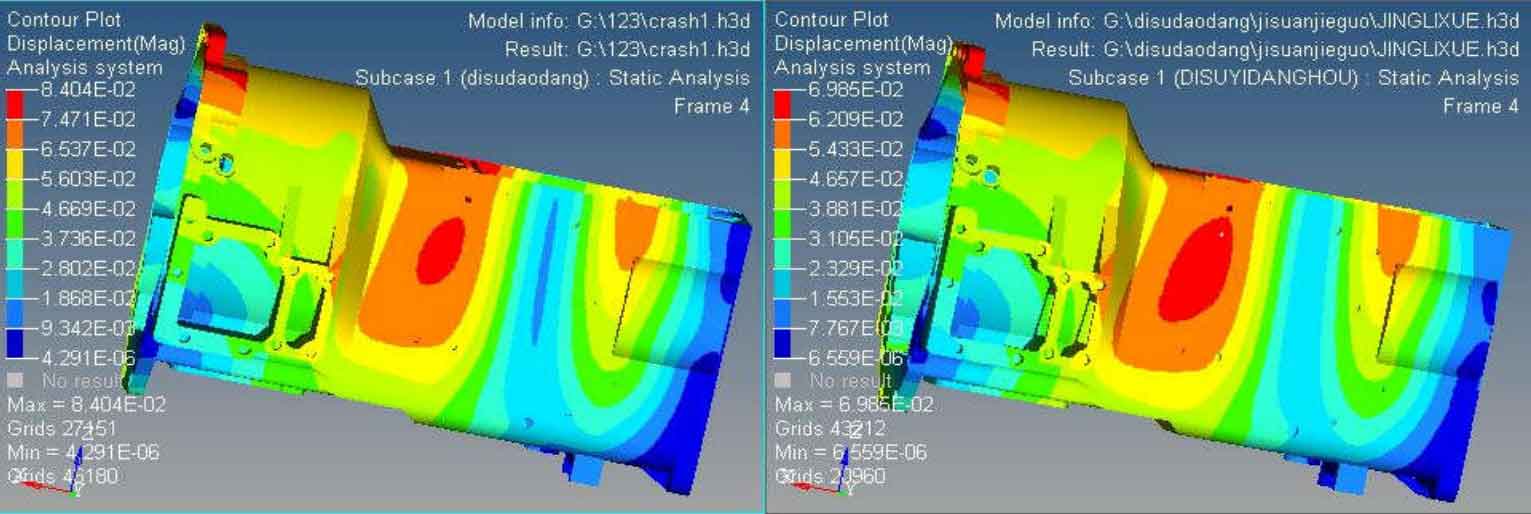
Cloud diagram of structural deformation before optimization
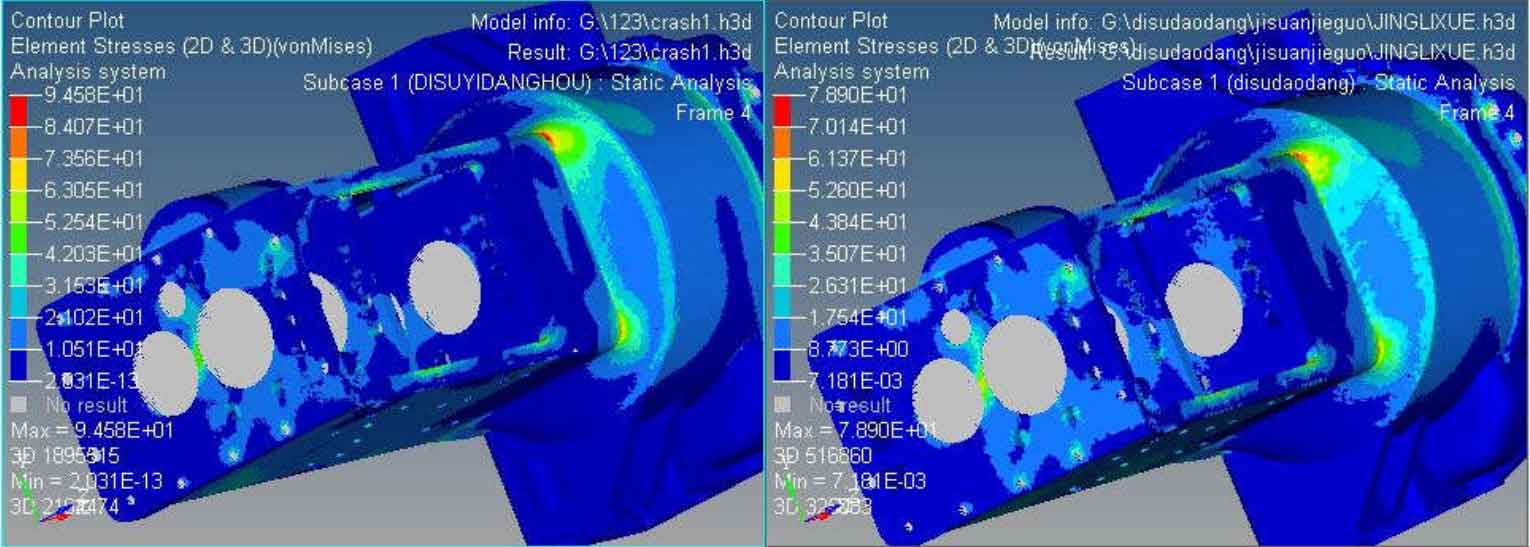
Structural stress nephogram before optimization
It can be seen from Figure 2 and figure 3 and table 2 and table 3 that the deformation and stress distribution of the casting of the gearbox shell of the improved tractor have little change with the original structure, indicating that the strength and stiffness of the optimized structure are basically unchanged. The stress distribution after the improvement is basically the same as that before the improvement. The stress is mainly concentrated in the connection between the casting of tractor gearbox and engine; The casing of the tractor is connected with the rear axle casting; At the middle diaphragm; At the diaphragm of clutch and gearbox. The maximum stress occurs at the diaphragm of clutch and gearbox, and its maximum stress is 97.64mpa, which is less than the allowable stress of material is 124mpa.
| Maximum displacement mm | Maximum stress MPa | |
| Improved structure | 0.088 | 97.96 |
| Structure before improvement | 0.061 | 57.4 |
| Maximum displacement mm | Maximum stress MPa | |
| Improved structure | 0.08404 | 94.58 |
| Structure before improvement | 0.06985 | 78.90 |