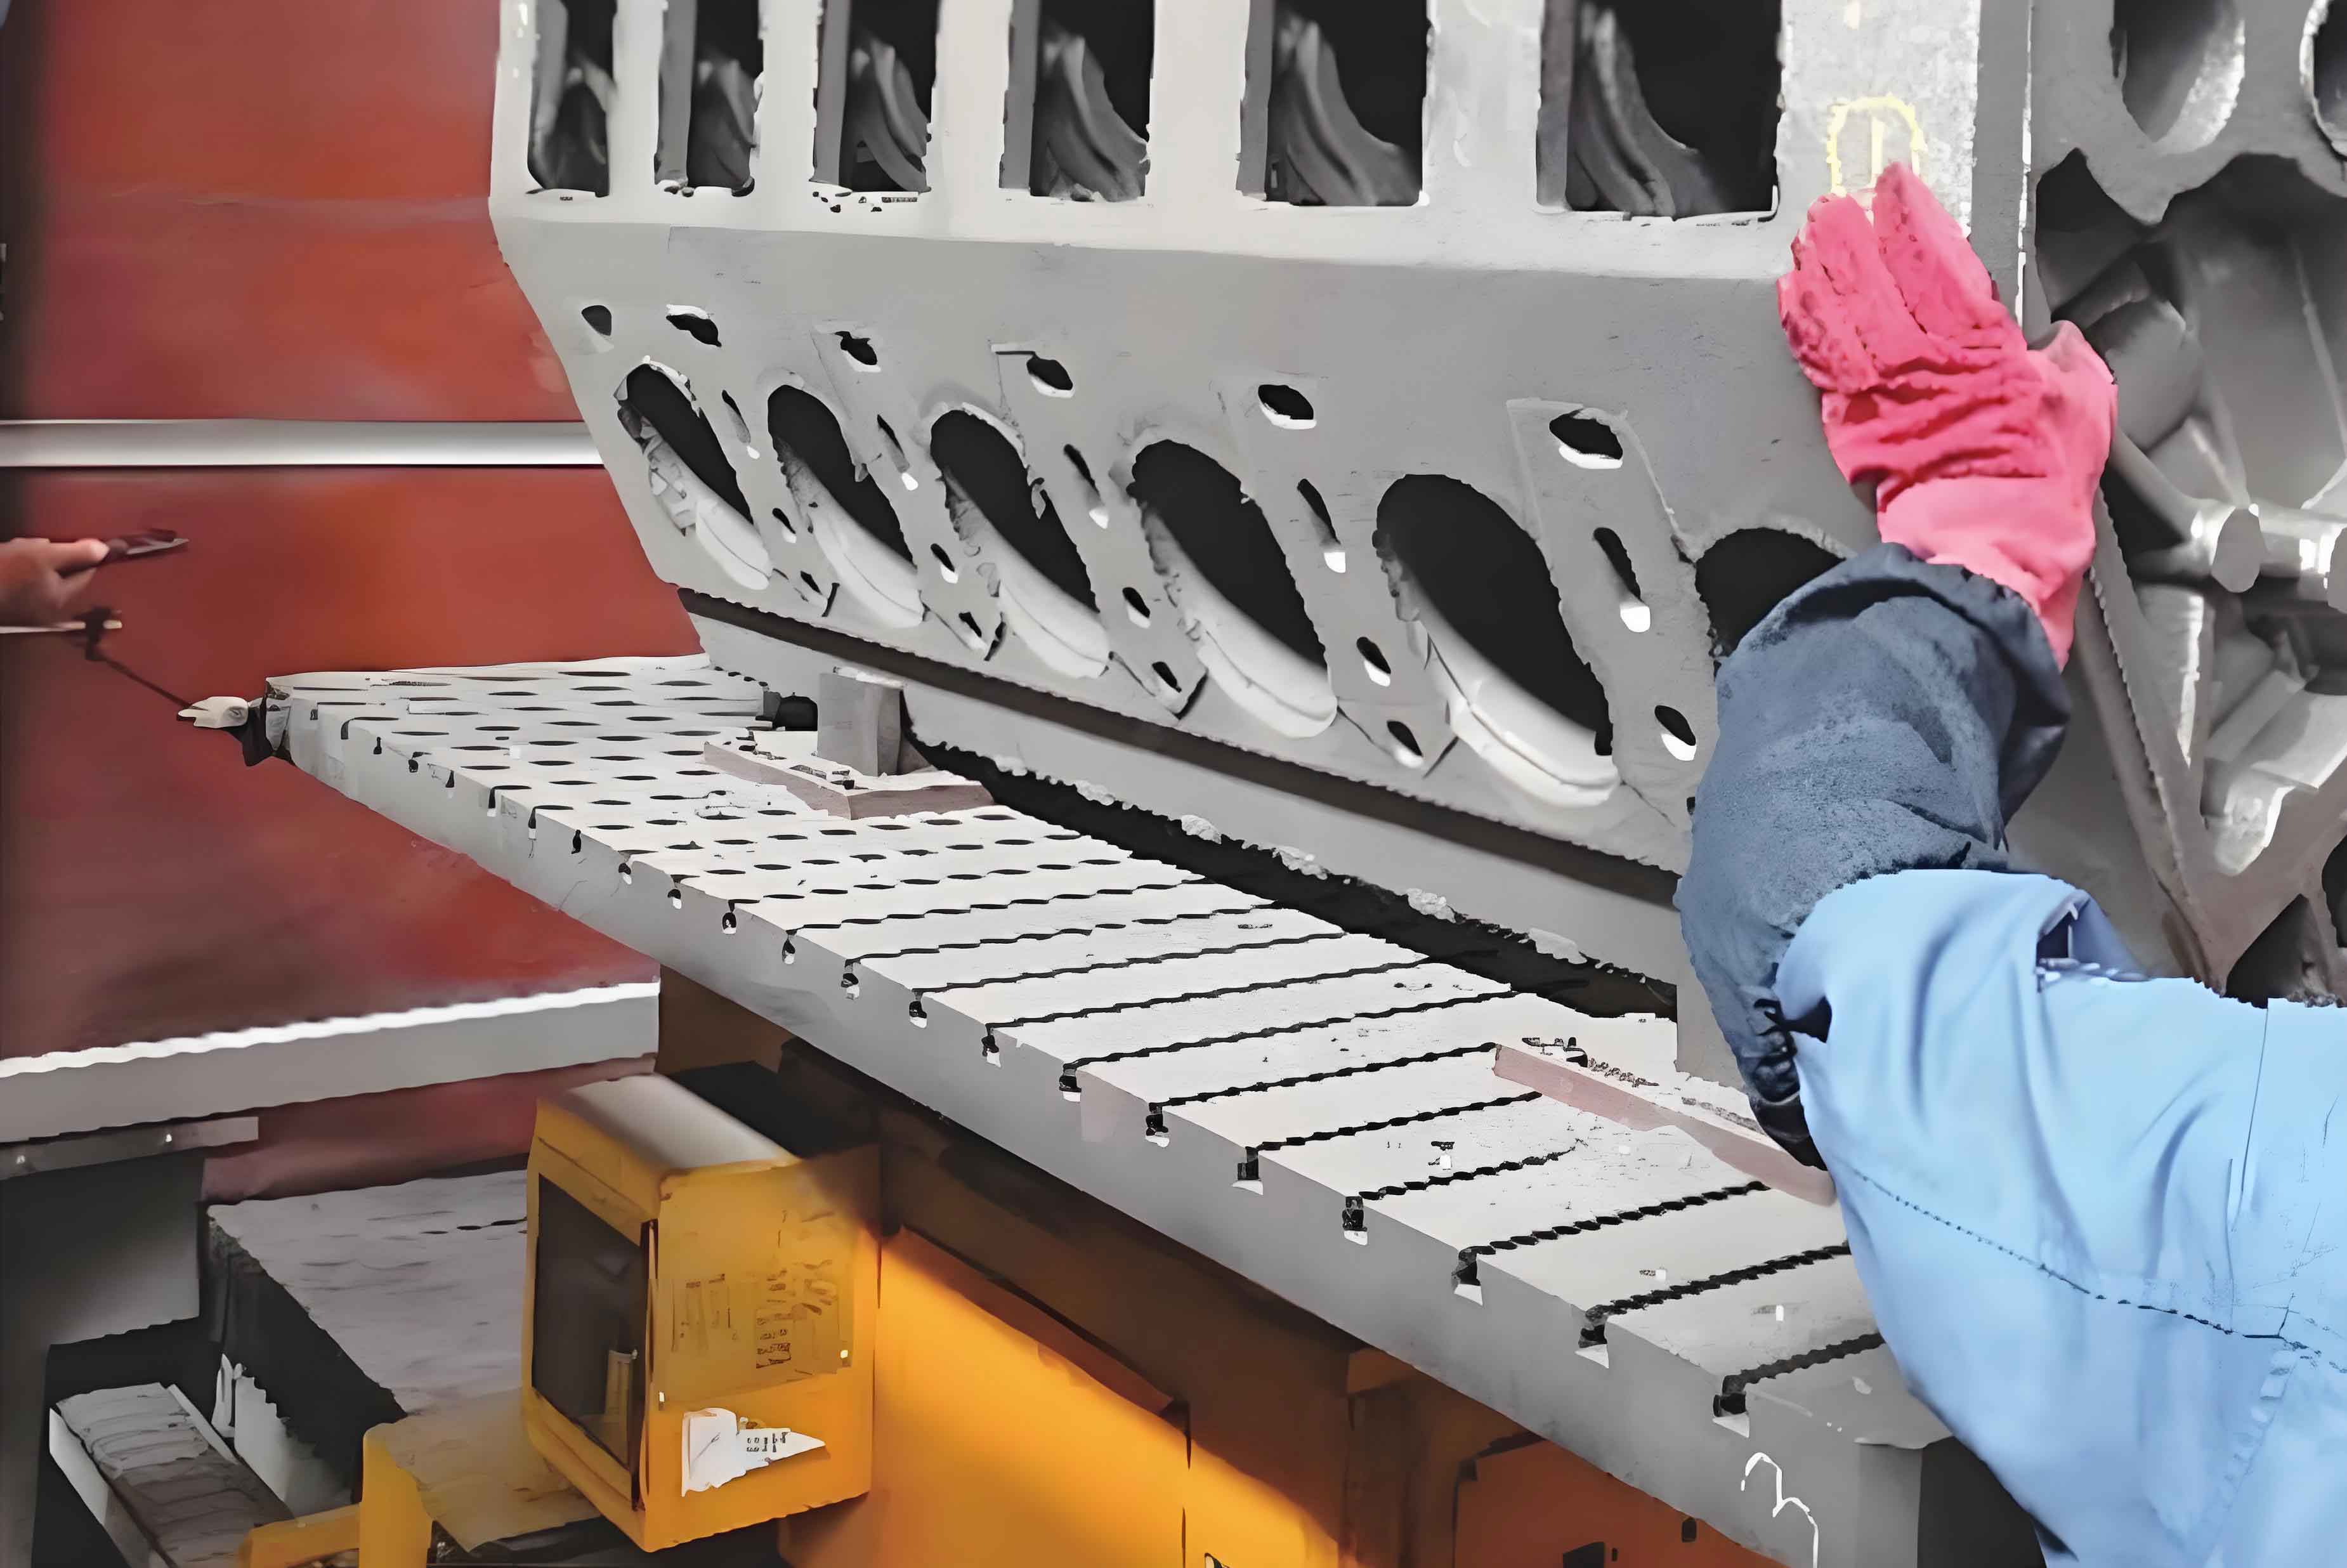
The efficient thermal management of motorcycle engines, particularly the engine cylinder block, is critical to ensure optimal performance, durability, and emission compliance. This study presents a comprehensive approach to matching and validating a two-cylinder motorcycle engine cooling system, emphasizing the role of the engine cylinder block in heat dissipation. By integrating one-dimensional (1D) simulation, computational fluid dynamics (CFD), and experimental testing, the cooling system’s flow resistance, coolant distribution, and thermal balance are rigorously analyzed.

1. Introduction
Modern motorcycle engines operate under extreme thermal loads, especially at high rotational speeds exceeding 9,000 rpm. The engine cylinder block, a core component, is subjected to cyclic combustion temperatures, necessitating uniform cooling to prevent hotspots and structural degradation. Traditional cooling system design often relies on empirical methods, leading to inefficiencies such as flow stagnation or uneven temperature distribution. This work addresses these challenges by proposing a systematic methodology for cooling system optimization, validated through experimental benchmarks.
Key objectives include:
- Establishing a 1D simulation framework for flow rate prediction.
- Analyzing flow uniformity within the engine cylinder block’s water jacket.
- Validating thermal balance under extreme operating conditions.
2. Cooling System Design and Methodology
2.1. System Architecture
The cooling system comprises a centrifugal pump, radiator, thermostat, and interconnected coolant passages within the engine cylinder block and cylinder head. The coolant flow rate (QQ) is governed by the pump’s performance curve and the cumulative resistance (RsystemRsystem) of components:Q=ΔPRsystemQ=RsystemΔP
where ΔPΔP is the pressure differential across the system.
2.2. 1D Simulation Framework
A GT-SUITE-based 1D model integrates component-specific resistance data (Figure 1). The engine cylinder block’s water jacket, radiator, and thermostat resistances are experimentally characterized and input as boundary conditions. Pump performance is evaluated via a dedicated test rig, generating a head-flow curve:H=aQ2+bQ+cH=aQ2+bQ+c
where HH is the pump head, and aa, bb, cc are empirical coefficients.
2.3. CFD Analysis of Engine Cylinder Block
A STAR-CCM+ model resolves the 3D flow field within the engine cylinder block’s water jacket. The governing Navier-Stokes equations for incompressible flow are:∇⋅u=0∇⋅u=0ρ(∂u∂t+u⋅∇u)=−∇p+μ∇2uρ(∂t∂u+u⋅∇u)=−∇p+μ∇2u
where uu is velocity, pp is pressure, ρρ is density, and μμ is dynamic viscosity.
3. Flow Rate Determination and Resistance Analysis
3.1. Component Resistance Testing
Flow resistance (RR) for critical components is measured using a closed-loop test rig (Table 1).
Table 1: Flow resistance of cooling system components
| Component | Resistance RR (Pa·s²/m⁶) |
|---|---|
| Engine cylinder block | 1.2 × 10⁴ |
| Radiator | 8.5 × 10³ |
| Thermostat | 3.7 × 10³ |
3.2. Simulated vs. Experimental Flow Rates
The 1D model predicts coolant flow rates across engine speeds, showing <1.5% deviation from experimental values (Table 2).
Table 2: Cooling system flow rate validation
| Speed (rpm) | Simulated QQ (L/min) | Experimental QQ (L/min) | Error (%) |
|---|---|---|---|
| 1,260 | 9.95 | 9.21 | 7.44 |
| 9,000 | 76.83 | 75.86 | 1.26 |
At 9,000 rpm, the system delivers 76.83 L/min, ensuring sufficient heat extraction from the engine cylinder block.
4. Flow and Thermal Analysis of Engine Cylinder Block
4.1. Velocity Distribution
CFD results reveal uniform flow velocities (0.1–3.6 m/s) within the engine cylinder block’s water jacket (Figure 2). No stagnant zones are observed, confirming effective coolant distribution. The mean velocity (vmeanvmean) is calculated as:vmean=1A∬Av dAvmean=A1∬AvdA
where AA is the cross-sectional area.
4.2. Thermal Balance Testing
At 9,000 rpm, the engine cylinder block’s spark plug gasket temperatures stabilize at 185°C (left) and 187°C (right), well below the 250°C safety threshold. Oil temperatures remain at 128°C, validating the cooling system’s efficacy.
5. Experimental Validation
5.1. Thermal Balance Test Rig
A dynamometer-based rig replicates extreme operating conditions. Coolant and oil temperatures are monitored using thermocouples, while flow rates are measured via ultrasonic sensors.
5.2. Key Outcomes
- Flow Uniformity: The engine cylinder block exhibits a maximum velocity gradient of 2.7 m/s, ensuring even heat transfer.
- Temperature Control: Cylinder head temperatures deviate by <2°C, demonstrating balanced cooling.
6. Conclusion
This study establishes a robust framework for motorcycle engine cooling system design, with a focus on the engine cylinder block. The integration of 1D simulation, CFD, and experimental testing ensures accurate flow rate prediction, uniform coolant distribution, and reliable thermal management. At 9,000 rpm, the system achieves a flow rate of 76.83 L/min with <1.3% error, while maintaining critical engine cylinder block temperatures within safe limits. The methodology is scalable to diverse engine architectures, offering a paradigm for high-performance thermal management.
