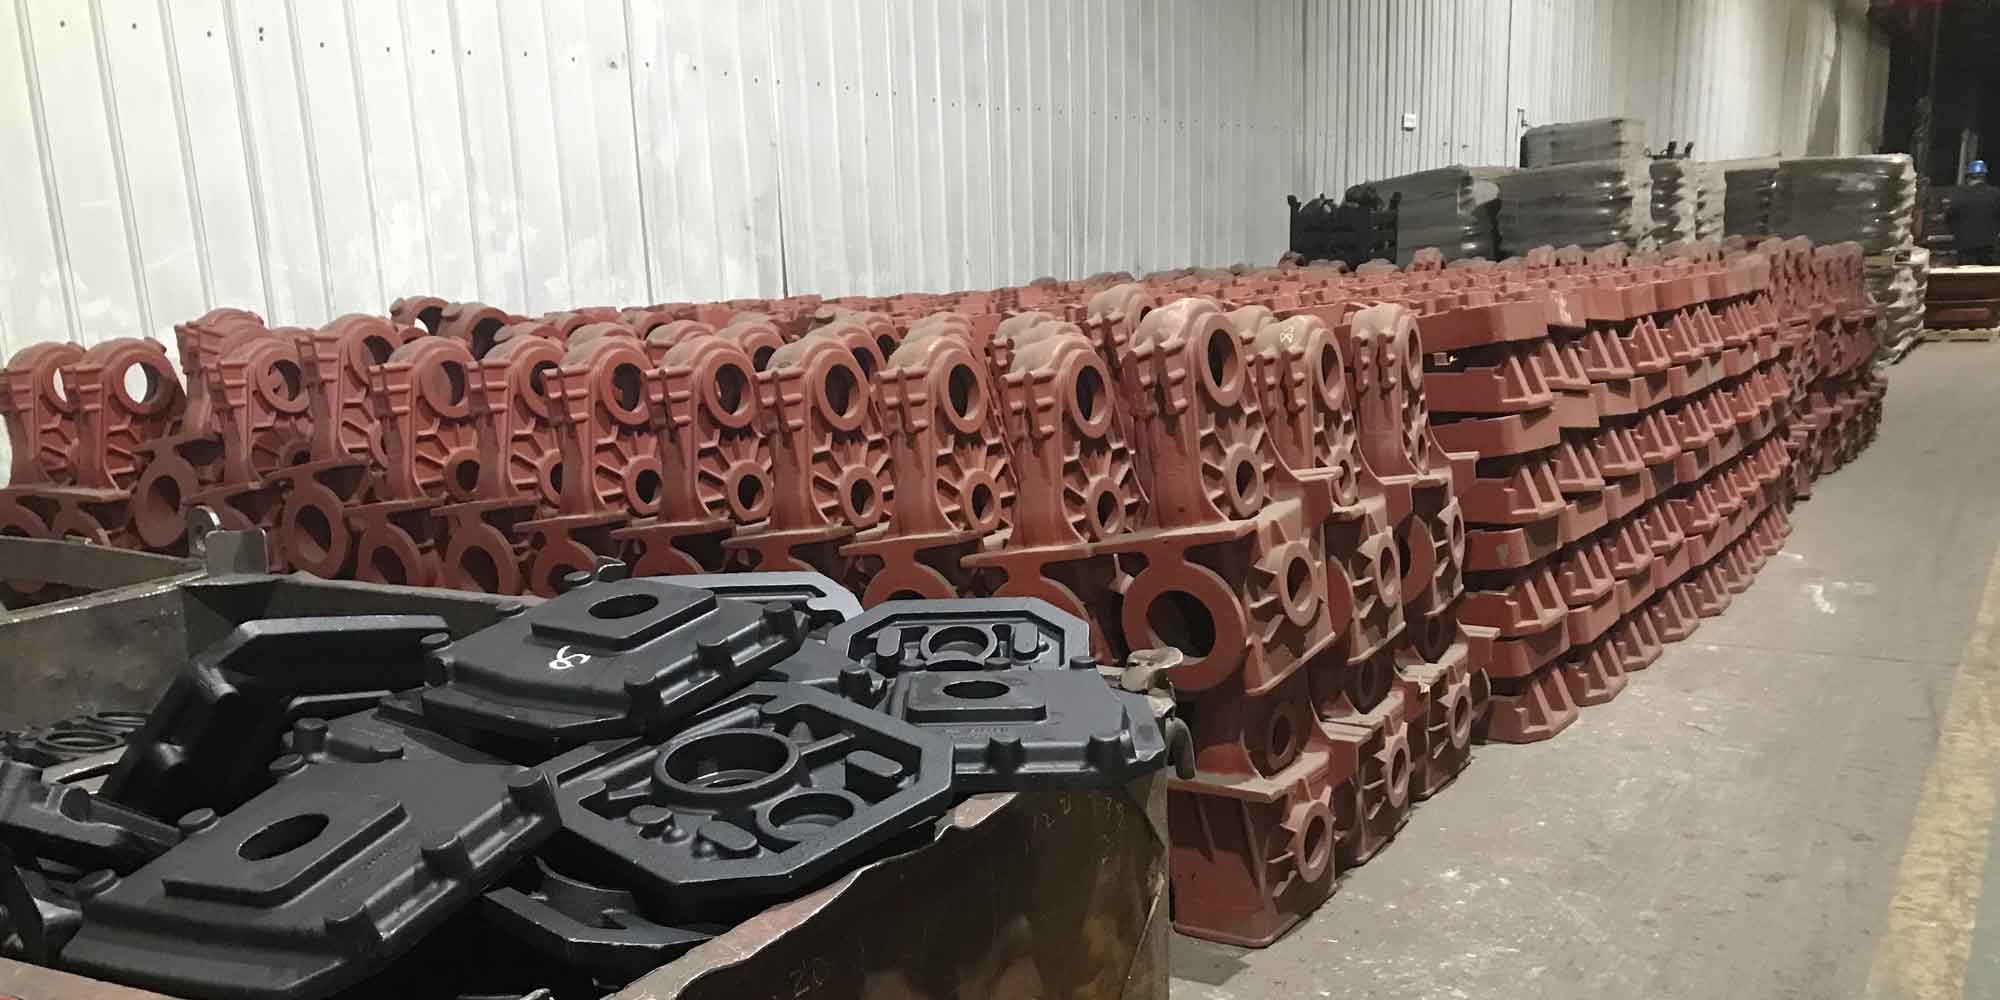
In modern steel casting operations, the continuous casting process has revolutionized production efficiency through direct hot charging and rolling. However, this advancement demands stringent control over billet quality. This article systematically examines defect formation mechanisms in small billet steel casting and proposes targeted mitigation strategies.
1. Surface Defects in Steel Casting
Primary surface defects include cold shuts, inclusions/scabs, scratches, and oscillation marks. Their causes and solutions are summarized below:
| Defect Type | Formation Mechanism | Control Measures |
|---|---|---|
| Cold Shut | Interrupted casting flow or slow strand speed | Maintain steady casting speed ≥1.8 m/min |
| Inclusions | Unstable meniscus with slag entrapment | Optimize mold flux viscosity: 0.8-1.2 Pa·s |
| Scratches | Misalignment in secondary cooling zones | Control roll gap tolerance ≤±0.5 mm |
The oscillation mark depth (d) correlates with casting parameters through:
$$ d = k \cdot \sqrt{\frac{v}{f}} $$
Where k=material constant (0.12-0.18 for low-carbon steel), v=withdrawal speed (m/min), and f=oscillation frequency (cpm).
2. Internal Defects in Steel Casting
Critical internal defects and their metallurgical relationships:
| Defect | Key Influencing Factors | Acceptable Threshold |
|---|---|---|
| Segregation | C content >0.35%, cooling rate <15°C/s | Macrosegregation index ≤1.8 |
| Subsurface Blowholes | [H] >4 ppm, mold water leakage | Blowhole density <3/cm² |
| Center Porosity | Excessive superheat >35°C | Area reduction ≤8% |
The critical solidification time (tcr) for avoiding centerline defects is given by:
$$ t_{cr} = \frac{(W/2)^2}{4\alpha \ln(S)} $$
Where W=billet width (mm), α=thermal diffusivity (8.5×10⁻⁶ m²/s for steel), and S=superheat ratio.
3. Process Design for Steel Casting Optimization
The YG Steel production line demonstrates effective defect control through:
| Parameter | Carbon Steel | Welding Wire Steel |
|---|---|---|
| Casting Radius | 9-18m arc | 9m minimum |
| Superheat Control | 25±5°C | 20±5°C |
| Secondary Cooling | 0.45 L/kg | 0.38 L/kg |
The thermal profile follows the modified Fourier equation for directional solidification:
$$ \frac{\partial T}{\partial t} = \alpha \left( \frac{\partial^2 T}{\partial x^2} + \frac{\partial^2 T}{\partial y^2} \right) – v \frac{\partial T}{\partial z} $$
Where v=casting speed and z=casting direction.
4. Industrial Implementation
The optimized steel casting process achieved remarkable results:
| Quality Metric | Before Optimization | After Optimization |
|---|---|---|
| Surface Defect Rate | 12.7% | 2.3% |
| Internal Crack Frequency | 8.9 defects/m | 0.7 defects/m |
| Productivity | 271,600 t/year | 298,400 t/year |
The metallurgical length (Lm) calculation ensures proper solidification:
$$ L_m = \frac{v \cdot D^2}{4K^2} $$
Where D=billet thickness (150 mm), K=solidification constant (26 mm/min½).
5. Conclusion
Through systematic analysis of steel casting defects and process optimization, this study demonstrates significant quality improvements. The integration of thermal models with operational parameters provides a robust framework for continuous casting process control, particularly for high-value steel products requiring stringent quality standards.
