
The headstock is a critical component in conventional machine tools, primarily responsible for supporting and driving cutting tools. Minimizing casting defects in axial holes, intermediate support plates, and bottom mounting surfaces is essential, as the casting process quality directly governs the machine’s strength, machining precision, and operational stability. This article details the design, simulation, and optimization of the casting process for an HT200 headstock, significantly reducing shrinkage porosity and enhancing yield.
Structural and Castability Analysis
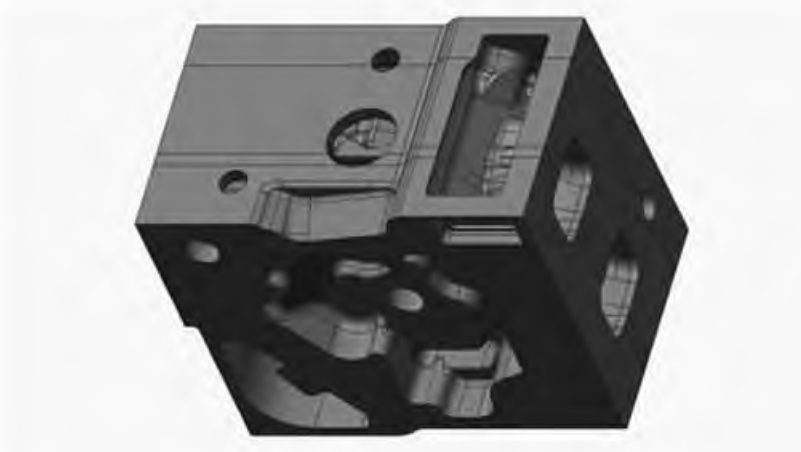
The headstock features a complex geometry with a rough casting mass of 173.6 kg and overall dimensions of 408 mm × 345 mm × 501 mm. Critical sections include thin walls (minimum 9.5 mm in bottom grooves) and thick sections prone to isolated molten pools and shrinkage defects (maximum ~87 mm at spindle bore walls). Key structural parameters are summarized below.
| Parameter | Value | Critical Location |
|---|---|---|
| Mass | 173.6 kg | – |
| Dimensions (L×W×H) | 408 mm × 345 mm × 501 mm | – |
| Minimum Wall Thickness | 9.5 mm | Bottom Grooves |
| Maximum Wall Thickness | 87 mm | Spindle Bore Walls |
Casting Process Design
Molding Material Selection
Given the HT200 material and low-volume batch production, furan resin sand was chosen for manual molding. This ensures high dimensional accuracy, superior surface finish, and efficient sand reclamation. An alcohol-based quartz powder coating was applied to mold and core surfaces to prevent burn-on defects.
Pouring Position and Parting Line
The pouring position dictates the casting’s orientation during metal filling. Alignment with the parting line simplifies molding. The selected configuration positions the large flat surface downward, allowing the cope and drag to form external contours, facilitating pattern withdrawal.
Core Design
A horizontal split mold was used. The complex internal cavity and side bore features required Core #1, incorporating horizontal prints at spindle bore ends and a cantilever print on top for positioning and anti-rolling stability. Core #1 employed three interlocking segments (Segments 1, 2, 3) assembled via pins and slots. Core #2 formed the bottom groove and oil outlet, utilizing top and bottom prints for location.
Initial Gating System Design
A semi-choked bottom-pouring gating system was designed, comprising a pouring basin, sprue, runner, and ingates. Key calculations governed the design:
Pouring Time Calculation: Based on mass flow rate requirements.
$$t = \frac{W}{\rho \cdot A \cdot v}$$
Where \( t \) is pouring time (s), \( W \) is casting weight (kg), \( \rho \) is metal density (kg/m³), \( A \) is total ingate area (m²), \( v \) is target flow velocity (m/s). The calculated pouring time was 32 s.
Gating Ratio: Established for controlled filling.
$$\Sigma F_{\text{sprue}} : \Sigma F_{\text{runner}} : \Sigma F_{\text{ingate}} = 1.2 : 1.5 : 1$$
Resulting in cross-sectional areas: Sprue = 9.6 cm², Runner = 6 cm², Ingates = 4 cm².
Rise Velocity Verification: Ensuring adequate mold filling.
$$V_{\text{rise}} = \frac{H}{t} = 1.54 \text{ cm/s}$$
Where \( H \) is casting height (cm), \( t \) is pouring time (s). This met acceptable criteria.
Numerical Simulation and Initial Analysis
The CAD model was imported into simulation software (ProCAST), meshed (1,209,825 elements), and simulated under initial casting process parameters: mold preheat 20°C, pouring temperature 1380°C, heat transfer coefficient 500 W·m⁻²·K⁻¹, air cooling.
Filling Analysis
Simulation revealed a stable filling sequence (Figure 5):
- 7.22 s: Metal reaches above ingates, filling 25% of cavity.
- 12.52 s: Steady rise, 80% filled.
- 30.16 s: Complete filling.
Velocity fields showed horizontal banding, indicating minimal turbulence and smooth mold filling, validating the initial gating design.
Defect Prediction (Initial Design)
Solidification simulation predicted significant shrinkage porosity (129.3 cm³), concentrated in thick sections: spindle bore walls, intermediate bearing plates, and near ingates. Section views confirmed shrinkage cavities at the top (dead riser effect).
| Location | Relative Severity |
|---|---|
| Spindle Bore Walls | High |
| Intermediate Bearing Plate | High |
| Near Ingates (Spindle Bore) | Medium |
| Other Areas | Low/None |
| Total Volume | 129.3 cm³ |
Process Parameter Optimization
Single Factor Analysis
The influence of pouring temperature and time on shrinkage volume was analyzed independently. Results demonstrated pouring temperature had a greater impact (higher variance).
Pouring Temperature Effect (Fixed Time = 32s):
| Temperature (°C) | Shrinkage Volume (cm³) |
|---|---|
| 1360 | 139.8 |
| 1370 | 137.6 |
| 1380 | 129.3 |
| 1390 | 139.5 |
| 1400 | 134.2 |
Pouring Time Effect (Fixed Temp = 1380°C):
| Time (s) | Shrinkage Volume (cm³) |
|---|---|
| 20 | 127.5 |
| 24 | 128.8 |
| 28 | 126.8 |
| 32 | 129.3 |
| 36 | 134.9 |
Minima were observed at 1380°C and 28s respectively.
Orthogonal Experiment
An L9 orthogonal array evaluated combined effects of temperature (1370°C, 1380°C, 1390°C) and time (26s, 28s, 30s).
| Experiment # | Pouring Temp (°C) | Pouring Time (s) | Shrinkage Volume (cm³) |
|---|---|---|---|
| 1 | 1370 | 26 | 132.6 |
| 2 | 1370 | 28 | 129.9 |
| 3 | 1370 | 30 | 129.7 |
| 4 | 1380 | 26 | 133.5 |
| 5 | 1380 | 28 | 126.8 |
| 6 | 1380 | 30 | 125.9 |
| 7 | 1390 | 26 | 132.6 |
| 8 | 1390 | 28 | 132.7 |
| 9 | 1390 | 30 | 130.9 |
Experiment 6 (1380°C, 30s) yielded the lowest shrinkage volume (125.9 cm³). However, balancing practicality and defect minimization, 1380°C and 30s were selected as optimal parameters for the casting process.
Process Optimization: Riser and Chill Design
Based on defect location analysis, the gating system was adjusted: Sprue = 9.5 cm², Runner = 11.9 cm², Ingates = 7.5 cm² (maintaining ratio). Crucially, chills and risers were incorporated:
- Chills: Eight chills (thickness: 20mm and 10mm) placed strategically at spindle bore walls, under the intermediate bearing plate, and near oil ports to accelerate local solidification.
- Risers: Two top risers (ø120 mm × 110 mm) added to compensate for shrinkage in the upper sections.
Optimized Results and Validation
Simulation of the optimized casting process (1380°C, 30s, chills, risers) showed dramatic improvement:
- Shrinkage porosity volume reduced from 129.3 cm³ to 28.9 cm³ (77.6% reduction).
- Defects were virtually eliminated from critical areas (spindle bores, bearing plates).
- Risers effectively fed the top sections, eliminating cavities.
- The casting process yield (η) was calculated as:
$$\eta = \frac{W_{\text{casting}}}{W_{\text{casting}} + W_{\text{risers}} + W_{\text{gating}}} \times 100\% = 87.7\%$$
This signifies efficient metal utilization and reduced production costs.
| Parameter | Initial Process | Optimized Process | Improvement |
|---|---|---|---|
| Shrinkage Porosity Volume | 129.3 cm³ | 28.9 cm³ | -77.6% |
| Defects in Critical Areas | Significant | Minimal/Eliminated | Major |
| Top Section Cavities | Present | Absent | Resolved |
| Process Yield (η) | Not Calculated | 87.7% | – |
Conclusion
The optimized casting process for the HT200 headstock successfully addressed shrinkage defects. Key achievements include:
- Implementation of a robust casting process using a horizontally parted furan resin sand mold with a semi-choked bottom-pouring gating system (\(\Sigma F_{\text{sprue}} : \Sigma F_{\text{runner}} : \Sigma F_{\text{ingate}} = 1.2 : 1.5 : 1\), areas 9.5 cm², 11.9 cm², 7.5 cm²) and a single complex core, enhancing precision and reducing tooling cost.
- Determination of optimal parameters (1380°C pouring temperature, 30s pouring time) through systematic single-factor and orthogonal experimentation within the casting process.
- Strategic placement of chills (8 pieces) and risers (2 pieces, ø120 mm × 110 mm) achieved a 77.6% reduction in shrinkage porosity (28.9 cm³), ensured critical section integrity, and delivered a high process yield of 87.7%.
This systematic approach to casting process design and optimization, leveraging simulation and experimental methods, significantly improved casting quality, reliability, and production efficiency for the HT200 headstock.