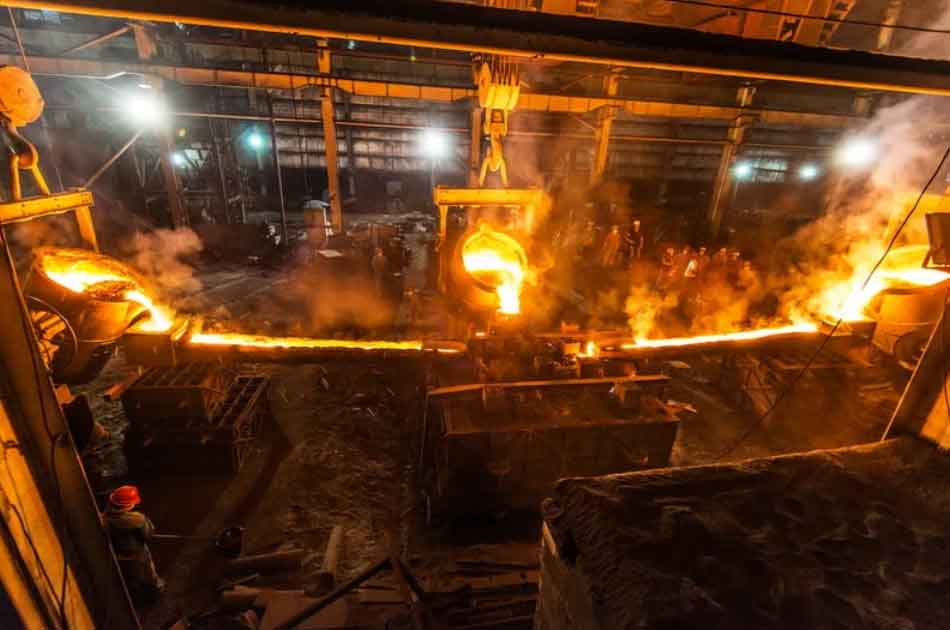
The casting industry, hailed as the “mother of manufacturing,” occupies a pivotal position in China’s industrial ecosystem. With annual production exceeding 20 million tons since 2000, China has maintained its position as the world’s largest casting producer for over two decades. However, significant disparities persist compared to industrial powers like Germany and Japan:
| Performance Metric | China | Industrial Nations |
|---|---|---|
| Average Productivity (tons/worker/year) | 15-20 | 60-80 |
| Energy Consumption (kWh/ton) | 550-600 | 300-350 |
| Scrap Rate (%) | 8-12 | 2-3 |
These disparities stem from fragmented industry structure, where over 24,000 foundries operate with average outputs below 800 tons/year. The productivity gap can be modeled as:
$$P_{china} = \frac{1}{5} \sum_{i=1}^{n} \left( \frac{T_i}{L_i} \right) \times \eta_{global}$$
Where $T_i$ = annual output per foundry, $L_i$ = labor force per foundry, and $\eta_{global}$ = international efficiency benchmark.

The automotive sector drives 30% of China casting demand, with engine blocks, cylinder heads, and transmission cases comprising key application areas. Material composition reveals strategic imbalances:
| Material Type | China Share (%) | Global Benchmark (%) |
|---|---|---|
| Ductile Iron | 23.7 | 35-42 |
| Aluminum Alloys | 5.9 | 15-18 |
| Magnesium Alloys | <1 | 3-5 |
Technological adoption follows a diffusion model where advanced process penetration $A_t$ at time $t$ is:
$$A_t = A_{max} \left(1 – e^{-k(T – T_0)}\right)$$
With $k$ = adoption rate constant (0.15 for China casting vs. 0.35 globally), and $T_0$ = initial adoption year.
Environmental compliance remains critical, where emissions control cost $C_e$ impacts competitiveness:
$$C_e = \alpha \cdot V_{exhaust} + \beta \cdot M_{slag} + \gamma \cdot E_{noise}$$
With coefficients $\alpha=0.85$, $\beta=0.42$, $\gamma=0.18$ for China casting operations.
Strategic transformation requires specialization through cluster development. Regional production concentration shows:
| Region | Production Share (%) | Specialization Focus |
|---|---|---|
| East China | 40.3 | Automotive castings |
| North China | 20.7 | Heavy machinery |
| Central China | 19.5 | Hydraulic components |
Export growth follows logistic function dynamics:
$$E(t) = \frac{K}{1 + e^{-r(t-t_0)}}$$
Where $K$ = saturation level (5 million tons), $r$ = growth rate (0.12), $t_0$ = inflection year (2025).
Core innovation priorities for China casting competitiveness include:
- Digital integration: Implementation of CAE/CAD/RPM systems reducing development time by 40%
- Material science: Development of nanocomposite alloys enhancing strength-to-weight ratios
- Closed-loop systems: 95% sand reclamation and 90% thermal energy recovery
Global manufacturing relocation creates FDI opportunities, with casting equipment investments growing at 12.4% CAGR. Quality standardization through ISO 9001/14001 adoption shows exponential progression:
$$N_{cert}(t) = N_0 \cdot 2^{t/\tau}$$
Where $\tau$ = doubling period (2.5 years), $N_0$ = baseline certifications (200 in 2020).
Labor productivity enhancement follows Cobb-Douglas human capital augmentation:
$$Y = A \cdot K^\alpha \cdot (hL)^{1-\alpha}$$
With human capital $h$ as critical multiplier for China casting output $Y$.
The strategic pathway for China casting dominance combines specialization, technological leapfrogging, and circular economy principles. Foundries adopting integrated smart manufacturing platforms show 35% higher productivity and 28% lower defect rates versus conventional operations.
