
As a leading steel castings manufacturer, I have conducted an extensive investigation into the dimensional tolerances of investment castings produced in various factories. This study aims to analyze the current state of dimensional accuracy in China’s casting industry, particularly focusing on how steel casting manufacturers adhere to international and national standards. The findings are critical for improving quality control and competitiveness among China casting manufacturers. In this article, I will present detailed measurements, statistical analyses, and comparisons with standards like ISO 8062 and GB/T 6414, using tables and formulas to summarize the data comprehensively.
Investment casting, known for its ability to produce complex and precise components, is widely used in industries such as aerospace, automotive, and general machinery. For steel castings manufacturer operations, maintaining tight dimensional tolerances is essential to meet design specifications and ensure part functionality. Over the years, international standards have evolved to define acceptable tolerance levels, with ISO 8062 and its Chinese equivalent GB/T 6414 being the benchmarks. These standards classify dimensional tolerances into multiple grades, such as CT1 to CT10 for castings, with investment castings typically expected to achieve CT4 to CT6 for ferrous metals. As a steel casting manufacturers in China, we must evaluate our processes against these criteria to identify areas for improvement.
In this study, I selected three representative types of investment casting factories in China, categorized as Type A, Type B, and Type C, based on their technological levels and production environments. Type A factories utilize advanced equipment with strict control over process parameters, such as temperature and humidity, and employ resin-based patterns with low shrinkage rates (e.g., 0.5% to 1.0%). Their shell-building materials include silica sol and zircon flour for the face coat, and silica sol or ethyl silicate for backup coats. These facilities often produce high-value components like aerospace parts and high-temperature alloys. Type B factories also feature modern equipment but focus on mass-producing consumer goods, such as stainless steel fittings and golf club heads, using similar materials but with slight variations in process control. In contrast, Type C factories operate with less sophisticated technology, relying on wax-based patterns with higher shrinkage (e.g., 1.0% to 1.5%) and water glass-based shell systems, commonly used for general machinery and low-alloy steel parts. This classification helps in understanding how different China casting manufacturers perform in terms of dimensional precision.
To assess dimensional accuracy, I measured critical dimensions on three different-sized castings from each factory type under actual production conditions. For each casting, I selected dimensions that were large or had significant variations, and collected a sample size of 30 measurements per dimension. The nominal dimensions, measured values, and statistical outcomes are summarized in the following sections. Key concepts like precision, accuracy, and tolerance are integral to this analysis. Precision refers to the consistency of repeated measurements, quantified by the standard deviation (s), while accuracy indicates how close the mean value (x̄) is to the nominal dimension. The tolerance range is often defined as ±3s, covering approximately 99.73% of the data in a normal distribution, which aligns with the principles of statistical process control used by steel castings manufacturer companies.
The dimensional tolerance standards, such as ISO 8062 and GB/T 6414, provide graded tolerance values based on the basic size of the casting. For instance, Table 1 illustrates the tolerance values for different CT grades, which I will reference in the analysis. It is important to note that these standards reserve CT1 and CT2 for future, more precise requirements, and for small dimensions (≤16 mm), the tolerance can be tightened by one or two grades. As a steel casting manufacturers, we must ensure that our processes meet these benchmarks to remain competitive globally.
| Basic Size Range (mm) | CT4 Tolerance (±mm) | CT5 Tolerance (±mm) | CT6 Tolerance (±mm) | CT7 Tolerance (±mm) | CT8 Tolerance (±mm) |
|---|---|---|---|---|---|
| 10 to 16 | 0.14 | 0.20 | 0.28 | 0.40 | 0.56 |
| 16 to 25 | 0.16 | 0.24 | 0.32 | 0.46 | 0.64 |
| 25 to 40 | 0.18 | 0.26 | 0.36 | 0.52 | 0.72 |
| 40 to 63 | 0.20 | 0.28 | 0.40 | 0.58 | 0.80 |
| 63 to 100 | 0.22 | 0.32 | 0.44 | 0.64 | 0.88 |
| 100 to 160 | 0.24 | 0.36 | 0.50 | 0.72 | 1.00 |
In the measurement process, I used precision instruments, including digital calipers with a resolution of 0.01 mm, to ensure reliable data collection. For each casting dimension, I calculated the mean value (x̄) and standard deviation (s) using the following formulas:
$$ \bar{x} = \frac{1}{N} \sum_{i=1}^{N} x_i $$
$$ s = \sqrt{\frac{1}{N-1} \sum_{i=1}^{N} (x_i – \bar{x})^2} $$
where N is the sample size (30 in this case), and x_i represents each individual measurement. The tolerance range was then determined as ±3s, and this range was compared to the standard tolerance grades to assign a CT level. This approach is commonly adopted by steel casting manufacturers to validate process capability.
The results for each factory type are summarized in Table 2, which includes the nominal dimensions, mean values, standard deviations, and corresponding CT grades. For example, in Type A factories, the dimensions showed high consistency, with standard deviations as low as 0.05 mm, leading to tolerance ranges within CT4 to CT5. Type B factories performed similarly, achieving CT5 to CT6, while Type C factories had higher variability, with standard deviations up to 0.15 mm, resulting in CT7 or worse grades. This highlights the disparities among China casting manufacturers in terms of technological advancement.
| Factory Type | Nominal Dimension (mm) | Mean Value (x̄, mm) | Standard Deviation (s, mm) | Tolerance Range (±3s, mm) | Assigned CT Grade |
|---|---|---|---|---|---|
| Type A | 50.0 | 50.02 | 0.05 | 0.15 | CT4 |
| Type A | 100.0 | 99.98 | 0.07 | 0.21 | CT5 |
| Type A | 150.0 | 150.05 | 0.08 | 0.24 | CT5 |
| Type B | 50.0 | 50.03 | 0.06 | 0.18 | CT5 |
| Type B | 100.0 | 100.04 | 0.09 | 0.27 | CT6 |
| Type B | 150.0 | 149.97 | 0.10 | 0.30 | CT6 |
| Type C | 50.0 | 50.10 | 0.12 | 0.36 | CT7 |
| Type C | 100.0 | 100.15 | 0.14 | 0.42 | CT7 |
| Type C | 150.0 | 150.20 | 0.15 | 0.45 | CT8 |
From the data, it is evident that Type A and Type B factories, which represent advanced steel castings manufacturer operations, consistently achieve tolerances within CT4 to CT6, meeting the requirements of ISO 8062 and GB/T 6414. In contrast, Type C factories, often using outdated methods, fall short, with tolerances in the CT7 to CT8 range. This discrepancy can be attributed to factors such as pattern material shrinkage, shell system stability, and environmental controls. For instance, the shrinkage rate for resin-based patterns in Type A and B is typically 0.5% to 1.0%, whereas wax-based patterns in Type C have higher shrinkage of 1.0% to 1.5%, leading to greater dimensional variations. As a steel casting manufacturers, we must address these issues through process optimization.
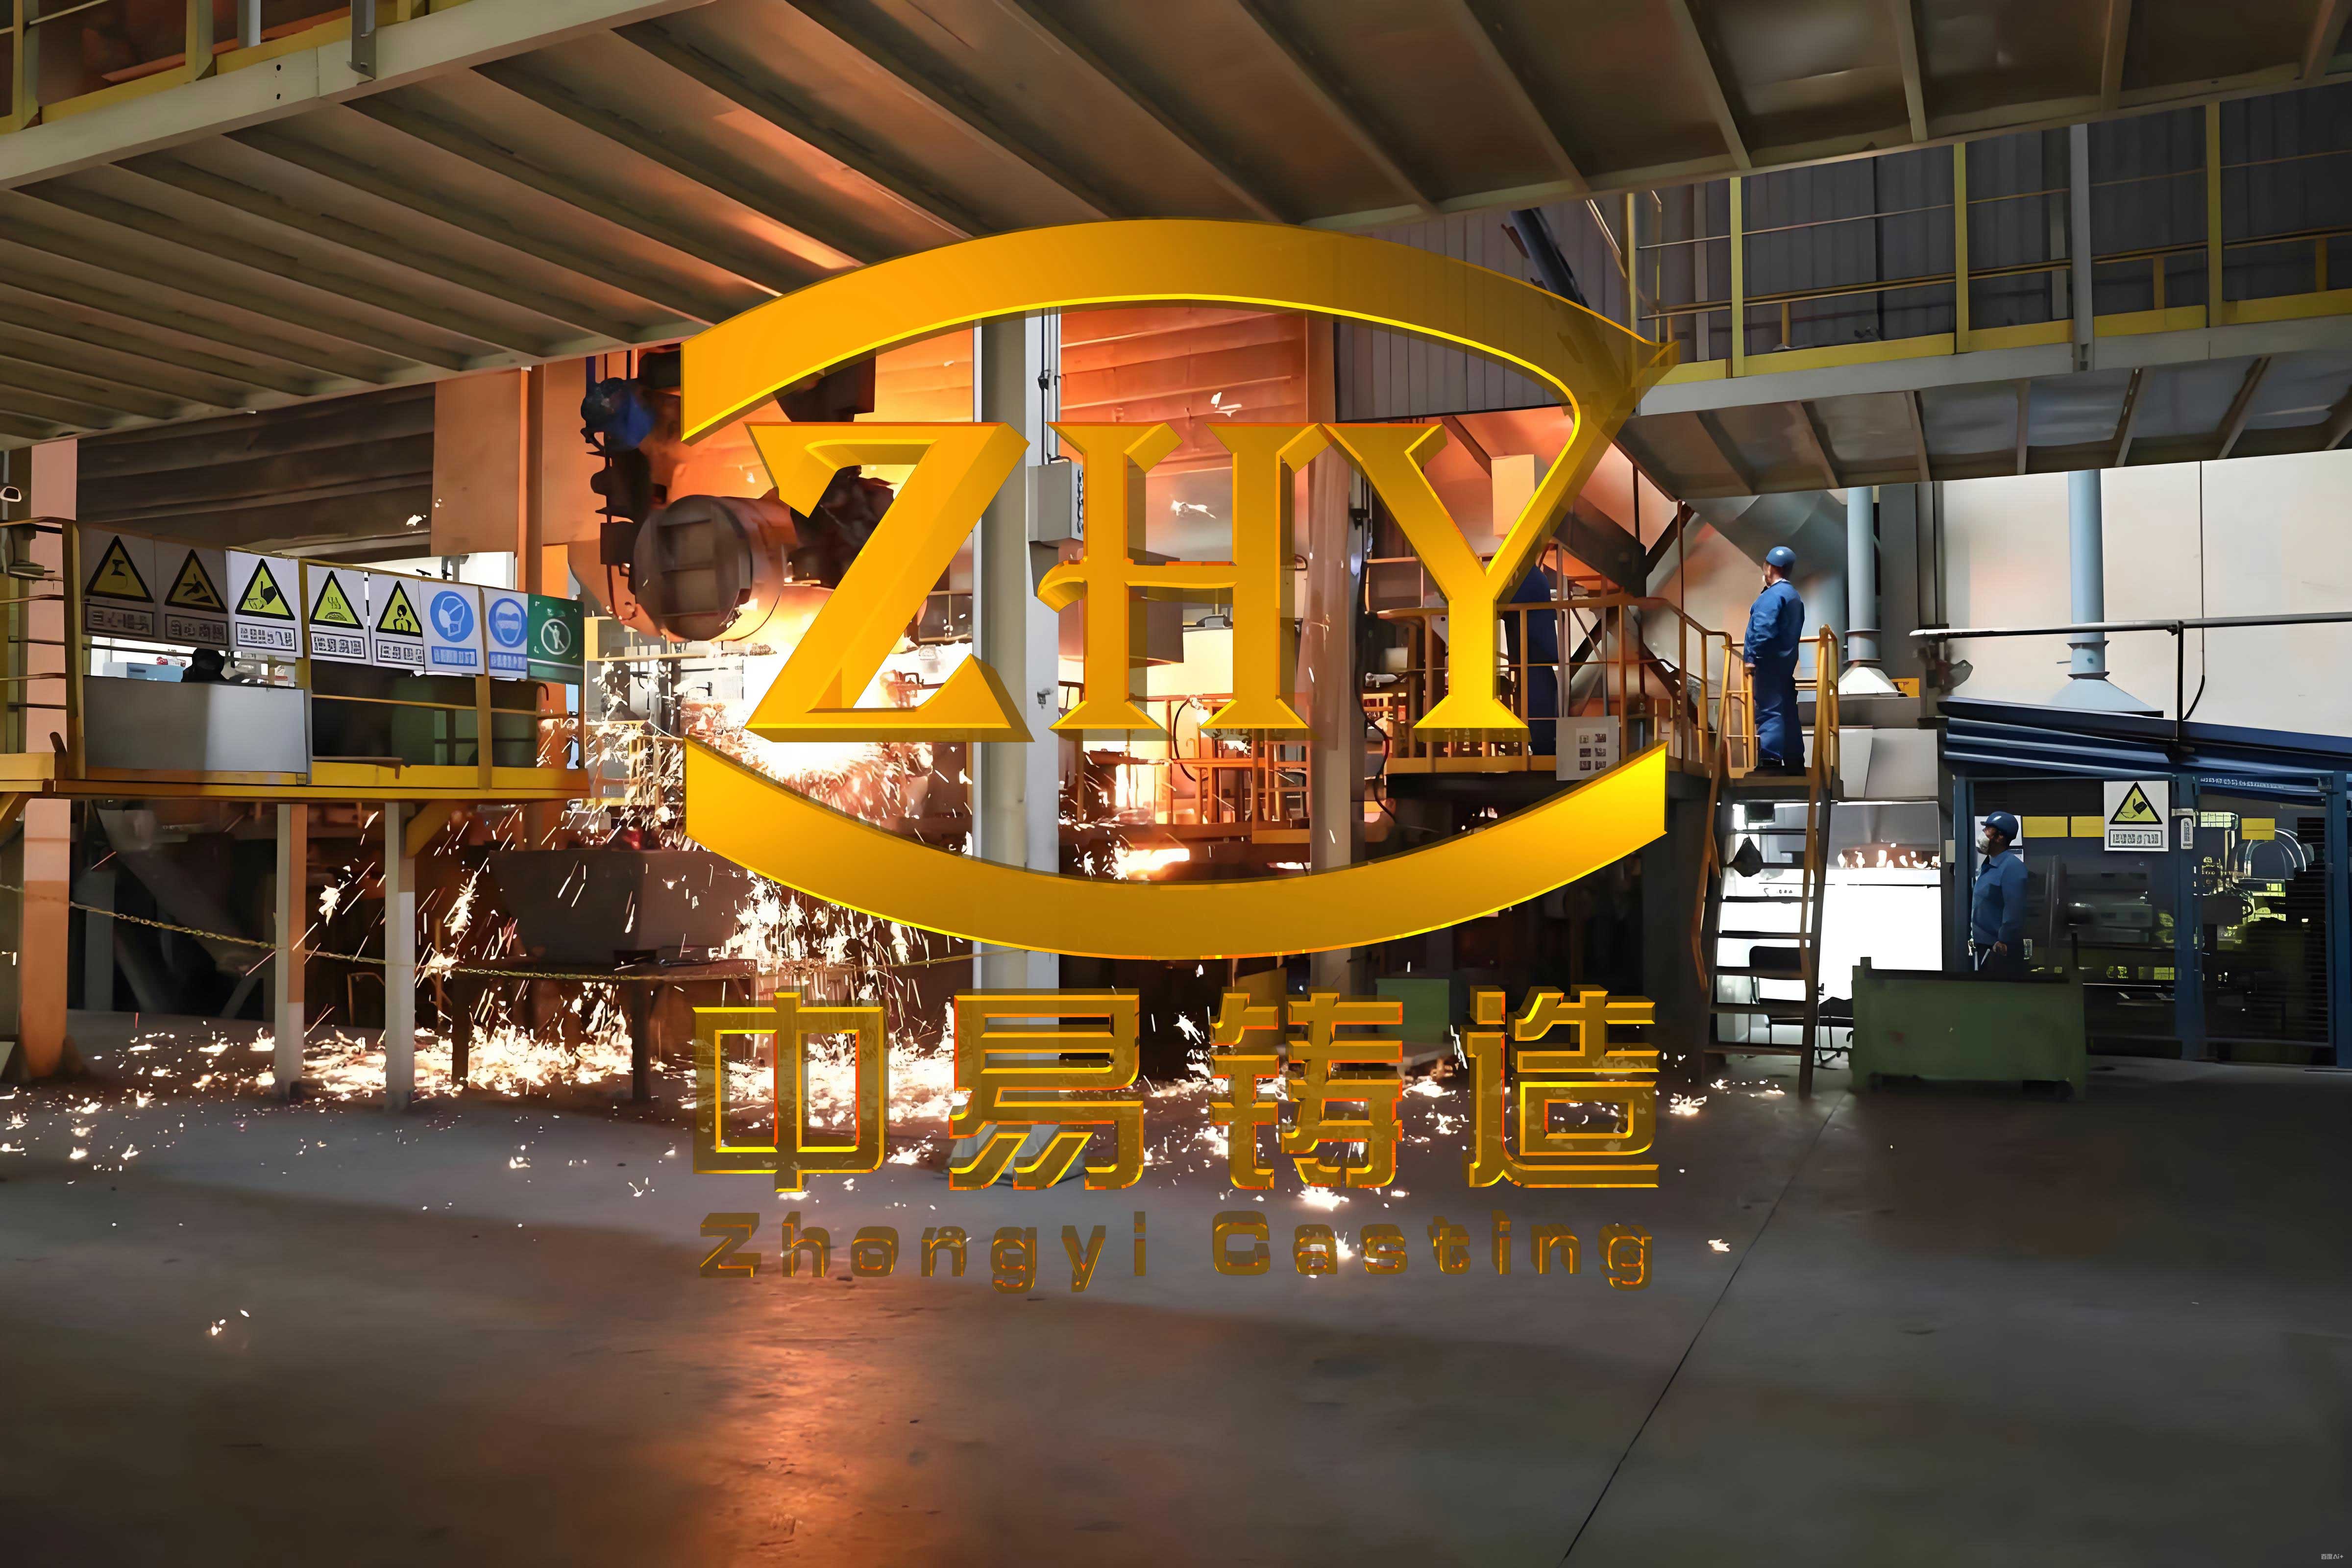
To further illustrate the manufacturing environment, consider the following image that depicts a typical setup in a modern steel castings manufacturer facility. This visual emphasizes the importance of controlled processes in achieving high dimensional accuracy.
The concept of precision and accuracy is fundamental in this context. Precision, measured by the standard deviation, reflects the random errors in the process, while accuracy, indicated by the deviation of the mean from nominal, relates to systematic errors such as mold design inaccuracies. In mathematical terms, the overall process capability can be evaluated using the process capability index (Cpk), which combines both aspects:
$$ Cpk = \min\left( \frac{USL – \bar{x}}{3s}, \frac{\bar{x} – LSL}{3s} \right) $$
where USL and LSL are the upper and lower specification limits derived from the tolerance standards. For investment castings, a Cpk value greater than 1.33 is generally considered acceptable for critical applications. In my analysis, Type A factories showed Cpk values around 1.5, indicating robust processes, whereas Type C had values below 1.0, highlighting the need for improvements. This is crucial for China casting manufacturers aiming to export to global markets.
Another key aspect is the impact of material selection on dimensional stability. As a steel castings manufacturer, we often work with various alloys, and their behavior during solidification can affect shrinkage and distortion. For example, stainless steel castings may exhibit different thermal expansion coefficients compared to carbon steels, influencing the final dimensions. The relationship between thermal contraction and dimensional change can be modeled as:
$$ \Delta L = L_0 \cdot \alpha \cdot \Delta T $$
where ΔL is the change in length, L_0 is the initial length, α is the coefficient of thermal expansion, and ΔT is the temperature change during cooling. By controlling these parameters, steel casting manufacturers can minimize deviations and achieve tighter tolerances.
In terms of economic implications, the ability to meet international tolerance standards directly affects the competitiveness of China casting manufacturers. Factories that consistently achieve CT4 to CT6 grades can command higher prices and secure contracts in demanding sectors like aerospace and medical devices. Conversely, those stuck at CT7 or lower may face rejections and reduced profitability. Therefore, investing in advanced pattern-making technologies, such as 3D printing for molds, and implementing statistical process control (SPC) can yield significant returns. For instance, SPC involves monitoring control charts for key dimensions, with actions taken when data points fall outside control limits defined as:
$$ UCL = \bar{x} + A_2 \bar{R} $$
$$ LCL = \bar{x} – A_2 \bar{R} $$
where UCL and LCL are the upper and lower control limits, A_2 is a constant based on sample size, and R̄ is the average range of subgroups. This proactive approach helps steel castings manufacturer teams maintain consistency and reduce scrap rates.
Looking ahead, the future of investment casting in China depends on embracing digitalization and automation. Industry 4.0 technologies, such as IoT sensors and AI-driven analytics, can real-time monitor process variables and predict dimensional deviations. For example, machine learning algorithms can analyze historical data to optimize pouring parameters and reduce variability. As a steel casting manufacturers, we are exploring these innovations to enhance our capabilities and set new benchmarks in dimensional accuracy.
In conclusion, this study demonstrates that while many China casting manufacturers, particularly Type A and B factories, are capable of producing investment castings with tolerances conforming to CT4 to CT6 grades, there is a significant gap in Type C facilities. By addressing technological limitations and adopting best practices, the entire industry can elevate its standards. As a steel castings manufacturer, I recommend continuous training, investment in R&D, and adherence to international standards to ensure long-term success. The insights from this analysis not only benefit steel casting manufacturers but also contribute to the broader understanding of precision manufacturing in the global market.