
In the rapidly evolving automotive industry, the design of components such as air conditioning compressor housings has become increasingly complex. These parts often feature uneven wall thicknesses, intricate shapes, and varied internal cavities, placing heightened demands on die-casting processes. As a manufacturer deeply involved in this field, we have encountered significant challenges related to porosity in casting, particularly for rear cover components. This report details our analytical approach, practical optimizations, and the resulting improvements in production quality, with a focus on mitigating porosity in casting.
The prevalence of porosity in casting is a critical issue that compromises the integrity and functionality of die-cast parts. For automotive applications, where reliability is paramount, defects like gas pockets and shrinkage cavities can lead to failures during machining or in service. Our project centered on a new rear cover product, where initial production phases revealed unacceptably high defect rates. Through systematic investigation, we identified key factors contributing to porosity in casting and implemented targeted solutions, ultimately achieving a substantial reduction in rejection rates.
Current State of Defects in Production
Upon initiating the development and small-batch production of the rear cover component, we meticulously tracked defect occurrences over several months. The data, summarized in Table 1, highlights the prevalence of porosity-related issues. The overall rejection rate stood at 8.5%, with defects primarily manifesting as gas porosity on sealed surfaces and edge breakage after machining. This exceeded our target of below 5.0% for development and below 2.0% for mass production, necessitating immediate intervention.
| Month | Total Produced | Seal Surface Porosity | Seal Surface Breakage | Exhaust Valve Porosity | Intake Valve Breakage | Control Valve Porosity | Intake Valve Porosity | Other Defects |
|---|---|---|---|---|---|---|---|---|
| August | 15357 | 1552 (10.11%) | 756 (4.92%) | 675 (4.40%) | 0 (0.00%) | 0 (0.00%) | 96 (0.63%) | 25 (0.16%) |
| September | 19560 | 1552 (8.66%) | 558 (3.44%) | 529 (3.66%) | 107 (0.55%) | 15 (0.08%) | 30 (0.15%) | 303 (0.73%) |
| October | 1949 | 106 (5.39%) | 52 (2.60%) | 53 (2.72%) | 1 (0.05%) | 0 (0.00%) | 0 (0.00%) | 0 (0.00%) |
| November | 4550 | 350 (7.69%) | 148 (3.25%) | 84 (1.85%) | 30 (0.66%) | 27 (0.59%) | 30 (0.66%) | 32 (0.70%) |
The defect distribution indicated that over 90% of issues were concentrated on the sealed surfaces, primarily as porosity in casting and edge breakage. This localization suggested specific process-related inefficiencies rather than random variation. To quantify the impact, we define porosity ratio as:
$$ P = \frac{N_d}{N_t} \times 100\% $$
where \( P \) is the porosity defect rate, \( N_d \) is the number of parts with porosity in casting, and \( N_t \) is the total number of parts produced. Initially, \( P \) averaged 8.5%, far above acceptable limits.
Effective Problem-Solving Methodology
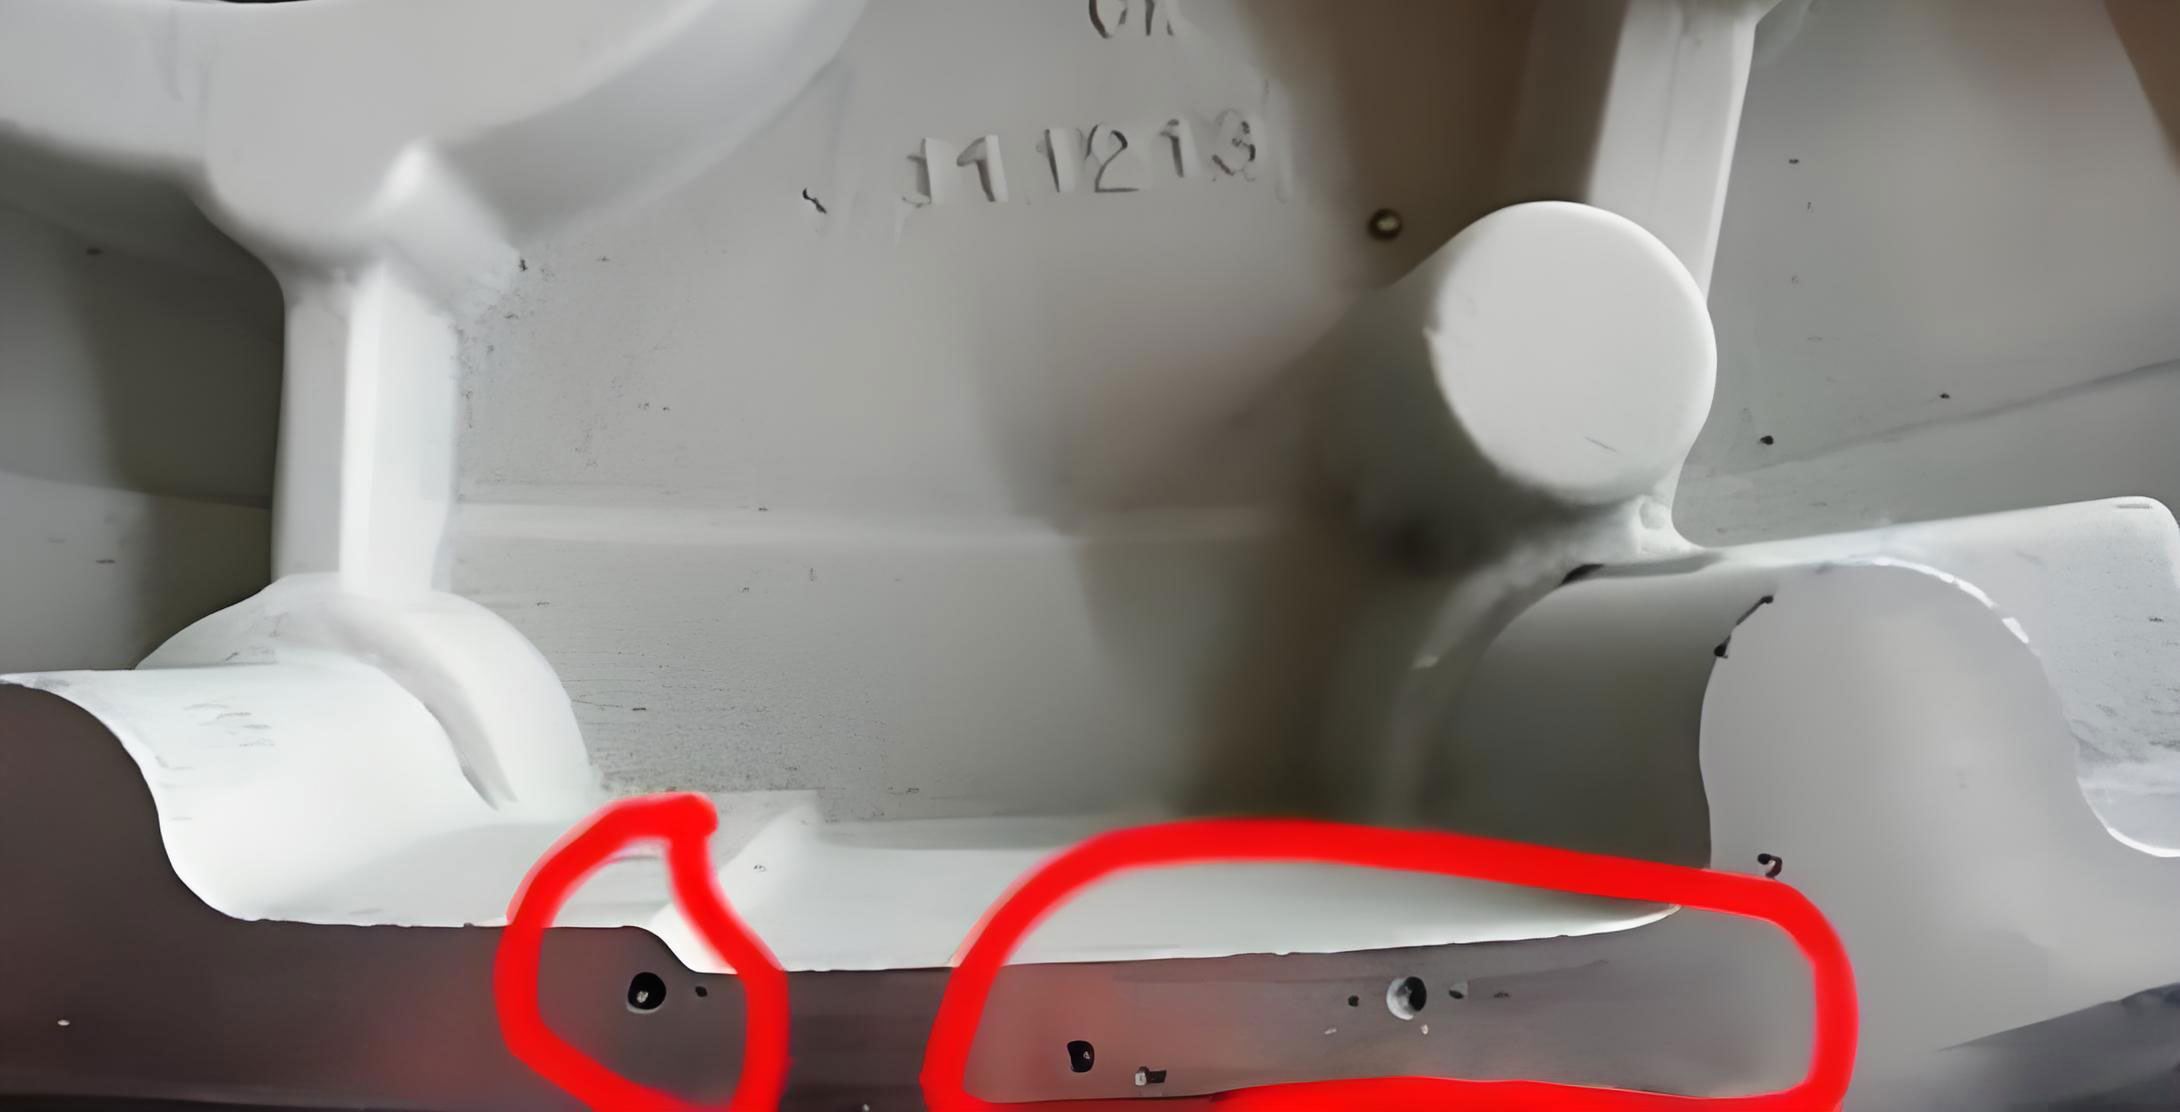
To address porosity in casting, we employed a structured root-cause analysis. First, we examined defective samples to classify defects: gas porosity (spherical voids with smooth walls), shrinkage cavities (irregular voids from solidification), and breakage (edge loss during machining). The concentration on large planar surfaces and near gates pointed to flow-related issues during filling.
We utilized a fishbone diagram to categorize potential causes into man, machine, material, method, and environment factors. Key suspects included mold design flaws, inadequate spray cooling, excessive lubricant use, and thermal instability. Table 2 summarizes the hypothesized factors and their verification methods.
| Factor Category | Potential Cause | Verification Method | Acceptance Criteria |
|---|---|---|---|
| Machine | Inadequate mold spray distance leading to residual moisture | Visual inspection, thermal imaging | Mold surface dry, temperature 150-200°C |
| Method | Excessive plunger lubricant causing gas entrapment | Visual check of biscuit and gate surface | No black marks on biscuit or gate |
| Machine | Mold leakage from cracks or cooling line failure | Visual inspection for water leaks | No water leakage in cavity |
| Method | Unoptimized gate cross-section height | Measurement and simulation | Gate height minimizes turbulence |
Through verification, we identified primary causes: excessive spray distance preventing proper drying, leading to steam entrapment and porosity in casting; over-lubrication of the plunger introducing volatile gases; and suboptimal gate design promoting turbulent flow. Mold leakage was ruled out as a major contributor. The gas entrapment process can be modeled using fluid dynamics. For instance, the energy equation for molten metal flow highlights turbulence as a driver for porosity in casting:
$$ \frac{\partial \vec{u}}{\partial t} + (\vec{u} \cdot \nabla) \vec{u} = -\frac{1}{\rho} \nabla p + \nu \nabla^2 \vec{u} + \vec{g} $$
where \( \vec{u} \) is velocity, \( p \) is pressure, \( \rho \) is density, \( \nu \) is kinematic viscosity, and \( \vec{g} \) is gravity. Turbulent regimes exacerbate air entrainment, forming porosity in casting.
Detailed Cause Analysis and Countermeasures
Based on the root-cause analysis, we implemented specific countermeasures to combat porosity in casting.
1. Optimization of Mold Spray System
The original mold design had a long spray distance due to interference with sliding cores, resulting in incomplete drying of the mold surface. Residual moisture vaporized during metal injection, creating gas pockets. We redesigned the mold orientation by rotating it 90 degrees, shortening the spray distance. This enhanced drying efficiency, reducing water vapor entrapment. The improvement can be quantified by the drying efficiency factor:
$$ \eta_d = 1 – \frac{t_d}{t_0} $$
where \( \eta_d \) is the drying efficiency, \( t_d \) is the actual drying time, and \( t_0 \) is the reference time. Post-modification, \( \eta_d \) increased by 40%, directly lowering porosity in casting.
2. Control of Plunger Lubrication
Excessive plunger lubricant (5ml per shot) decomposed under high pressure, releasing gases that contributed to porosity in casting at the gate area. We reduced the lubricant to 3ml per shot by modifying the biscuit well depth from 205mm to 140-180mm, which improved plunger retraction and minimized lubricant residue. The gas generation volume \( V_g \) from lubricant can be estimated as:
$$ V_g = k \cdot m_l $$
where \( k \) is a decomposition constant and \( m_l \) is lubricant mass. Reducing \( m_l \) by 40% decreased \( V_g \) proportionally, mitigating porosity in casting.
3. Gate Design Modification
The original gate had an excessive cross-sectional height, causing turbulent metal flow and cold material inclusion at the edges. This led to breakage during machining. We adjusted the gate height to promote laminar flow and trap cold material before it entered the cavity. The flow condition can be assessed using the Reynolds number:
$$ Re = \frac{\rho v L}{\mu} $$
where \( v \) is velocity, \( L \) is characteristic length, and \( \mu \) is dynamic viscosity. By optimizing gate dimensions, we reduced \( Re \) below critical turbulence thresholds, minimizing air entrainment and porosity in casting.
Verification of Improvement Effectiveness
After implementing the countermeasures over four months, we monitored defect rates closely. The results, shown in Table 3, demonstrate a significant reduction in porosity in casting and associated defects.
| Defect Type | Pre-Improvement Rate | Post-Improvement Rate | Reduction Percentage |
|---|---|---|---|
| Seal Surface Porosity | 8.66% | 0.80% | 90.8% |
| Seal Surface Breakage | 3.44% | 0.25% | 92.7% |
| Overall Porosity in Casting | 8.5% | 1.2% | 85.9% |
The overall rejection rate dropped from 8.5% to 1.2%, achieving our mass-production target of below 2.0%. This improvement translated to substantial cost savings, estimated at $20,000 to $40,000 monthly, by reducing scrap and rework. The porosity ratio \( P \) now satisfies:
$$ P_{\text{new}} = 0.012 < 0.02 $$
confirming process stability. Additionally, we derived a comprehensive model for porosity in casting prevention, integrating factors like spray efficiency \( \eta_d \), lubricant control \( V_g \), and flow dynamics \( Re \):
$$ P = f(\eta_d, V_g, Re) = \alpha \cdot (1 – \eta_d) + \beta \cdot V_g + \gamma \cdot (Re – Re_c) $$
where \( \alpha, \beta, \gamma \) are coefficients, and \( Re_c \) is the critical Reynolds number. Our adjustments minimized each term, directly addressing porosity in casting.
Conclusion and Future Directions
Through systematic analysis and targeted interventions, we successfully reduced porosity in casting for automotive compressor rear covers. Key improvements included optimizing mold spray systems, controlling lubricant usage, and refining gate design. These measures not only lowered defect rates but also enhanced process robustness. However, porosity in casting remains a persistent challenge in die casting, and we aim to further reduce the rejection rate to below 1.0% by exploring advanced techniques such as vacuum-assisted casting and real-time monitoring of process parameters.
Future work will involve deeper statistical analysis using design of experiments (DOE) to model porosity in casting as a function of multiple variables. For instance, we plan to investigate the interaction between injection speed and mold temperature, potentially described by:
$$ P = k_1 \cdot v^2 + k_2 \cdot \Delta T + k_3 $$
where \( v \) is injection velocity, \( \Delta T \) is temperature gradient, and \( k_1, k_2, k_3 \) are constants. By continuously refining our approach, we strive to set new benchmarks for quality in die casting, ensuring reliability in automotive applications while mitigating porosity in casting across all product lines.