
In the competitive landscape of engineering machinery, steel castings serve as critical components, particularly in applications like track shoes for crawler cranes. With the rapid expansion of renewable energy sectors, such as wind power, the demand for these steel castings has surged. However, as consumable parts in traditional machinery, steel castings for track shoes face intense market competition and price transparency. To thrive, companies must not only ensure high-quality steel castings but also optimize production processes to control costs effectively. This article delves into a first-person perspective on cost analysis and control during the new product development phase for steel castings, emphasizing track shoe production. By examining factors influencing production costs and implementing targeted measures, we can enhance profitability and market position for steel castings.
The development of new steel castings often begins with trial production, where processes are immature and labor skills are underdeveloped. This phase typically results in negative contribution margins, posing challenges for profitability. For instance, consider a 150 kg track shoe made from steel castings. Based on market data, the average unit price for such steel castings (excluding VAT) is around ¥11,000 per ton, with slight variations based on weight. After strategic negotiations, a contract price of ¥10,965.87 per ton was secured for these steel castings. However, during trial production, the total variable cost per ton reached ¥11,916.33, leading to a loss scenario. The contribution margin analysis for these steel castings is summarized below.
| Item | Steel Castings (¥/ton) |
|---|---|
| Price (excluding VAT) | 10,965.87 |
| Direct Materials | 4,702.73 |
| Energy | 2,417.50 |
| Processing Fees | 2,982.29 |
| Direct Labor | 1,689.44 |
| Scrap Loss | 124.38 |
| Total Variable Cost | 11,916.33 |
| Unit Contribution Margin | -950.46 |
| Contribution Margin Ratio | -8.67% |
The unit contribution margin (CM) is derived from the formula:
$$ \text{CM} = P – VC $$
where \( P \) represents the price per ton of steel castings and \( VC \) denotes the total variable cost per ton. The contribution margin ratio (CMR) is calculated as:
$$ \text{CMR} = \frac{\text{CM}}{P} $$
For the trial production of steel castings, these values indicate a negative contribution, underscoring the urgency for cost optimization in manufacturing steel castings. Without improvements, producing steel castings at such costs would be unsustainable in the market.
To identify cost-saving opportunities, we analyze the variable cost structure of steel castings. The production of steel castings involves multiple cost components, with direct materials and processing fees being predominant. For the 150 kg track shoe steel castings, the cost distribution during trial production is as follows.
| Cost Item | Percentage of Total Variable Cost |
|---|---|
| Direct Materials | 39% |
| Processing Fees | 25% |
| Energy | 20% |
| Direct Labor | 14% |
| Scrap Loss | 1% |
This analysis reveals that direct materials and processing fees collectively account for over 60% of variable costs in steel castings production, making them primary targets for cost control. By focusing on these areas, we can significantly reduce the overall production cost of steel castings.
Direct material costs in steel castings are heavily influenced by the melting process, which consumes approximately 80% of total direct materials. To optimize this, we implemented several measures aimed at improving efficiency and reducing waste in steel castings production.
First, enhancing the process yield by increasing steel utilization is crucial for steel castings. We applied core hollowing technology to reduce weight, saving 70-80 kg of steel per ton of steel castings. Additionally, mold modifications allowed for thinner wall thicknesses in steel castings, and riser size optimizations saved 6-10 kg of steel per ton. The overall savings from these improvements can be expressed as:
$$ \text{Material Savings} = \text{Initial Steel Usage} – \text{Optimized Steel Usage} $$
For steel castings, this translated to a reduction of ¥380-450 per ton in direct material costs. Second, adjusting alloy compositions in steel castings helped lower expenses while maintaining mechanical properties. For example, reducing nickel content by 0.147% per heat of steel (13 tons) saved approximately ¥2,866.5 per heat, based on nickel prices. Similarly, reducing molybdenum content by 0.1% saved ¥1,560 per heat. The per-ton savings for steel castings from alloy adjustments are estimated at ¥340, calculated as:
$$ \text{Savings per Ton} = \frac{\text{Total Savings per Heat}}{\text{Tons per Heat}} $$
Third, other material cost reductions for steel castings included switching to a more economical paint brand after testing, saving ¥5-10 per ton, and improving recycling of consumables like core bones and risers, which further reduced direct material costs by 1-2%. These cumulative efforts highlight the importance of material management in producing cost-effective steel castings.
Processing fees, particularly for heat treatment and surface quenching, represent a substantial portion of costs in steel castings production. Initially, these processes were outsourced at high rates, but we transitioned to in-house operations to achieve savings for steel castings.
For quenching and tempering heat treatment of steel castings, we retrofitted existing equipment and invested in a new production line. The total investment was ¥1.2 million, but in-house processing costs dropped to ¥800 per ton of steel castings, compared to ¥1,350 for outsourcing. The savings per ton for steel castings is:
$$ \text{Savings} = 1350 – 800 = 550 \text{ ¥/ton} $$
The payback period for this investment in steel castings production, based on projected output, is less than six months, derived from:
$$ \text{Payback Period (in tons)} = \frac{\text{Investment}}{\text{Savings per Ton}} = \frac{1,200,000}{550} \approx 2182 \text{ tons} $$
For surface quenching of steel castings, we invested ¥400,000 in dedicated equipment. In-house processing costs are ¥600 per ton versus ¥1,500 for outsourcing, yielding savings of:
$$ \text{Savings} = 1500 – 600 = 900 \text{ ¥/ton} $$
The payback period for steel castings surface quenching equipment is under two months, calculated as:
$$ \text{Payback Period} = \frac{400,000}{900} \approx 444 \text{ tons} $$
These investments not only reduce processing fees but also enhance control over quality and scheduling for steel castings, contributing to overall cost efficiency in steel castings manufacturing.
Other production costs for steel castings, such as direct labor and scrap loss, were also optimized. Through mold redesigns and worker training, direct labor costs for steel castings decreased by 20-25% in mass production. The improvement in labor efficiency can be modeled as:
$$ \text{Reduced Labor Cost} = \text{Initial Labor Cost} \times (1 – \text{Efficiency Gain}) $$
Scrap loss in steel castings was reduced from 2-3% to below 1% by preventing core shifts through better mold designs. This reduction in scrap loss for steel castings minimizes rework and material waste, further lowering variable costs. The impact on total cost per ton of steel castings is significant, as scrap loss directly affects material and labor inputs.
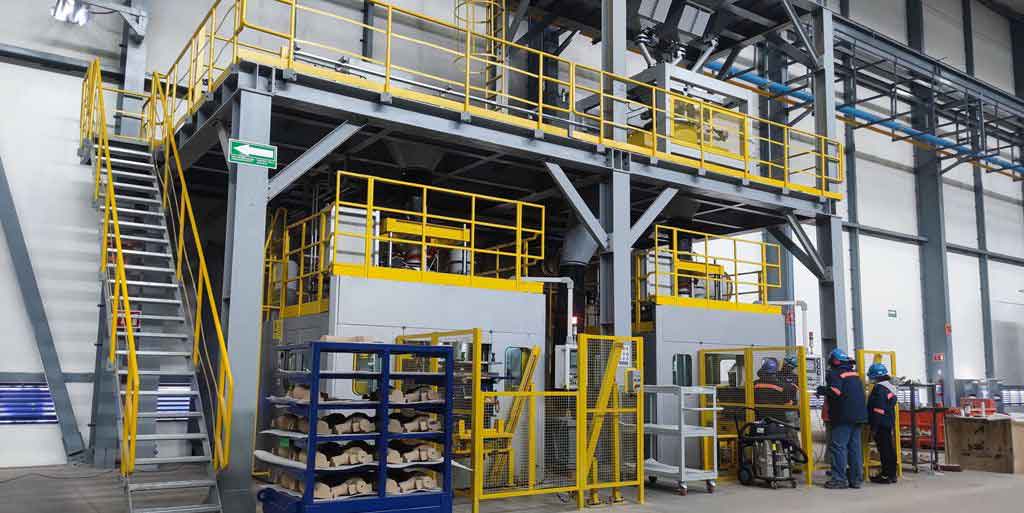
To visualize the equipment involved in such optimizations for steel castings, consider the following image of steel casting machinery, which plays a key role in production processes.
After implementing these cost control measures, the profitability of steel castings improved markedly. In mass production, the contribution margin for steel castings turned positive, with the contribution margin ratio surpassing that of traditional products. The updated contribution margin analysis for steel castings reflects these gains.
| Item | Steel Castings (¥/ton) |
|---|---|
| Price (excluding VAT) | 10,965.87 |
| Direct Materials (optimized) | 4,300.00 |
| Energy (optimized) | 2,000.00 |
| Processing Fees (in-house) | 1,400.00 |
| Direct Labor (optimized) | 1,300.00 |
| Scrap Loss (reduced) | 100.00 |
| Total Variable Cost | 9,100.00 |
| Unit Contribution Margin | 1,865.87 |
| Contribution Margin Ratio | 17.0% |
The unit contribution margin for steel castings is now positive, calculated as:
$$ \text{CM} = 10,965.87 – 9,100.00 = 1,865.87 \text{ ¥/ton} $$
and the contribution margin ratio for steel castings is:
$$ \text{CMR} = \frac{1,865.87}{10,965.87} \approx 0.170 \text{ or } 17.0\% $$
This turnaround demonstrates the effectiveness of cost control strategies in steel castings production, making steel castings a viable and profitable product line. The integration of these measures ensures that steel castings meet market demands while maintaining competitive pricing and quality standards.
In summary, a systematic approach to cost analysis and control is essential for new product development in steel castings. By conducting marginal contribution and cost structure analyses, companies can pinpoint areas for improvement in steel castings manufacturing. Optimizing direct materials through yield enhancements and alloy adjustments, reducing processing fees via in-house investments, and minimizing other costs like labor and scrap loss are key strategies for steel castings. Continuous process refinement allows for adaptation to market dynamics, ultimately lowering production costs and boosting competitiveness. Steel castings, such as those used in track shoes, can thus become significant profit drivers, underscoring the value of proactive cost management in the steel castings industry. Through these efforts, steel castings production not only achieves economic benefits but also strengthens a company’s position in the global marketplace for steel castings.