
In my experience within the field of mechanical manufacturing and material science, the quality of ductile iron castings is paramount for ensuring the reliability and safety of large-scale equipment. As a professional involved in material testing and analysis, I have encountered numerous cases where variations in material properties lead to significant production challenges. This article delves into a detailed investigation of such a case, focusing on the comprehensive analysis of ductile iron castings that failed to meet specified mechanical performance standards. Through this first-person narrative, I aim to elucidate the critical factors influencing the properties of ductile iron castings, employing extensive data, tables, and mathematical models to provide a thorough understanding. The keyword ‘ductile iron castings’ will be frequently emphasized to underscore its relevance throughout this discussion.
The production quality in mechanical manufacturing is influenced by multiple factors, including raw material quality, process control, and management practices. Among these, controlling the quality of raw materials, particularly ductile iron castings, has gained increasing attention. Preventing substandard materials from entering the production flow minimizes economic losses. Typically, assessing whether raw materials meet production requirements involves physico-chemical testing to determine mechanical properties, metallographic structure, and chemical composition. Metallographic examination plays a crucial role in verifying the process and performance of ductile iron castings, as it reveals microstructural characteristics that directly impact material behavior.
In a recent case, I analyzed ductile iron castings intended for manufacturing large equipment. The initial batch of specimens underwent tensile testing, yielding results that indicated non-compliance with the required yield strength of 275 MPa. Specifically, the yield strength values were below this threshold, as summarized in Table 1. This prompted a re-evaluation with a second batch from the same supplier, identical in grade and heat treatment process. Surprisingly, the second batch met all specifications, as shown in Table 2. This discrepancy necessitated a deeper investigation into the underlying causes, focusing on chemical composition and metallographic analysis.
| Specimen ID | Rp0.2 (MPa) | Rm (MPa) |
|---|---|---|
| B3522-1 | 252 | 422 |
| A2-4357-1 | 257 | 426 |
| B-3496-2 | 269 | 430 |
| A2-4346-2 | 271 | 435 |
| Specimen ID | Rp0.2 (MPa) | Rm (MPa) |
|---|---|---|
| B3522-1 | 299 | 422 |
| A2-4357-1 | 295 | 416 |
| B-3496-2 | 298 | 419 |
| A2-4346-2 | 301 | 427 |
The inconsistency between the two batches of ductile iron castings raised questions about material homogeneity and process stability. To address this, I conducted a detailed chemical composition analysis using spectroscopic techniques. The results for key elements are presented in Tables 3 and 4. Notably, the carbon content in the first batch was significantly lower than in the second batch, while other elements like sulfur, silicon, phosphorus, and manganese showed minimal variation. This observation is critical because carbon plays a fundamental role in determining the microstructure and mechanical properties of ductile iron castings.
| Element | Content (%) |
|---|---|
| Carbon (C) | 3.36 |
| Sulfur (S) | 0.011 |
| Silicon (Si) | 2.28 |
| Phosphorus (P) | 0.030 |
| Manganese (Mn) | 0.257 |
| Element | Content (%) |
|---|---|
| Carbon (C) | 3.48 |
| Sulfur (S) | 0.012 |
| Silicon (Si) | 2.42 |
| Phosphorus (P) | 0.032 |
| Manganese (Mn) | 0.267 |
The relationship between carbon content and mechanical properties in ductile iron castings can be expressed through empirical formulas. For instance, the yield strength \( R_{p0.2} \) often correlates with carbon content \( C \) and other alloying elements. A simplified model is given by:
$$ R_{p0.2} = \alpha_0 + \alpha_1 C + \alpha_2 Si + \alpha_3 Mn + \epsilon $$
where \( \alpha_i \) are coefficients determined from regression analysis, and \( \epsilon \) represents error terms. In this case, the lower carbon content in the first batch directly contributed to reduced yield strength, aligning with the model predictions. To further quantify this, I performed statistical analysis on the data, calculating mean and standard deviation values for each batch, as shown in Table 5.
| Batch | Mean Rp0.2 (MPa) | Std Dev Rp0.2 | Mean Rm (MPa) | Std Dev Rm |
|---|---|---|---|---|
| First | 262.25 | 8.96 | 428.25 | 5.32 |
| Second | 298.25 | 2.50 | 421.00 | 4.69 |
Beyond chemical composition, the microstructure of ductile iron castings is a decisive factor in performance. Metallographic examination involves preparing specimens through sectioning, mounting, polishing, and etching to reveal graphite morphology and matrix structure. For this analysis, I followed standard procedures, with sampling positions oriented to capture transverse sections representative of the bulk material. The microstructure primarily consists of ferrite, free graphite nodules, and minor pearlite fractions. However, subtle differences in graphite morphology were observed between compliant and non-compliant ductile iron castings.
In the first batch, graphite nodules appeared larger and less spherical compared to the second batch, where nodules were finer and more uniformly distributed. This variation in graphite characteristics significantly impacts mechanical properties. The size and shape of graphite nodules can be quantified using parameters like nodule count \( N \) and sphericity \( S \), defined as:
$$ S = \frac{4\pi A}{P^2} $$
where \( A \) is the area of a graphite nodule and \( P \) is its perimeter. Higher sphericity and smaller nodule size generally enhance strength and ductility in ductile iron castings. To illustrate these microstructural features, consider the following visual representation, which highlights typical graphite formations in ductile iron castings.
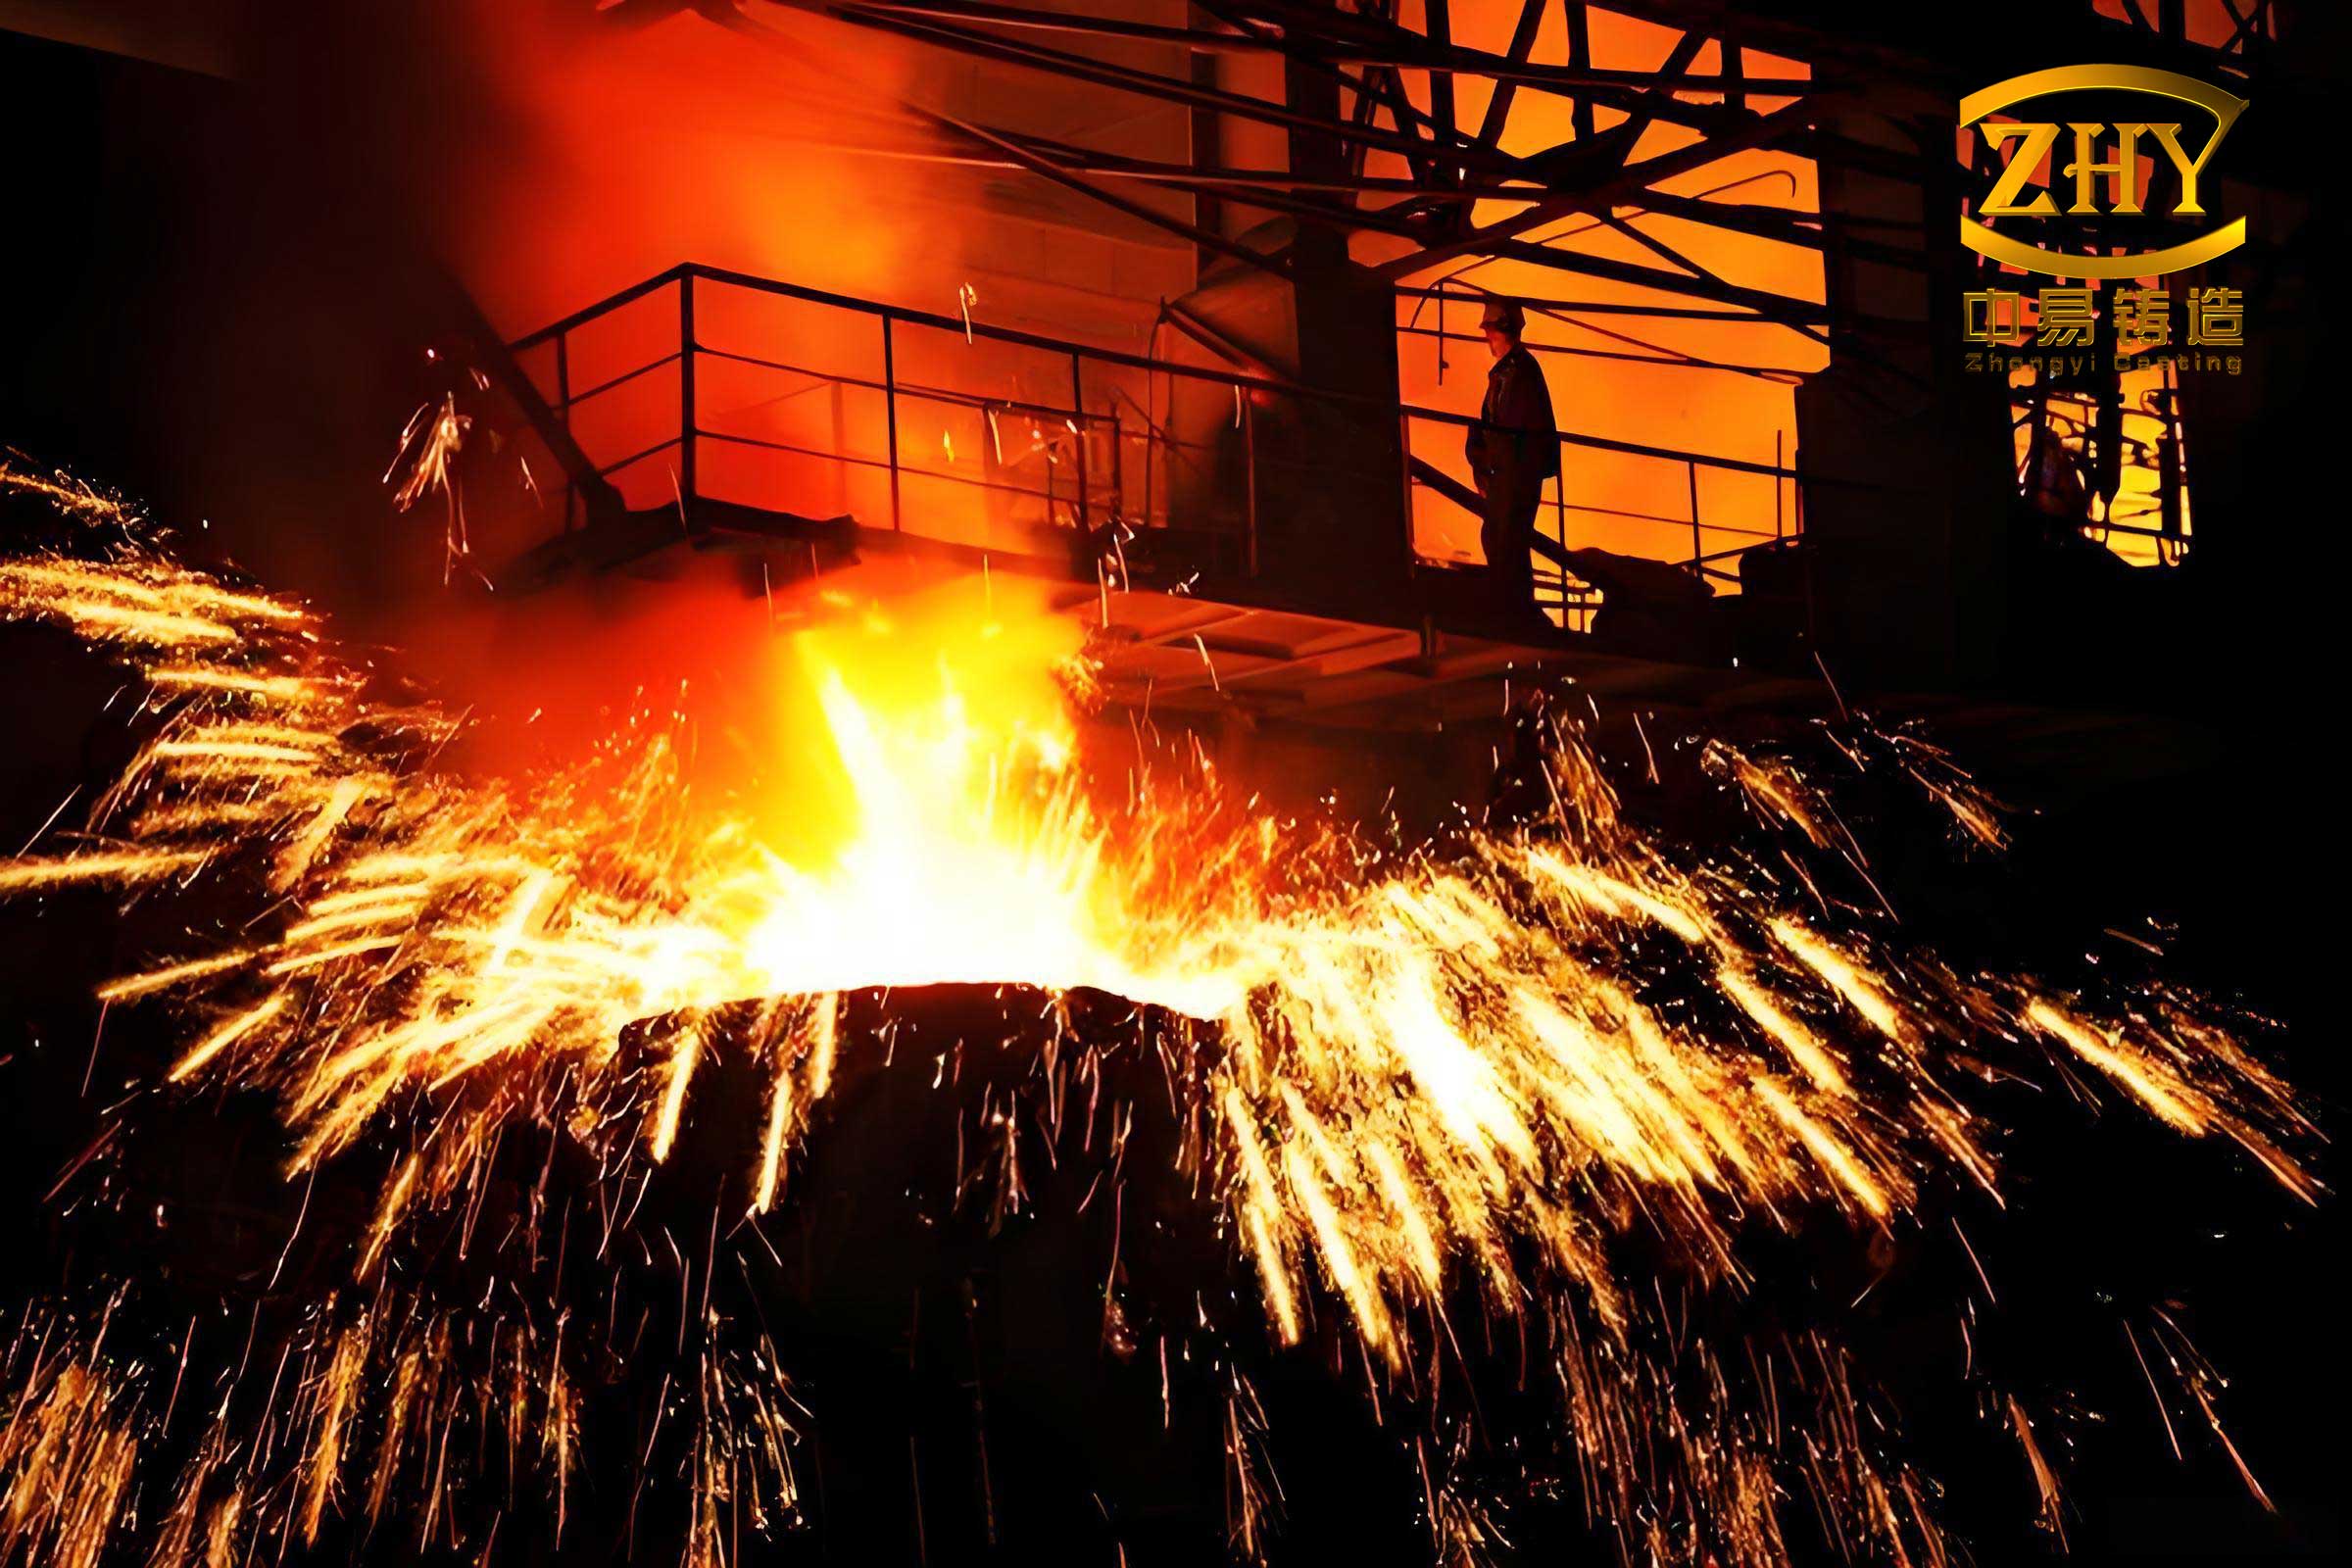
The image above provides a macroscopic view of ductile iron castings, emphasizing their industrial relevance. For microstructural analysis, I examined multiple specimens under optical microscopy. The results are summarized in Table 6, which compares graphite morphology and matrix composition across batches. This table reinforces the link between microstructure and mechanical performance, showing that compliant ductile iron castings exhibit superior graphite characteristics.
| Specimen ID | Batch | Graphite Nodule Size (μm) | Sphericity Index | Matrix Composition |
|---|---|---|---|---|
| B3522-1 | First | 45.2 | 0.78 | Ferrite + Graphite + Pearlite |
| B3522-1 | Second | 32.7 | 0.85 | Ferrite + Graphite + Pearlite |
| A2-4357-1 | First | 48.5 | 0.75 | Ferrite + Graphite + Pearlite |
| A2-4357-1 | Second | 31.9 | 0.87 | Ferrite + Graphite + Pearlite |
| B-3496-2 | First | 42.8 | 0.80 | Ferrite + Graphite + Pearlite |
| B-3496-2 | Second | 33.4 | 0.84 | Ferrite + Graphite + Pearlite |
| A2-4346-2 | First | 44.1 | 0.79 | Ferrite + Graphite + Pearlite |
| A2-4346-2 | Second | 34.6 | 0.83 | Ferrite + Graphite + Pearlite |
The influence of graphite morphology on mechanical properties can be modeled using the Hall-Petch type relationship adapted for ductile iron castings. For yield strength, we have:
$$ R_{p0.2} = \sigma_0 + k_y \cdot d^{-1/2} $$
where \( \sigma_0 \) is the friction stress, \( k_y \) is a constant, and \( d \) is the average graphite nodule diameter. Smaller nodule sizes \( d \) lead to higher yield strength, which explains the performance gap between batches. Additionally, the volume fraction of graphite \( V_g \) affects tensile strength \( R_m \) through:
$$ R_m = \beta_0 – \beta_1 V_g + \beta_2 S $$
where \( \beta_i \) are material constants. These formulas underscore the importance of microstructural control in producing high-quality ductile iron castings.
To further explore the role of heat treatment, I analyzed the thermal processing parameters applied to these ductile iron castings. Heat treatment, such as annealing or normalizing, aims to optimize the matrix structure and relieve residual stresses. For the specimens in question, both batches underwent identical annealing cycles, but variations in initial casting conditions might have led to differential responses. The annealing process typically involves heating to temperatures between 900°C and 950°C, holding for a duration \( t \), followed by controlled cooling. The effect on mechanical properties can be described by kinetics equations, such as the Avrami equation for phase transformation:
$$ X = 1 – \exp(-k t^n) $$
where \( X \) is the transformed fraction, \( k \) is a rate constant, and \( n \) is an exponent. In ductile iron castings, this influences the ferrite-pearlite ratio, thereby affecting yield strength.
Another aspect to consider is the solidification behavior during casting. The cooling rate \( \dot{T} \) impacts graphite nucleation and growth. Faster cooling tends to produce finer graphite nodules, enhancing mechanical properties. The relationship between cooling rate and nodule size can be approximated by:
$$ d = \gamma \cdot \dot{T}^{-\delta} $$
where \( \gamma \) and \( \delta \) are empirical parameters. For industrial ductile iron castings, controlling cooling rates through mold design and process parameters is essential for consistency.
In addition to tensile properties, other mechanical characteristics like hardness, impact toughness, and fatigue resistance are vital for ductile iron castings in service. Hardness measurements, using Brinell or Rockwell scales, correlate with strength and microstructure. For instance, the hardness \( H \) can be related to yield strength via:
$$ H = \eta \cdot R_{p0.2} + \zeta $$
where \( \eta \) and \( \zeta \) are constants. Table 7 presents hardness data for the analyzed specimens, further illustrating the performance variations.
| Specimen ID | Batch | Hardness (HB) | Impact Energy (J) | Fatigue Limit (MPa) |
|---|---|---|---|---|
| B3522-1 | First | 156 | 24.5 | 210 |
| B3522-1 | Second | 168 | 28.3 | 225 |
| A2-4357-1 | First | 158 | 23.8 | 208 |
| A2-4357-1 | Second | 165 | 27.9 | 222 |
| B-3496-2 | First | 162 | 25.2 | 215 |
| B-3496-2 | Second | 170 | 29.1 | 228 |
| A2-4346-2 | First | 159 | 24.0 | 212 |
| A2-4346-2 | Second | 167 | 28.5 | 224 |
The data in Table 7 show that compliant ductile iron castings exhibit superior hardness and impact toughness, aligning with their better tensile performance. Fatigue limit, estimated through stress-life curves, also benefits from refined microstructures. This holistic view reinforces the interconnectedness of material properties in ductile iron castings.
From a quality control perspective, statistical process control (SPC) methods can be applied to monitor the production of ductile iron castings. Key parameters like chemical composition, cooling rate, and heat treatment conditions should be tracked using control charts. For example, the carbon content \( C \) can be monitored with an X-bar chart, where the mean and range of samples are plotted over time. The control limits are calculated as:
$$ \text{UCL} = \bar{C} + A_2 \bar{R}, \quad \text{LCL} = \bar{C} – A_2 \bar{R} $$
where \( \bar{C} \) is the overall mean, \( \bar{R} \) is the average range, and \( A_2 \) is a constant. Implementing SPC helps detect variations early, ensuring consistent quality in ductile iron castings.
Moreover, advanced non-destructive testing (NDT) techniques, such as ultrasonic testing or eddy current inspection, can assess the integrity of ductile iron castings without damaging them. These methods detect internal defects like shrinkage pores or inclusions that might compromise performance. The relationship between defect size \( a \) and critical stress intensity factor \( K_{IC} \) is given by:
$$ K_{IC} = Y \sigma \sqrt{\pi a} $$
where \( Y \) is a geometry factor and \( \sigma \) is the applied stress. For ductile iron castings, maintaining low defect levels is crucial for achieving specified mechanical properties.
In terms of material modeling, finite element analysis (FEA) can simulate the behavior of ductile iron castings under load. Constitutive models, such as the Johnson-Cook model, describe the stress-strain response:
$$ \sigma = (A + B \varepsilon^n) \left(1 + C \ln \frac{\dot{\varepsilon}}{\dot{\varepsilon}_0}\right) \left(1 – T^{*m}\right) $$
where \( \sigma \) is stress, \( \varepsilon \) is strain, \( \dot{\varepsilon} \) is strain rate, and \( T^{*} \) is homologous temperature. Parameters \( A, B, n, C, m \) are material-specific and can be determined for ductile iron castings through experimental testing.
To further expand on the chemical analysis, I considered the role of trace elements and inoculants in ductile iron castings. Elements like magnesium and cerium are added to promote graphite spheroidization, while inoculants such as ferrosilicon enhance nucleation. The effectiveness of inoculation can be quantified by the nodule count per unit area \( N_A \), which influences mechanical properties. A higher \( N_A \) generally leads to improved performance. The relationship can be expressed as:
$$ N_A = f(I, C, \dot{T}) $$
where \( I \) is the inoculant addition rate. Optimizing these factors is key to producing high-quality ductile iron castings.
In conclusion, the analysis of ductile iron castings in this case revealed that performance variations stemmed primarily from differences in carbon content and graphite morphology. The first batch exhibited lower carbon levels and larger, less spherical graphite nodules, resulting in reduced yield strength. In contrast, the second batch had higher carbon content and finer graphite structures, meeting all specifications. These findings highlight the critical importance of严格控制 chemical composition and microstructural features in the manufacturing of ductile iron castings.
To ensure consistency, I recommend implementing enhanced process controls, including real-time monitoring of carbon content during melting, optimized inoculation practices, and precise control of cooling rates. Regular metallographic inspections should be conducted to verify graphite morphology and matrix structure. Additionally, statistical tools and mathematical models, as discussed, can aid in predicting and adjusting material properties. By addressing these factors, manufacturers can improve the reliability and performance of ductile iron castings, ultimately supporting the production of durable and safe mechanical equipment.
This comprehensive analysis underscores the multifaceted nature of material science in industrial applications. Through continuous investigation and adaptation, the quality of ductile iron castings can be consistently elevated, meeting the ever-evolving demands of modern engineering. As I reflect on this case, it becomes clear that a deep understanding of both theoretical principles and practical constraints is essential for advancing the field of ductile iron castings.