
The rapid development of the automotive industry has placed a significant burden on resources and the environment. Achieving carbon neutrality has become a long-term strategic goal for China and the world in addressing global climate change, making the reduction of carbon emissions an urgent and critical challenge. Vehicle lightweighting technology stands as one of the most crucial pathways for energy saving and emission reduction in internal combustion engine vehicles, as well as for lowering energy consumption and extending the range of new energy vehicles. Aluminum alloys, with their advantageous properties such as low density, excellent corrosion resistance, and good thermal conductivity, represent an ideal material for lightweighting and have seen extensive application in automotive lightweight technologies in recent years.
Automotive component shell castings, particularly those for critical assemblies like reduction gear housings, are essential load-bearing parts within power transmission systems. Traditionally, such housings were often manufactured from ductile iron using gravity casting processes, resulting in relatively high weight and a susceptibility to casting defects. Consequently, the shift towards A356 aluminum alloy for these components offers a substantial opportunity for weight reduction. Low-pressure die casting (LPDC) is one of the primary forming methods for aluminum alloys. It effectively resolves the inherent contradiction in traditional gravity casting between achieving smooth mold filling and ensuring adequate solidification feeding. This capability makes LPDC highly suitable for producing high-integrity shell castings with dense microstructure and superior mechanical properties.
This study focuses on the process optimization for an aluminum alloy worm gear reduction housing shell casting. We employ numerical simulation software to analyze the initial low-pressure die casting process, predict potential shrinkage porosity defects, and investigate their root causes. Building upon this analysis, we implement a targeted cooling strategy. Furthermore, a multi-objective optimization of key process parameters is conducted using the design of experiments (DOE) methodology, specifically orthogonal arrays, to simultaneously enhance the quality and production efficiency of the shell castings.
Initial Process Design and Numerical Simulation Analysis
Geometric Model and Simulation Setup
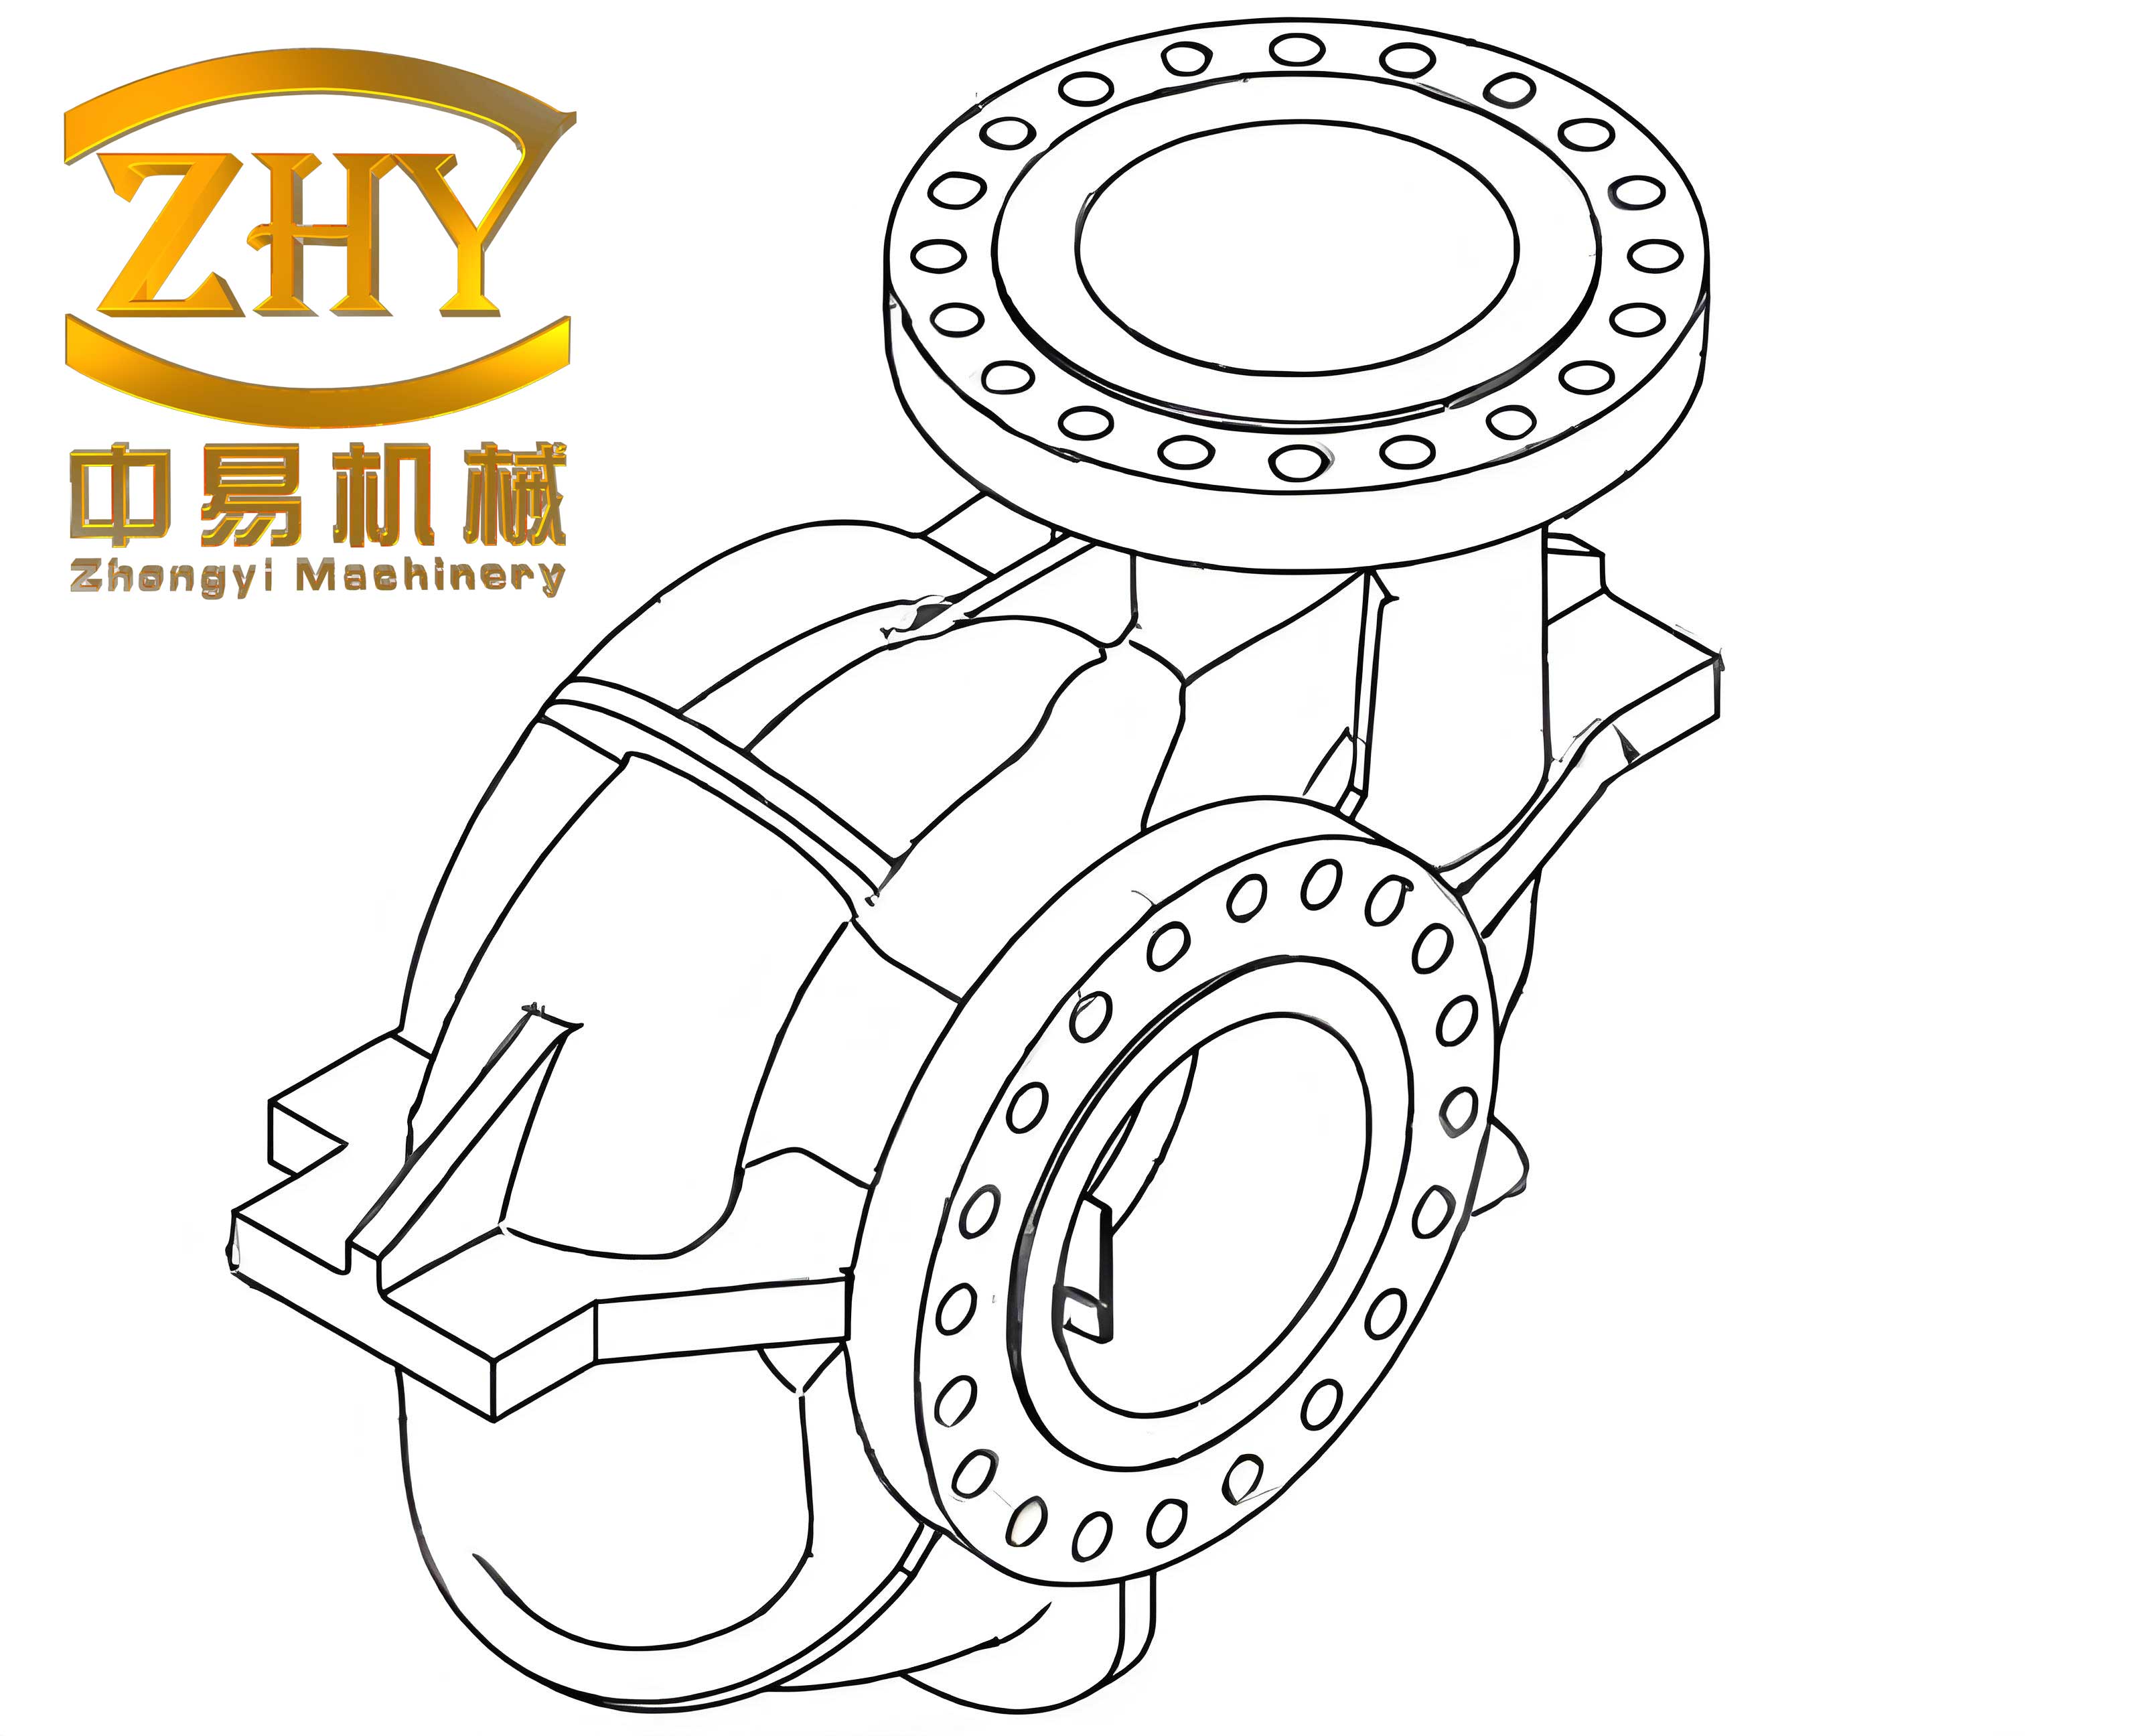
The three-dimensional model of the reduction gear housing and its gating system is illustrated in the figure above. The housing has a volume of approximately 0.004 m³, a mass of 10.579 kg, and overall dimensions of 340 mm × 301 mm × 238 mm. Its geometry is complex, featuring uneven wall thickness with significant variations and several thick sections, which presents considerable challenges for defect-free casting. To promote directional solidification and establish effective feeding channels, a bottom-gated, pressurized gating system was designed. The gating system model was created using CAD software and imported into MAGMAsoft for meshing and simulation.
The casting material is A356 aluminum alloy. Its chemical composition and key thermophysical parameters are summarized in Tables 1 and 2, respectively. The mold material is H13 steel. The LPDC process cycle typically consists of several stages: counter-gravity filling (riser tube filling), mold filling, pressure intensification, pressure holding during solidification, and pressure release. Based on Pascal’s principle and empirical formulas, the process parameters were set as shown in Table 3. The interfacial heat transfer coefficients (HTC) were defined as follows: 2000 W/(m²·K) between the metal and the mold, 3500 W/(m²·K) between mold components, and 20 W/(m²·K) between the mold and the ambient air.
| Si | Mg | Fe | Ti | Sr | Cr+Cu+Mn+Ni+Sn+Zn | Al |
|---|---|---|---|---|---|---|
| 6.6 | 0.36 | 0.09 | 0.19 | <0.005 | <0.01 | Bal. |
| Density (kg/m³) | Liquidus Temp. (°C) | Solidus Temp. (°C) | Latent Heat (kJ/kg) | Thermal Conductivity (W/m·K) |
|---|---|---|---|---|
| 2430 | 613 | 542 | 430.5 | 70 |
| Process Stage | Pressure (kPa) | Time (s) | Remarks |
|---|---|---|---|
| Filling of Riser Tube | 0 → 15 | 3 | Linear ramp |
| Mold Filling | 15 → 25 | 12 | Linear ramp to max pressure |
| Pressure Holding | 80 | 300 | Constant pressure during solidification |
| Initial Pouring Temperature: 720°C; Initial Mold Temperature: 280°C | |||
Analysis of Initial Simulation Results
The temperature field at the end of solidification for the initial process showed a general trend toward directional solidification. However, localized issues were apparent. The top region of the housing, characterized by thin walls and a large surface area for heat dissipation, solidified rapidly. Meanwhile, the junction between this top section and adjacent thick reinforcing ribs remained liquid for a longer time, effectively cutting off the sequential solidification path and creating isolated liquid pools.
Analysis of the solid fraction evolution during solidification clearly revealed the formation of these isolated liquid regions at specific time intervals (e.g., at 98.65 s and 120.97 s). When an isolated liquid region solidifies, the associated volumetric shrinkage cannot be compensated by feeding from surrounding liquid metal, even under the applied pressure. This inevitably leads to the formation of shrinkage porosity defects within the final shell castings. The Niyama criterion, a widely used indicator for predicting shrinkage porosity, can be expressed as:
$$ G / \sqrt{R} \leq C $$
where \( G \) is the temperature gradient (°C/m), \( R \) is the cooling rate (°C/s), and \( C \) is a critical constant specific to the alloy. Locations where this value falls below the critical threshold are prone to microporosity. The simulation results indicated several areas in the initial design where this criterion was violated, confirming the risk of defects.
Process Optimization Strategy
Cooling System Design and Optimization
To address the issue of isolated liquid pools and improve the solidification gradient, a conformal cooling channel system was designed and integrated into the mold. The primary objective was to accelerate the cooling of specific thick sections that were acting as thermal centers, thereby re-establishing a more favorable directional solidification sequence from the extremities of the shell castings towards the feeding source (the sprue).
The initial cooling layout consisted of multiple channels with diameters tailored to the thermal mass of the region they were intended to cool. The operation parameters—coolant flow rate, channel activation time, and deactivation time—were iteratively adjusted based on simulation feedback to achieve the optimal thermal management. Water was used as the coolant. The governing equation for heat extraction by a cooling channel can be simplified as:
$$ Q = h \cdot A \cdot (T_{\text{mold}} – T_{\text{coolant}}) $$
$$ \text{where: } Q \text{ is heat transfer rate (W), } h \text{ is HTC (W/m²·K), } A \text{ is channel surface area (m²)} $$
The initial cooling scheme parameters are listed in Table 4. This active cooling approach was crucial for modifying the thermal history of the problematic zones in the shell castings.
| Channel Group | Diameter (mm) | Coolant | Flow Rate (m³/h) | Start Time (s) | Stop Time (s) |
|---|---|---|---|---|---|
| 1 | 12 | Water | 1.5 | 20 | 100 |
| 2, 3 | 16 | Water | 1.5 | 11 | 100 |
| 4, 5 | 16 | Water | 1.5 | 7 | 90 |
| 6-8 | 16 | Water | 3.0 | 4 | 80 |
| 9 | 12 | Water | 3.0 | 4 | 80 |
| 10 | 16 | Water | 2.0 | 170 | 220 |
Multi-Objective Optimization Using Orthogonal Experimental Design
With the improved cooling layout in place, a systematic optimization of the key process parameters was undertaken. We selected three critical factors: Pouring Temperature (A), Mold Preheating Temperature (B), and Coolant Inlet Temperature (C). Each factor was studied at four levels within practical operating ranges, as detailed in Table 5. An L₁₆(4³) orthogonal array was employed to design the simulation experiments, requiring only 16 runs to evaluate the effects of all factors and their levels efficiently.
| Level | A: Pouring Temp. (°C) | B: Mold Temp. (°C) | C: Coolant Temp. (°C) |
|---|---|---|---|
| 1 | 680 | 240 | 20 |
| 2 | 700 | 260 | 25 |
| 3 | 720 | 280 | 30 |
| 4 | 740 | 300 | 35 |
The quality of the shell castings was evaluated using three response criteria:
- Shrinkage Porosity Criterion Value: The maximum Niyama criterion value in the casting. A value > 1 indicates a high risk of shrinkage defects. The objective is to minimize this value below the critical threshold.
- Secondary Dendrite Arm Spacing (SDAS, λ₂): A key microstructural feature inversely related to local solidification time and cooling rate. Finer dendrites (lower SDAS) generally correlate with improved mechanical properties. SDAS can be empirically related to the local solidification time \( t_f \) by:
- Total Solidification Time: The time required for the entire casting to completely solidify. Minimizing this time enhances production efficiency.
$$ \lambda_2 = k \cdot (t_f)^n $$
where \( k \) and \( n \) are material constants. The objective is to minimize the average SDAS.
The experimental layout according to the L₁₆ orthogonal array and the corresponding simulation results for each response are presented in Table 6.
| Run No. | A | B | C | Shrinkage Criterion | Avg. SDAS (µm) | Solidification Time (s) |
|---|---|---|---|---|---|---|
| 1 | 1 | 1 | 1 | 6.00 | 46.18 | 193.80 |
| 2 | 1 | 2 | 2 | 4.39 | 46.57 | 197.83 |
| 3 | 1 | 3 | 3 | 8.15 | 47.00 | 202.68 |
| 4 | 1 | 4 | 4 | 6.21 | 48.21 | 217.70 |
| 5 | 2 | 1 | 2 | 8.47 | 46.41 | 197.09 |
| 6 | 2 | 2 | 3 | 7.20 | 46.79 | 201.33 |
| 7 | 2 | 3 | 4 | 5.99 | 47.39 | 212.06 |
| 8 | 2 | 4 | 1 | 5.93 | 48.65 | 228.34 |
| 9 | 3 | 1 | 3 | 11.09 | 46.55 | 200.62 |
| 10 | 3 | 2 | 4 | 3.64 | 46.98 | 204.98 |
| 11 | 3 | 3 | 1 | 4.34 | 48.14 | 219.37 |
| 12 | 3 | 4 | 2 | 23.48 | 48.98 | 230.05 |
| 13 | 4 | 1 | 4 | 0.98 | 46.87 | 206.35 |
| 14 | 4 | 2 | 1 | 2.68 | 47.60 | 215.11 |
| 15 | 4 | 3 | 2 | 2.62 | 48.72 | 229.53 |
| 16 | 4 | 4 | 3 | 3.69 | 49.89 | 236.07 |
Analysis of Orthogonal Experiment Results
The mean response for each factor at each level was calculated, and the range (difference between max and min mean) was determined to assess the relative influence of each factor on the responses. The analysis is summarized in Table 7.
| Response / Factor | Mean Value at Level | Range | Optimal Level (for Min. Response) |
|||
|---|---|---|---|---|---|---|
| 1 | 2 | 3 | 4 | |||
| Shrinkage Criterion | ||||||
| Factor A | 6.19 | 6.90 | 10.64 | 2.49 | 8.15 | A₄ |
| Factor B | 6.64 | 4.48 | 5.28 | 9.83 | 5.35 | B₂ |
| Factor C | 5.31 | 9.74 | 6.96 | 4.21 | 5.53 | C₄ |
| Avg. SDAS (µm) | ||||||
| Factor A | 46.99 | 47.31 | 47.66 | 48.27 | 1.28 | A₁ |
| Factor B | 46.50 | 46.99 | 47.81 | 48.93 | 2.43 | B₁ |
| Factor C | 47.75 | 47.67 | 47.45 | 47.36 | 0.39 | C₄ |
| Solidification Time (s) | ||||||
| Factor A | 203.00 | 209.71 | 213.76 | 221.77 | 18.77 | A₁ |
| Factor B | 199.47 | 204.81 | 215.91 | 228.04 | 28.57 | B₁ |
| Factor C | 212.65 | 213.63 | 211.69 | 210.27 | 3.36 | C₄ |
Key Findings from the Analysis:
- Shrinkage Porosity: Pouring Temperature (A) has the most significant influence (largest range). The optimal combination for minimizing shrinkage risk is A₄B₂C₄. Notably, a higher pouring temperature (A₄=740°C) was beneficial, likely because it delayed solidification in thin sections, maintaining feeding paths longer.
- Microstructure (SDAS): Mold Preheating Temperature (B) is the dominant factor. Lower mold temperatures (B₁=240°C) result in faster cooling rates and finer dendrites, as predicted by the SDAS relationship with solidification time.
- Productivity (Solidification Time): Mold Preheating Temperature (B) again has the greatest impact. Lower mold temperatures drastically reduce the total cycle time. The optimal levels are A₁B₁C₄ for the shortest solidification time.
Determination of the Final Optimal Process
The primary requirement for the shell castings is the absence of shrinkage defects. Therefore, the parameter set that minimizes the shrinkage criterion below 1.0 must be selected first. From the analysis, combination A₄B₂C₄ yields a very low predicted shrinkage value. However, this combination does not optimize for SDAS or solidification time.
Considering that Mold Temperature (B) has a minor effect on shrinkage but a major effect on both SDAS and solidification time, we can adjust it to its optimal level for those responses (B₁) while maintaining the optimal levels for A and C from the shrinkage perspective. This gives a candidate set: A₄B₁C₄. Furthermore, lower coolant temperature (C₁) slightly improves solidification time without severely impacting shrinkage, based on the trend. Evaluating these candidate sets via additional confirmation simulations led to the selection of the final optimal parameters, which provide the best balance: A₄ (740°C), B₁ (240°C), C₁ (20°C).
The performance of the optimal process is summarized and compared against a baseline in Table 8. The optimized process successfully eliminates shrinkage porosity risk (criterion < 1), achieves a fine dendritic microstructure, and maintains a competitive solidification time. Thermal analysis at critical locations confirmed that the modified thermal profile now supports a clear directional solidification pattern, eliminating the previously observed isolated liquid pools in the shell castings.
| Process Configuration | Shrinkage Criterion (Max) | Avg. SDAS (µm) | Total Solidification Time (s) | Shrinkage Defect Prediction |
|---|---|---|---|---|
| Initial Process (720°C, 280°C, No Cool.) | > 1.0 (Multiple zones) | ~48.5* | > 300 | Yes, Significant |
| Optimized Process (740°C, 240°C, 20°C Coolant) | 0.95 | 46.83 | 205.76 | No |
| *Estimated from similar runs in the orthogonal array. | ||||
Experimental Validation and Microstructural Analysis
To validate the simulation-based optimization, production trials of the aluminum alloy reduction gear housing shell castings were conducted using the determined optimal process parameters. The as-cast components were visually inspected and subjected to non-destructive testing, confirming the absence of gross shrinkage cavities or porosity, which aligned perfectly with the simulation predictions.
Metallographic samples were extracted from three representative locations on the housing: a thick section (A), a thin wall section (B), and a junction area that was previously prone to defects (C). The samples were prepared using standard grinding, polishing, and etching techniques (with 5% HF solution). Microscopic examination revealed a uniform and refined microstructure throughout the shell castings. The secondary dendrite arms were well-defined and closely spaced, consistent with the predicted low SDAS values. Most importantly, no microshrinkage or gas porosity was observed in the critical junction areas, confirming the effectiveness of the optimized cooling and process parameters in producing sound, high-integrity shell castings.
Conclusion
This study demonstrates a comprehensive methodology for optimizing the low-pressure die casting process of complex, thin-walled aluminum alloy shell castings. Through the integration of numerical simulation, targeted cooling system design, and multi-objective optimization via orthogonal experiments, the following key outcomes were achieved:
- The initial process analysis successfully identified the root cause of shrinkage porosity in the shell castings: the formation of isolated liquid pools due to unfavorable thermal gradients.
- The implementation of a conformal cooling system was effective in modifying the solidification sequence, promoting directional solidification towards the feeder.
- The orthogonal experiment provided a systematic and efficient approach to evaluate the interacting effects of pouring temperature, mold temperature, and coolant temperature on multiple casting quality criteria: shrinkage propensity, microstructure fineness (SDAS), and production cycle time.
- The optimal process parameters were determined to be: Pouring Temperature = 740°C, Mold Preheating Temperature = 240°C, and Coolant Inlet Temperature = 20°C.
- The optimized process completely eliminated shrinkage porosity defects, refined the dendritic microstructure, and maintained an efficient solidification time. This was conclusively validated through actual production trials and metallographic analysis of the final shell castings.
This work underscores the significant benefits of combining simulation-driven design with statistical experimentation for solving complex manufacturing challenges. The methodology is directly applicable to the development and optimization of high-quality, lightweight aluminum shell castings for the automotive and other advanced industries.