
In my experience as an engineer specializing in die-casting processes, I have witnessed the automotive industry’s relentless push toward lightweighting, driven by the need for improved fuel efficiency and reduced emissions. The adoption of aluminum alloys has been pivotal, particularly for complex components like shell castings used in electric vehicle motors. These shell castings must meet stringent mechanical and dimensional requirements while being produced rapidly to keep pace with development cycles. Aluminum alloys, such as ADC12, offer an ideal balance of low density, high strength comparable to gray cast iron, superior toughness, and excellent castability, enabling the formation of intricate thin-walled parts. This makes them perfect for demanding applications like motor housings, which operate in harsh environments and require high thermal dissipation. However, producing defect-free shell castings remains challenging due to issues like porosity, shrinkage, and layering defects. In this article, I will share my insights on leveraging numerical simulation and process optimization to enhance the quality of aluminum alloy shell castings, drawing from a case study on a new energy vehicle motor housing.
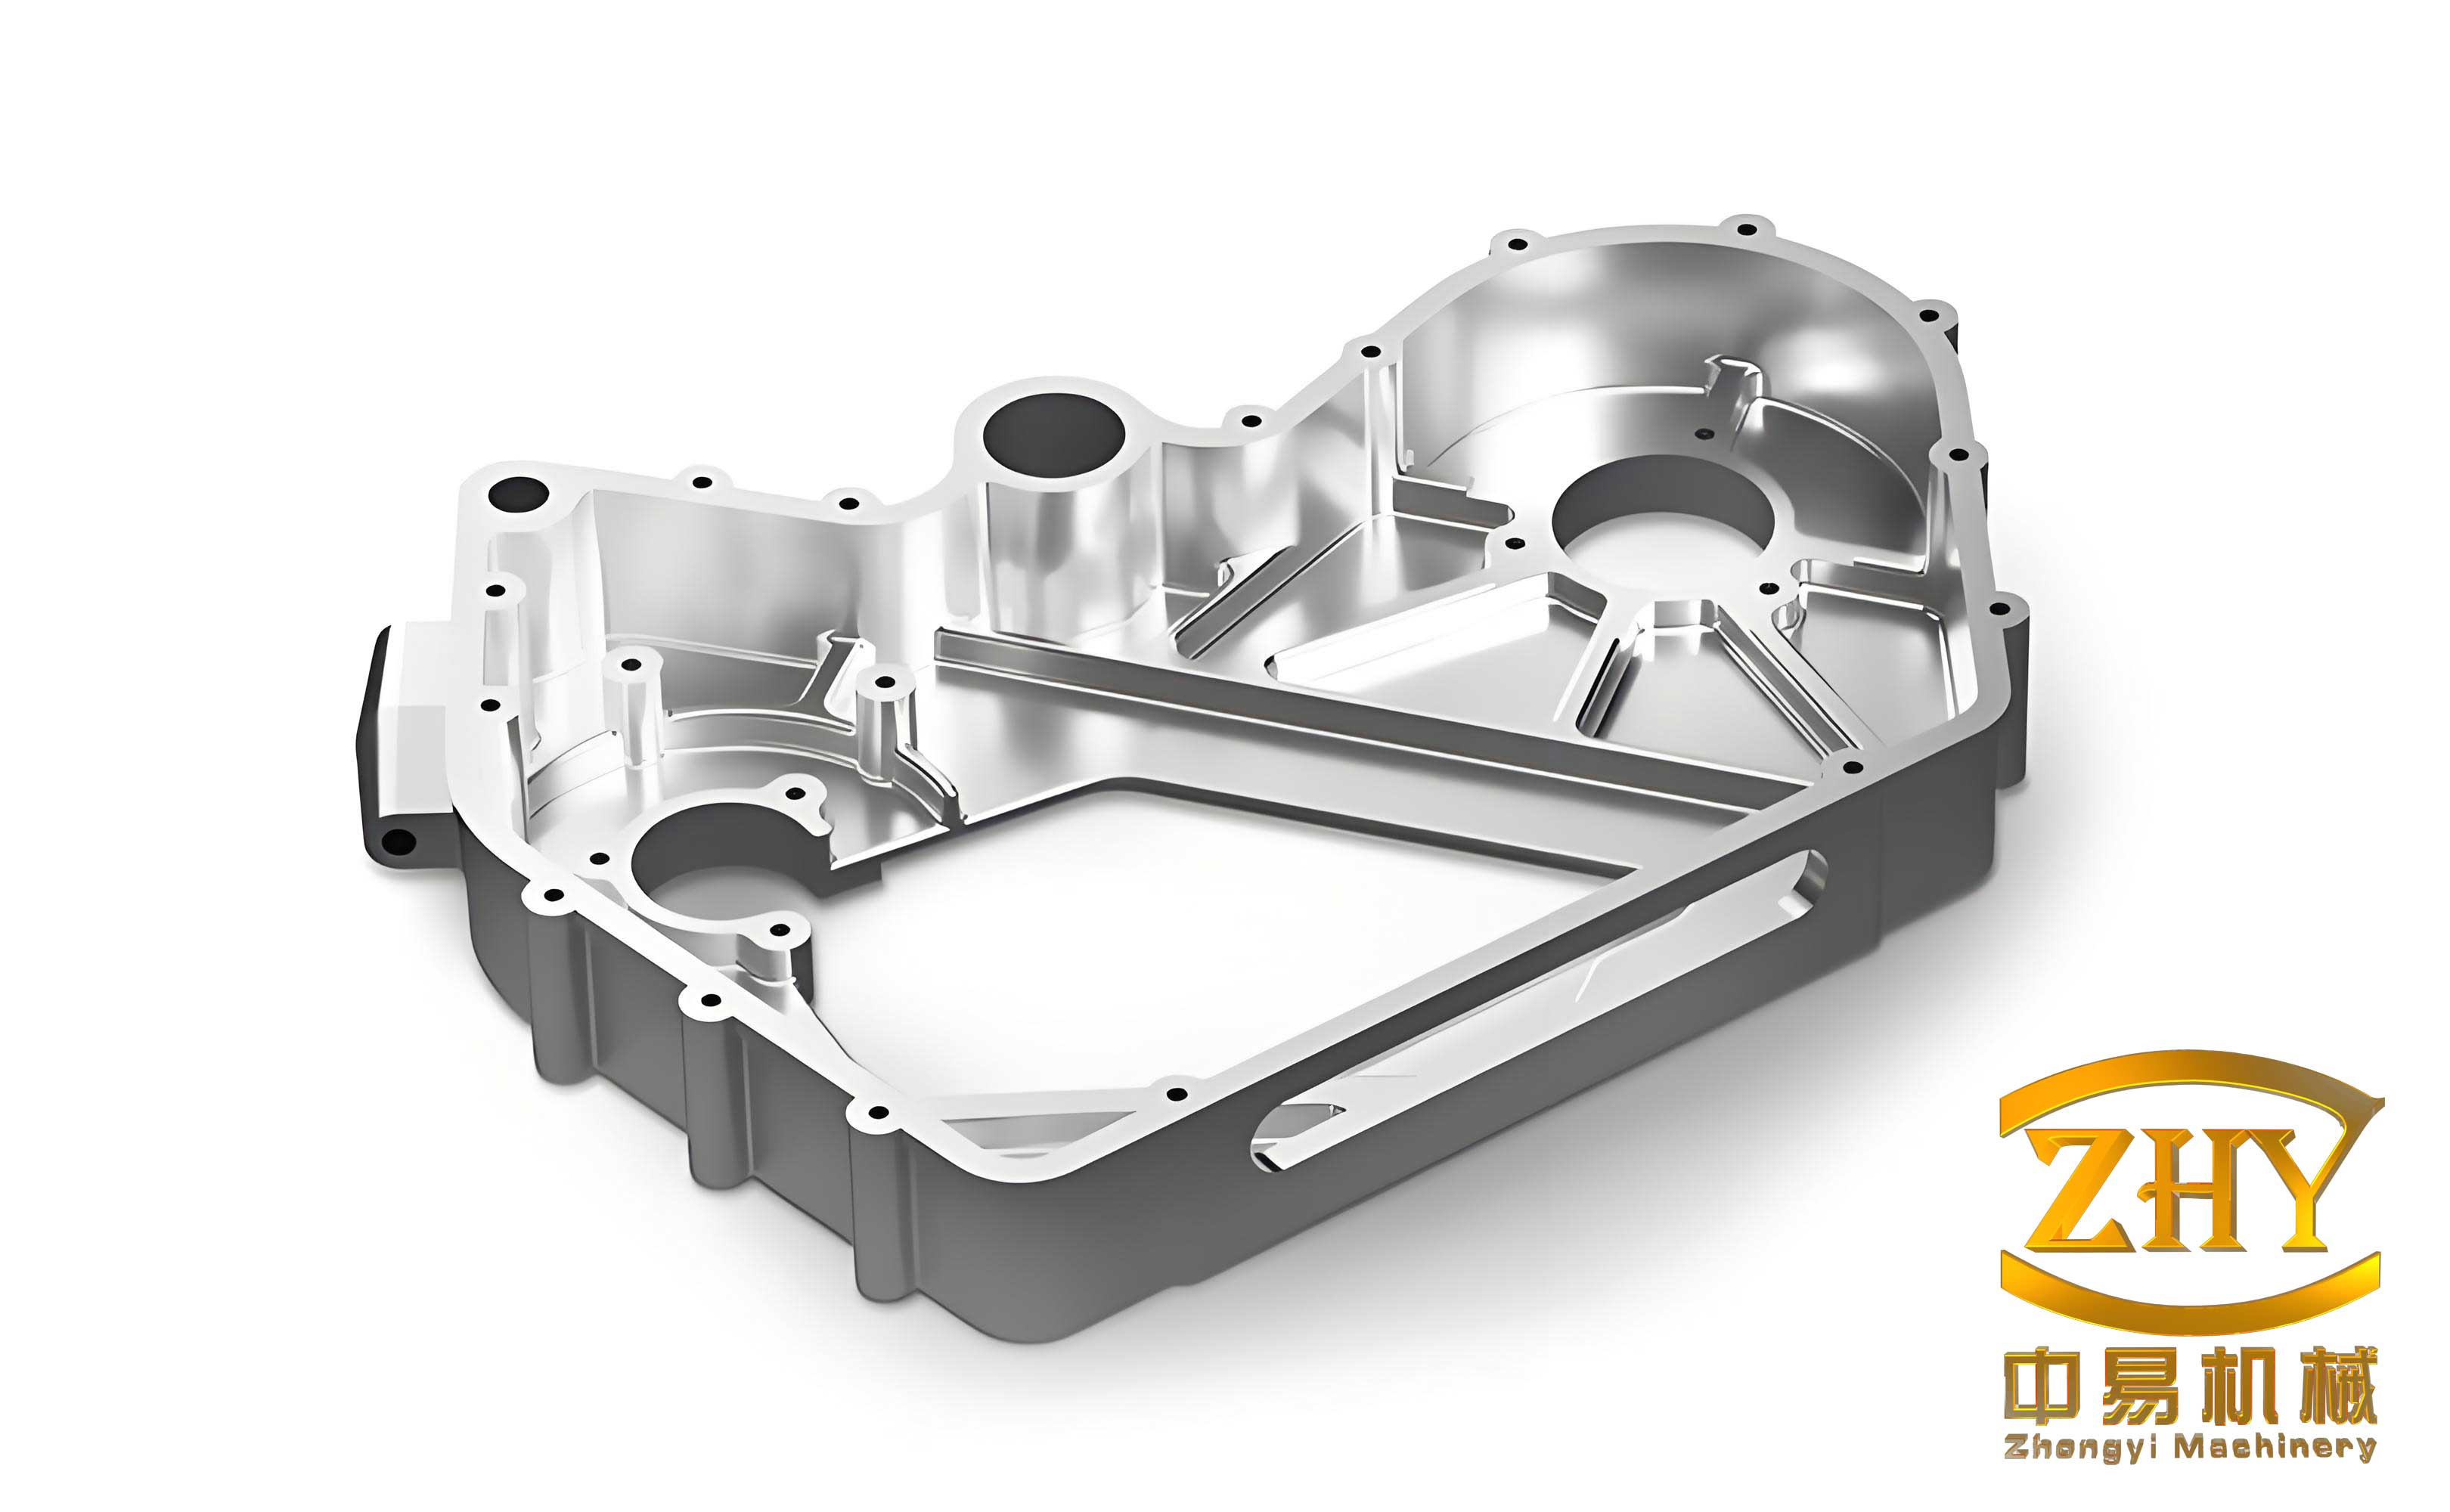
The development of shell castings begins with a thorough understanding of the component’s structure and technical requirements. For instance, the motor housing in my project had an outline dimension of 459 mm × 275 mm × 281 mm, with an average wall thickness of 4 mm and a weight of 8.675 kg. Its complex geometry included multiple thick-section hotspots prone to shrinkage porosity. Key challenges included achieving surface integrity free from flash and defects, maintaining tight dimensional tolerances (especially flatness and positional accuracy of locating holes), and ensuring internal soundness in critical areas like bearing bores to meet mechanical strength and leak-tightness specifications (test pressure of 200 kPa with leakage <5 mL/min). To address these, I employed numerical simulation using MAGMA software early in the design phase to predict and mitigate potential defects, thereby shortening the development timeline. This approach is crucial for shell castings, where traditional trial-and-error methods are time-consuming and costly.
Numerical simulation allows for a virtual analysis of the die-casting process, including mold filling, solidification, and defect formation. I focused on the filling phase, as it directly impacts gas entrapment and cold shut issues. The governing equations for fluid flow and heat transfer are fundamental to these simulations. For incompressible flow of molten aluminum, the continuity and Navier-Stokes equations describe the motion:
Continuity equation: $$\frac{\partial \rho}{\partial t} + \nabla \cdot (\rho \mathbf{v}) = 0$$
Navier-Stokes equation: $$\rho \left( \frac{\partial \mathbf{v}}{\partial t} + \mathbf{v} \cdot \nabla \mathbf{v} \right) = -\nabla p + \mu \nabla^2 \mathbf{v} + \mathbf{f}$$
where $\rho$ is density, $\mathbf{v}$ is velocity vector, $t$ is time, $p$ is pressure, $\mu$ is dynamic viscosity, and $\mathbf{f}$ represents body forces. Heat transfer during solidification is modeled using the energy equation:
$$\rho c_p \frac{\partial T}{\partial t} = \nabla \cdot (k \nabla T) + L \frac{\partial f_s}{\partial t}$$
Here, $c_p$ is specific heat, $T$ is temperature, $k$ is thermal conductivity, $L$ is latent heat of fusion, and $f_s$ is solid fraction. By solving these equations numerically, I simulated three different gating system designs for the shell castings, as summarized in Table 1. The goal was to optimize aluminum flow to minimize turbulence and temperature gradients.
| Design Scheme | Gating Configuration | Key Simulated Parameters | Predicted Defect Risks |
|---|---|---|---|
| Scheme 1: Two-side gating | Aluminum enters from both left and right sides of the motor shell | Filling time: 2.61 s, Cavity fill rate: 68% | Gas entrapment in large circular areas (critical zones) |
| Scheme 2: Left-side gating | Aluminum enters only from the left side | Filling time: 2.61 s, Cavity fill rate: 68% | Gas pores at distant filling ends; moderate temperature distribution |
| Scheme 3: Right-side gating | Aluminum enters only from the right side | Filling time: 2.61 s, Cavity fill rate: 68% | Severe temperature imbalance (580–630°C range); gas pockets at ends |
Based on the simulation results, I selected Scheme 2 for implementation because it showed fewer critical defects compared to Scheme 1 (which had gas entrapment in key areas) and more uniform temperature distribution than Scheme 3. However, the simulation highlighted potential issues at the filling extremities, where cold material accumulation and gas porosity were likely. This insight guided subsequent mold design adjustments. For shell castings, such proactive simulation is invaluable to avoid costly rework.
During trial production, two major defects emerged in the shell castings: gas porosity at the filling end (often called “water tail” porosity) and internal layering in the large circular section. I conducted a root-cause analysis for each, combining simulation data with physical inspections. For gas porosity, the simulation indicated that the distant filling area experienced late filling, leading to cold metal aggregation and air entrapment. The overlap of aluminum streams from different directions exacerbated this, creating vortices that trapped gas. Although vacuum-assisted die-casting was used, insufficient venting gaps in the overflow wells limited gas evacuation. The defect formation can be quantified by considering the gas entrapment probability, which relates to flow velocity and pressure drop:
$$P_{gas} = \int_{t_0}^{t_f} \left( \frac{|\mathbf{v} \times \nabla p|}{\rho} \right) dt$$
where $P_{gas}$ is a measure of gas entrapment risk, $t_0$ and $t_f$ are start and end times of filling, and the cross product highlights turbulent regions. To mitigate this, I implemented two corrective measures: widening the ingate near the problematic area by 13 mm to enhance aluminum supply and stability, and increasing the overflow well volume to capture more cold material and gas. These modifications, easily achieved through mold machining, significantly reduced porosity in the shell castings.
The internal layering defect, appearing as a seam-like discontinuity in the large circle, was attributed to multiple factors. First, improper parting line clearance allowed flash formation, which broke off during ejection and remained as inclusions. Second, delayed high-speed phase initiation in the injection profile caused the aluminum surface to solidify prematurely in the slow-shot stage, leading to shell formation that was later engulfed during high-speed injection. This can be modeled using a solidification front tracking equation:
$$\frac{\partial f_s}{\partial t} + \mathbf{v} \cdot \nabla f_s = \frac{1}{L} \nabla \cdot (k \nabla T)$$
where $f_s$ increases rapidly if slow-shot time is excessive. Third, poor aluminum melt quality, with oxides and impurities, contributed to layer formation. I addressed these by redesigning the parting line to include a small radius (e.g., 0.5 mm) to allow flash to adhere to the casting for easy removal, optimizing injection parameters (earlier high-speed switchover and increased slow-shot velocity), and enhancing melt treatment through rigorous degassing, slag removal, and cover ladling. Table 2 summarizes these defect analyses and countermeasures for shell castings.
| Defect Type | Location in Shell Castings | Root Causes | Corrective Actions | Outcome |
|---|---|---|---|---|
| Gas porosity | Filling end (water tail region) | Cold material accumulation; air entrapment from flow convergence; insufficient venting | Widen ingate by 13 mm; enlarge overflow wells; optimize vacuum system | Porosity reduced by over 80% in inspected samples |
| Internal layering | Large circular section of motor shell | Parting line flash; delayed high-speed phase; aluminum melt contamination | Add radius to parting line; adjust injection profile (high-speed at 500 mm); improve melt purification | Layering eliminated in 95% of production runs |
| Shrinkage porosity | Thick hotspots (e.g., bearing bores) | Inadequate feeding during solidification; high thermal gradients | Implement localized cooling channels; adjust gate size for pressure transmission | Shrinkage minimized to acceptable levels per X-ray inspection |
Process optimization for shell castings extends beyond defect correction. I refined the entire die-casting chain, from alloy preparation to machine settings. For aluminum melt quality, control parameters include hydrogen content (<0.1 mL/100 g Al) and oxide inclusion levels, monitored using reduced pressure test and PoDFA analysis. The solidification time $t_s$ for shell castings can be estimated using Chvorinov’s rule:
$$t_s = C \left( \frac{V}{A} \right)^n$$
where $V$ is volume, $A$ is surface area, $C$ is a mold constant, and $n$ is an exponent (typically ~2). By adjusting cooling line layouts, I achieved uniform solidification, reducing residual stresses. Moreover, the injection velocity profile was tuned using machine data logs. The ideal profile minimizes turbulent energy $E_t$, given by:
$$E_t = \int_{0}^{t_{fill}} \frac{1}{2} \rho |\mathbf{v} – \bar{\mathbf{v}}|^2 dV$$
where $\bar{\mathbf{v}}$ is the average velocity. Through iterative simulations and trials, I set slow-shot velocity to 0.3 m/s and high-shot velocity to 4.5 m/s, with switchover at 500 mm plunger stroke. This ensured laminar flow front advancement, critical for shell castings with thin walls.
The integration of numerical simulation into the development workflow for shell castings proved transformative. It allowed me to visualize aluminum flow patterns, temperature fields, and pressure distributions before tooling fabrication. For example, the simulation outputs included color-coded maps showing temperature gradients from 578°C to 640°C, which helped identify cold spots and hot tears. I also used simulation to evaluate different overflow and venting designs, calculating gas evacuation efficiency $\eta_{vent}$ as:
$$\eta_{vent} = \frac{m_{gas, out}}{m_{gas, total}} \times 100\%$$
where $m_{gas, out}$ is mass of gas expelled through vents and $m_{gas, total}$ is total gas mass generated. By optimizing vent sizes and locations, $\eta_{vent}$ improved from 65% to over 90%, directly enhancing the integrity of shell castings. Additionally, I employed statistical process control (SPC) charts to monitor key variables like shot speed, melt temperature, and cycle time, ensuring consistency in production.
In terms of material science, aluminum alloys for shell castings are often strengthened by elements like silicon, copper, and magnesium. The yield strength $\sigma_y$ can be approximated using the Hall-Petch relationship and solid solution strengthening:
$$\sigma_y = \sigma_0 + k_y d^{-1/2} + \sum_i K_i c_i^{2/3}$$
where $\sigma_0$ is lattice friction stress, $k_y$ is strengthening coefficient, $d$ is grain size, $K_i$ are constants, and $c_i$ are solute concentrations. For ADC12 alloy, typical composition is Si 10-13%, Cu 1.5-3.5%, Mg <0.3%, which balances fluidity and strength. During melting, I maintained a temperature of 680-710°C with frequent degassing using argon rotary impellers to reduce hydrogen porosity, a common issue in shell castings.
Looking at broader applications, shell castings are not limited to motor housings but extend to transmission cases, battery trays, and structural components in electric vehicles. The principles discussed here—simulation-driven design, gating optimization, and process control—are universally applicable. For instance, I have applied similar methods to develop lightweight shell castings for aerospace components, where even higher precision is required. The key is to adapt the simulation parameters to the specific alloy and geometry.
To encapsulate the improvements, Table 3 presents a before-and-after comparison of key performance indicators (KPIs) for the shell castings project. These metrics underscore the value of a systematic approach.
| KPI | Before Optimization | After Optimization | Improvement |
|---|---|---|---|
| Defect rate (gas porosity) | 15% of parts rejected | 3% of parts rejected | 80% reduction |
| Defect rate (internal layering) | 10% of parts rejected | 0.5% of parts rejected | 95% reduction |
| Leak-test failure rate | 12% exceeding 5 mL/min | 2% exceeding 5 mL/min | 83% reduction |
| Dimensional consistency (CpK) | 1.2 for critical features | 1.8 for critical features | 50% increase in process capability |
| Development cycle time | 12 weeks from design to stable production | 8 weeks from design to stable production | 33% reduction |
| Material yield (aluminum usage) | 85% including runners and overflows | 92% including runners and overflows | 7% increase in efficiency |
In conclusion, my work on aluminum alloy shell castings demonstrates the power of integrating numerical simulation with hands-on process engineering. By using tools like MAGMA, I could predict and prevent defects such as gas porosity and internal layering, significantly shortening development timelines and enhancing product quality. The optimization of gating systems, venting designs, and injection parameters, backed by melt purification and mold modifications, resulted in shell castings that meet the rigorous demands of electric vehicle applications. Future directions include adopting machine learning algorithms to further refine simulation accuracy and real-time process adjustments. As the automotive industry evolves, the role of high-precision shell castings will only grow, and continued innovation in die-casting technology will be essential to support the transition to sustainable mobility.