
In the field of metallurgical engineering, the quality assessment of spheroidal graphite iron castings is paramount, particularly in terms of graphite spheroidization rate. This parameter directly influences mechanical properties such as tensile strength, ductility, and fatigue resistance. Traditionally, the evaluation of graphite spheroidization rate relied on visual inspection of metallographic images, a method prone to subjective human error and inconsistent results. As a researcher dedicated to advancing non-destructive testing techniques, I have explored the integration of image analysis algorithms with statistical software to enhance precision. This article details my journey in developing a robust detection system, emphasizing the use of hardware-software synergy and data processing rigor. Throughout this discussion, the term ‘spheroidal graphite iron’ will be frequently highlighted to underscore its centrality in industrial applications.
The core objective of my work is to replace manual inspection with an automated, high-accuracy solution. Traditional methods often yield data with significant variability, making it challenging to maintain quality standards in spheroidal graphite iron production. By leveraging computer vision and statistical analysis, I aim to establish a reproducible and objective measurement protocol. This approach not only improves data fidelity but also aligns with Industry 4.0 trends towards digitalization and smart manufacturing. In this article, I will elaborate on the software implementation, experimental validation, and comparative analysis, all framed from my first-hand perspective as an investigator.
My system’s hardware configuration is straightforward yet effective. I connected an industrial control camera to a metallographic microscope, which interfaces with a computer via USB. This setup forms the backbone of the image acquisition module, capturing high-resolution micrographs of spheroidal graphite iron samples. The simplicity ensures accessibility for small-scale foundries while maintaining professional-grade imaging capabilities. The hardware architecture prioritizes stability and compatibility, avoiding complex peripherals that could introduce noise or latency. From my experience, this minimalistic design facilitates seamless integration with software components, allowing for real-time processing and analysis.
On the software front, I developed a custom pipeline that orchestrates the entire measurement process. The workflow consists of six sequential steps: image acquisition, noise reduction and grayscale conversion, threshold adjustment for graphite detection and spheroidization rate calculation, measurement mode selection, correction factor application for spheroidal graphite iron castings, and finally, spheroidization grading. Each step is algorithmically driven to minimize human intervention. For instance, noise reduction employs median filtering to preserve graphite boundaries, while grayscale conversion standardizes pixel intensity for consistent thresholding. This systematic approach ensures that every sample of spheroidal graphite iron is evaluated under uniform conditions, enhancing comparability across batches.
The underlying principle of the image analysis algorithm hinges on threshold segmentation. In a metallographic image, each pixel has a grayscale value denoted as \( i(x, y) \), where \( x \) and \( y \) represent spatial coordinates. By defining a threshold \( T \), I can binarize the image: pixels with grayscale values \(\geq T\) are set to white, and those < \( T \) to black. This transformation isolates graphite particles from the metallic matrix, simplifying subsequent morphological analysis. Mathematically, for an image \( I \), the binarized output \( B \) is given by:
$$ B(x,y) = \begin{cases} 1 & \text{if } I(x,y) \geq T \\ 0 & \text{if } I(x,y) < T \end{cases} $$
Threshold selection is critical; too high a value may omit faint graphite, while too low can include noise. I implemented adaptive thresholding techniques that adjust \( T \) based on local image statistics, catering to variations in lighting and sample preparation. This dynamic adjustment is particularly beneficial for spheroidal graphite iron, where graphite distribution can be heterogeneous. The algorithm iteratively optimizes \( T \) to maximize inter-class variance between graphite and background, a method inspired by Otsu’s algorithm.
Once binarized, the software segments individual graphite particles using a connected-components labeling algorithm. Each particle is assigned a unique identifier, enabling independent parameter computation. The key metric for characterizing graphite shape is the area ratio \( C \), defined as the ratio of the actual graphite cross-sectional area \( S \) to the area of its minimum enclosing circle \( S_0 \):
$$ C = \frac{S}{S_0} $$
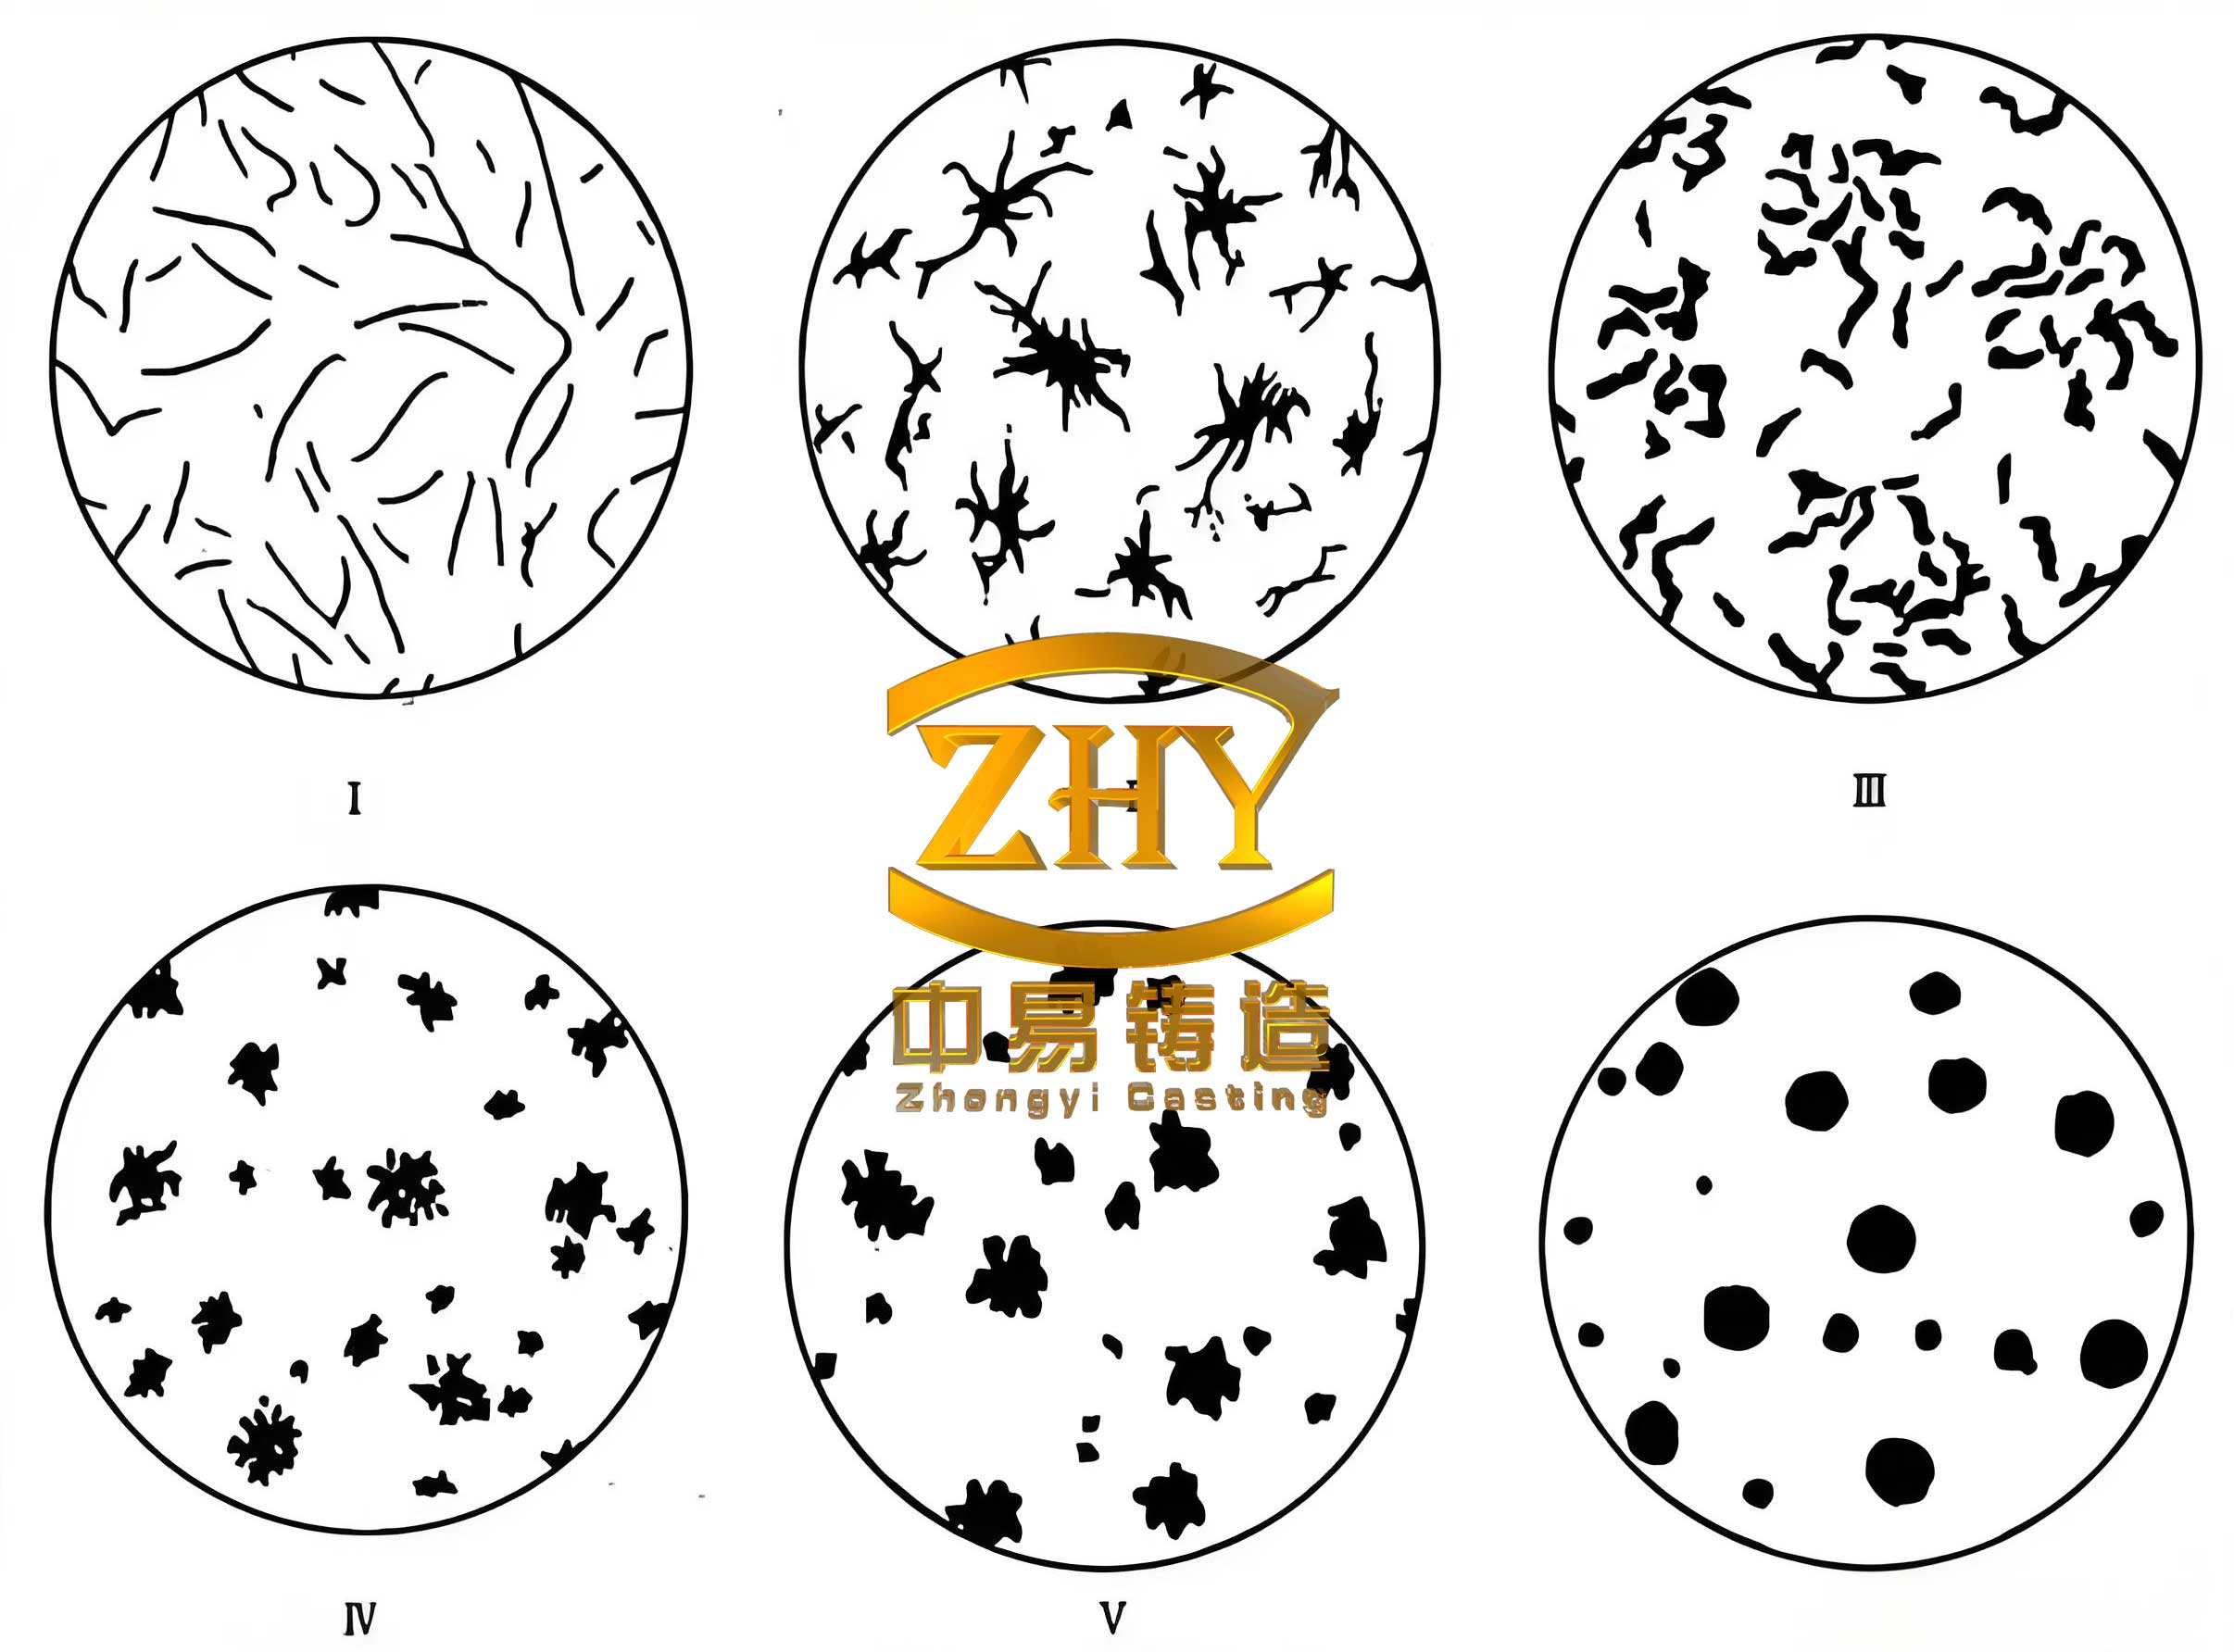
This ratio quantifies how closely a graphite particle resembles a perfect sphere. Based on industry standards, I classify graphite morphology into five categories, as summarized in Table 1. These categories are pivotal for determining correction factors in spheroidization rate calculations.
| Morphology | Area Ratio Range | Typical Shape Description |
|---|---|---|
| Spherical | \( C > 0.81 \) | Near-perfect spheres, ideal in spheroidal graphite iron |
| Nodular | 0.61 – 0.80 | Irregular but mostly rounded |
| Compact/Ver micular | 0.41 – 0.60 | Intermediate between nodular and flake |
| Flake (Vermicular) | 0.10 – 0.40 | Elongated, worm-like structures |
| Flake (Plate-like) | \( C < 0.10 \) | Thin, plate-like forms |
The classification directly informs the spheroidization rate \( S_G \), which aggregates contributions from all graphite particles in a field of view. The formula incorporates correction factors \( n \) that weight each morphology based on its deviation from ideal sphericity:
$$ S_G = \frac{1.0 \cdot n_{1.0} + 0.8 \cdot n_{0.8} + 0.6 \cdot n_{0.6} + 0.3 \cdot n_{0.3} + 0.0 \cdot n_{0.0}}{n_{1.0} + n_{0.8} + n_{0.6} + n_{0.3} + n_{0.0}} $$
Here, \( n_{1.0} \) to \( n_{0.0} \) represent the counts of graphite particles in each morphological category, with factors 1.0, 0.8, 0.6, 0.3, and 0.0 reflecting their respective contributions to spheroidization. A higher \( S_G \) indicates better quality spheroidal graphite iron. This weighted approach ensures that spherical graphite dominates the rating, aligning with engineering requirements.
Grading of spheroidal graphite iron castings follows established standards, which consider both spheroidization rate and graphite particle size distribution. My software automates this by cross-referencing computed metrics with lookup tables. For example, a sample with \( S_G > 85\% \) and average graphite size below 50 μm might be classified as Grade 1. The integration of these rules into the algorithm enables instant feedback, crucial for quality control in production lines.
To validate my system, I conducted a series of experiments using standard metallographic images from authoritative sources, all compliant with international norms for spheroidal graphite iron characterization. Each image was vetted for resolution and contrast to ensure analytical integrity. The experimental design centered on comparing three methodologies: traditional visual对照 (manual comparison with reference charts), standalone image analysis algorithm, and the hybrid image analysis algorithm coupled with SPSS statistical software. This tripartite comparison aimed to quantify improvements in accuracy and reliability.
The experimental procedure commenced with image acquisition via a calibrated scanner. Using Photoshop, I removed artifacts and enhanced boundaries to isolate graphite regions. Then, I employed Image-Pro Plus (IPP) software for granular analysis. Key steps included:
- Calibration of spatial scale based on magnification (e.g., 100×).
- Application of the “Size” function to measure graphite dimensions.
- Manual separation of overlapping particles when necessary.
- Extraction of parameters like area, perimeter, and Feret diameter.
For instance, in one sample, the largest graphite particle had a radius of 4.223 mm in pixel units, which translated to an actual length of 0.06537 mm after scale correction. This meticulous process was repeated across multiple fields of view to ensure statistical significance.
Data processing involved exporting raw measurements to SPSS version 24.0. I created new variables to compute area ratios and spheroidization rates. For example, roundness inverse (as a proxy for area ratio) was calculated using the transform command: 1/Round. Similarly, the area ratio relative to the minimum enclosing circle was derived via: Area/(π·Feret²/4). These transformations standardized data for comparative analysis. SPSS’s robust statistical functions allowed me to compute means, standard deviations, and confidence intervals, mitigating outliers and enhancing data credibility.
The results, synthesized in Table 2, demonstrate the superiority of the hybrid approach. All metrics—spheroidization rate, grading, and graphite size—showed enhanced precision when image analysis was augmented with SPSS processing.
| Metric | Image Analysis Algorithm Alone | Image Analysis + SPSS Processing | Traditional Visual Method |
|---|---|---|---|
| Graphite Spheroidization Rate (%) | 92.3 | 95.1 | 84.7 |
| Spheroidization Grade | 2 | 2 | 1 |
| Average Graphite Length (mm) | 0.06537 | 0.06571 | 0.06214 |
| Graphite Size Grade | 6.2 | 6.7 | 5.8 |
Beyond raw numbers, I evaluated sensitivity and specificity—critical indicators for diagnostic tests. Sensitivity measures the ability to correctly identify true spheroidal graphite iron samples with high spheroidization, while specificity gauges accuracy in rejecting inferior samples. As shown in Table 3, the hybrid method outperforms others, underscoring its diagnostic robustness.
| Method | Sensitivity (%) | Specificity (%) |
|---|---|---|
| Image Analysis Algorithm Alone | 85.23 | 77.61 |
| Image Analysis + SPSS Processing | 92.68 | 81.44 |
| Traditional Visual Method | 60.92 | 64.37 |
The enhanced sensitivity and specificity stem from the synergistic effect of image analysis and statistical validation. Image analysis provides granular morphological data, while SPSS identifies patterns and corrects systematic errors. For example, SPSS can apply regression models to adjust for sample preparation variations, a common issue in metallography of spheroidal graphite iron. This dual-layer processing reduces false positives and negatives, making the system reliable for high-stakes applications like automotive or pipeline components.
Delving deeper into the algorithm’s mechanics, I refined the thresholding process using entropy-based methods. For an image with normalized histogram \( p(i) \), the entropy \( E \) is defined as:
$$ E = -\sum_{i=0}^{L-1} p(i) \log_2 p(i) $$
where \( L \) is the number of gray levels. By maximizing the entropy between foreground (graphite) and background, I achieved more consistent segmentation across diverse samples of spheroidal graphite iron. This adaptive thresholding is particularly useful when dealing with low-contrast images, ensuring that even subtle graphite particles are captured.
Moreover, I incorporated shape descriptors beyond area ratio, such as circularity \( \Psi \) and aspect ratio \( \Lambda \), to capture nuanced morphological features:
$$ \Psi = \frac{4\pi S}{P^2}, \quad \Lambda = \frac{\text{Major Axis}}{\text{Minor Axis}} $$
where \( P \) is the perimeter. These descriptors feed into a multivariate classification model within SPSS, improving morphology categorization accuracy. For instance, circularity values above 0.9 strongly indicate spherical graphite, a hallmark of premium spheroidal graphite iron.
In terms of hardware-software integration, I optimized the pipeline for speed and resource efficiency. The entire process—from image capture to grade output—takes under 30 seconds per sample on a standard workstation, making it feasible for real-time quality inspection. The software logs all parameters in a database, enabling trend analysis over production runs. This historical data can reveal correlations between melting practices and graphite morphology, offering insights for process optimization in spheroidal graphite iron foundries.
Challenges encountered during development included overlapping graphite particles and inhomogeneous etching. To address overlapping, I implemented a watershed segmentation algorithm that separates touching objects based on intensity gradients. For etching variations, I normalized images using histogram equalization before thresholding. These pre-processing steps significantly improved repeatability, as evidenced by low coefficient of variation (<5%) in repeated measurements of the same spheroidal graphite iron sample.
The economic implications of this system are substantial. By automating spheroidization rate assessment, foundries can reduce reliance on skilled metallographers, cut inspection time, and minimize scrap due to human error. Consistent quality control translates to higher customer satisfaction and compliance with international standards for spheroidal graphite iron products. Furthermore, the digital records facilitate traceability, crucial for industries like aerospace and energy where material certification is mandatory.
Looking ahead, I plan to integrate machine learning algorithms to further enhance the system. Deep learning models, such as convolutional neural networks (CNNs), could be trained on vast datasets of metallographic images to directly predict spheroidization rates without explicit morphological measurements. This would streamline the pipeline and potentially achieve superhuman accuracy. However, the current hybrid approach remains highly effective and accessible, requiring minimal computational resources.
In conclusion, my exploration into graphite spheroidization rate detection for spheroidal graphite iron castings has yielded a robust methodology combining image analysis algorithms with SPSS statistical processing. The system demonstrates superior accuracy, sensitivity, and specificity compared to traditional methods. By automating measurements and leveraging statistical rigor, it provides a reliable tool for quality assurance in the production of spheroidal graphite iron. This work underscores the transformative potential of digital technologies in metallurgy, paving the way for smarter, data-driven manufacturing ecosystems. Future iterations will focus on cloud-based deployment and AI integration, but the core principles established here will continue to guide advancements in the characterization of spheroidal graphite iron.