
Chapter 1: Introduction
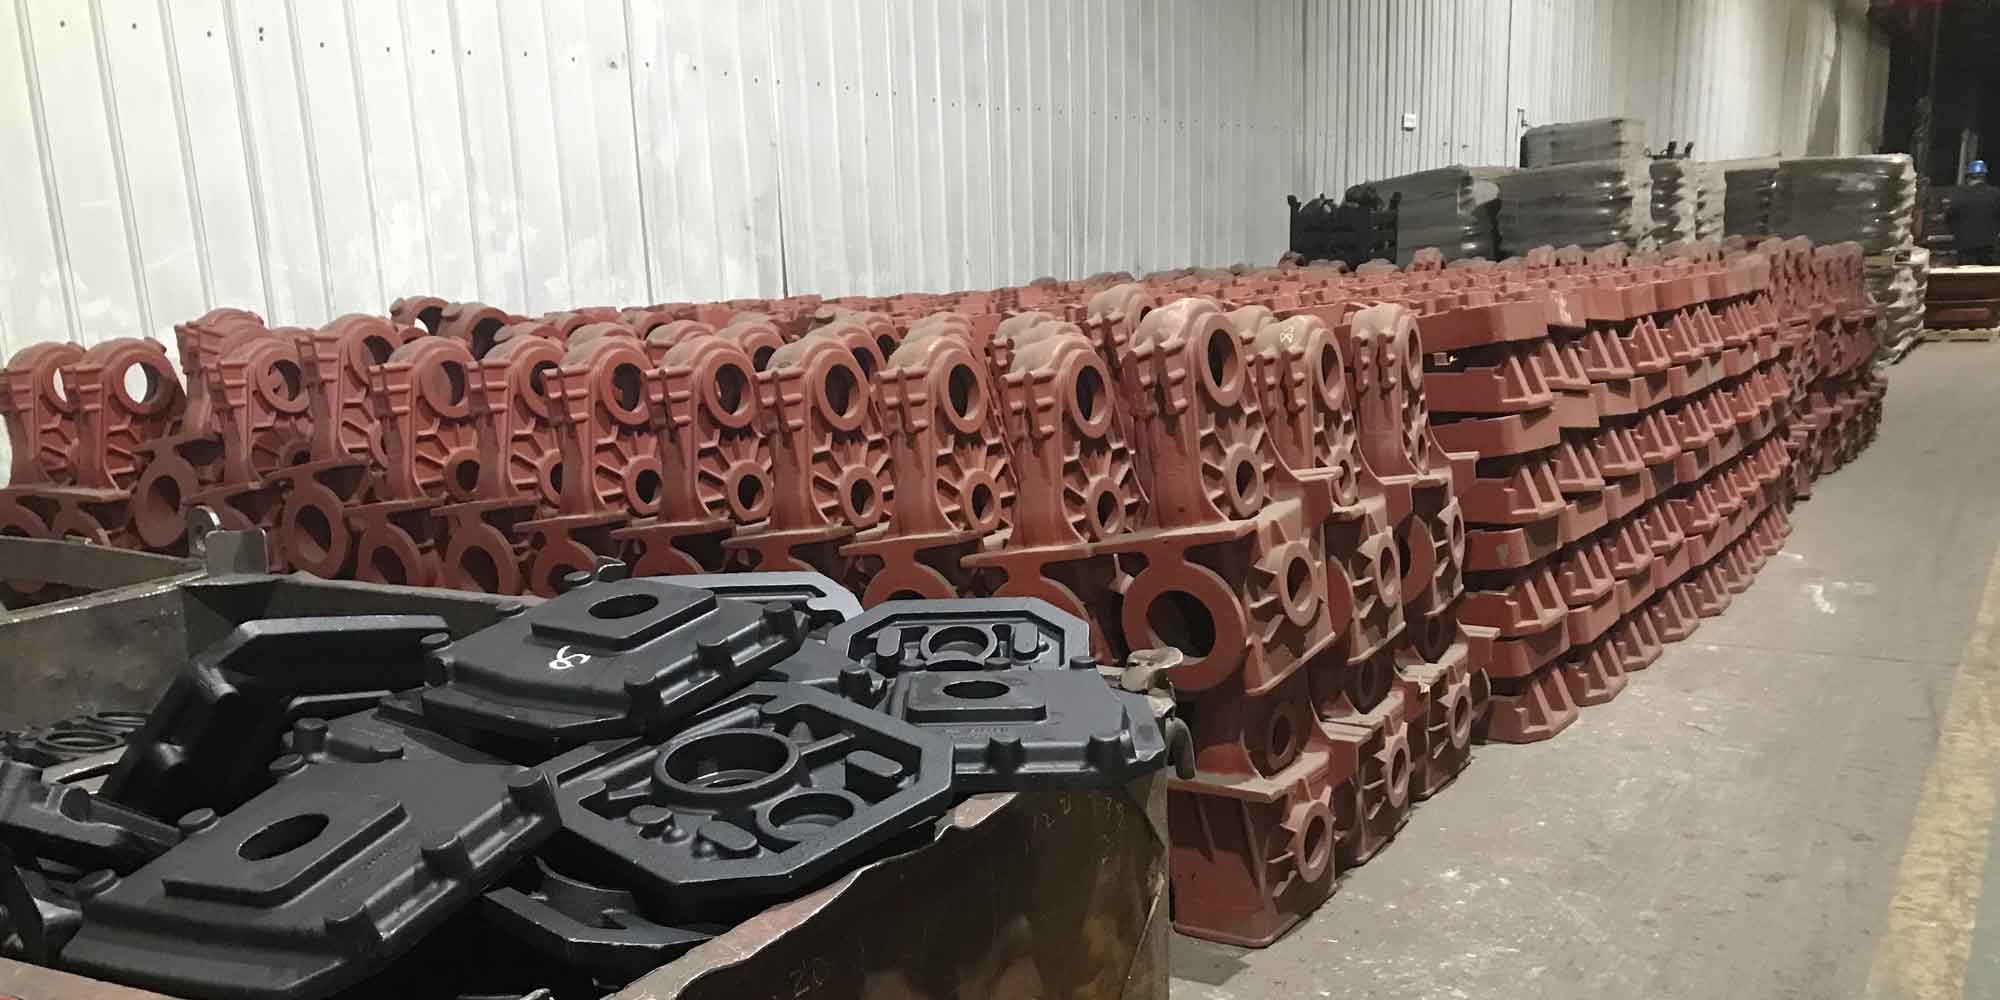
Renewable energy sources have become an essential alternative to conventional fossil fuels. Among these, wind energy has emerged as one of the most promising clean energy sources due to its abundant availability, low operational cost, and zero greenhouse gas emissions during operation. The wind turbine gearbox, as a critical component in the power transmission system, operates under extremely demanding conditions. The planet carrier, typically manufactured from high-quality steel casting materials, serves as the core structural component within the gearbox, supporting bearings, shafts, and gears throughout the power transmission process.
Wind turbines are frequently installed in remote onshore locations or offshore environments where they are subjected to harsh operating conditions, including fluctuating wind loads, impact loads, and extremely low ambient temperatures. In many northern regions of China, operating temperatures can drop to as low as -40°C. The combination of low temperatures and dynamic cyclic loading poses significant challenges to the structural integrity and service life of key components. The mechanical properties and fatigue resistance of steel casting materials used in these applications are critical indicators that directly influence the safety, reliability, and operational lifespan of wind turbine systems.
Statistical data from wind farm operations indicate that gearbox failures account for a substantial proportion of overall wind turbine downtime. The detection and replacement of damaged components require expensive crane equipment and intensive labor, while also exposing maintenance personnel to potential safety risks. Therefore, conducting comprehensive research on the low-temperature mechanical properties and fatigue resistance of planet carrier steel casting components holds significant theoretical importance and practical engineering value.
This research work aims to investigate the low-temperature mechanical behavior and fatigue resistance of steel casting material ZG35CrMo, commonly used in wind turbine gearbox planet carriers. Through material testing, finite element analysis, and microstructural characterization, this study provides valuable insights for the design, production, and performance evaluation of large-scale wind turbine components operating in cold climate conditions.
Chapter 2: Structural Modeling and Analysis of Wind Turbine Gearbox Planetary Transmission
2.1 Structural Characteristics of Planetary Transmission System
The wind turbine gearbox investigated in this research adopts a two-stage planetary transmission configuration. This arrangement offers several advantages, including compact axial dimensions, simple structure, high transmission ratio, excellent transmission efficiency, and superior load-sharing capability. The planetary transmission effectively reduces vibration and ensures smooth power output. In the two-stage planetary gear train configuration, the internal gear ring remains stationary while torque is input through the planet carrier. The planet gears rotate both around their own axes and revolve around the central gear, as shown in the structural schematic representation.
The fundamental parameters of the wind turbine gearbox are presented as follows: input speed of 14.35 r/min, output speed of 518 r/min, with a planetary transmission structure of the two-stage 2K-H (NGW) type. The total transmission ratio is calculated as:
$$i_{p} = \frac{n_{output}}{n_{input}} = \frac{518}{14.35} = 36.09 = i_{1} \cdot i_{2}$$
where $i_{1} = 6.3$ represents the first-stage transmission ratio and $i_{2} = 5.7$ represents the second-stage transmission ratio. The closeness of these two ratios provides balanced load distribution and compact structural arrangement.
2.2 Verification of Assembly Conditions
For the proper functioning of the planetary gear transmission, several assembly conditions must be satisfied. The concentricity condition ensures that the actual center distances between the sun gear and planet gears are equal to the center distance between the planet gears and the internal ring gear. For the 2K-H (NGW) type planetary transmission, this condition is expressed as:
$$a’_{ac} = a’_{cb}$$
For angularly modified planetary transmissions:
$$\frac{Z_{b} – Z_{c}}{\cos\alpha’_{bc}} = \frac{Z_{a} + Z_{c}}{\cos\alpha’_{ac}}$$
The assembly condition requires that the sum of the teeth of the sun gear and planet gear should be an integer multiple of the number of planet gears:
$$C = \frac{Z_{a} + Z_{c}}{n_{p}} \quad \text{(C is an integer)}$$
The adjacency condition ensures that there is sufficient clearance between adjacent planet gears:
$$2a’_{ac} \sin\frac{180^{\circ}}{n_{p}} > d_{ac}$$
where $d_{ac}$ is the tip diameter of the planet gear. The dimensional parameters of the two-stage planetary gear system are summarized below:
| Component | Number of Teeth | Module (mm) | Tip Diameter (mm) | Root Diameter (mm) | Pitch Diameter (mm) |
|---|---|---|---|---|---|
| First Sun Gear | 15 | 12 | 204 | 150 | 180 |
| First Planet Gear | 37 | 12 | 468 | 414 | 444 |
| First Ring Gear | 91 | 12 | 1068 | 1122 | 1092 |
| Second Sun Gear | 19 | 10 | 210 | 165 | 190 |
| Second Planet Gear | 35 | 10 | 370 | 325 | 350 |
| Second Ring Gear | 89 | 10 | 870 | 915 | 890 |
2.3 Force Analysis of Planetary Transmission
For the force analysis, the planet carrier is identified as the key research component. Several simplifying assumptions are adopted: loads are uniformly distributed among the multiple planet gears; gears rotate at constant angular velocity between the sun gear and ring gear; friction and self-weight are neglected. Under these assumptions, all components are in equilibrium, and the forces between components are equal and opposite to their reaction forces.
The input torque can be calculated using the rated power and input speed:
$$T_{a} = 9549\frac{P_{1}}{n_{1}}$$
For a single power split in the planetary gear train:
$$T_{a} = 9549\frac{P_{1}}{n_{p}}$$
The tangential force acting on the sun gear is:
$$F_{ca} = \frac{2000T_{a}}{d’_{a}}$$
The force relationship between components can be expressed as:
$F_{ac} = -F_{ca}$, $F_{bc} = F_{ac}$, $F_{xc} = -2F_{ac}$. The torque on the planet carrier is $T_{x} = n_{p}F_{cx}r_{x}$, and the torque on the internal ring gear is $T_{b} = n_{p}F_{cb}d’_{b}/2000$.
2.4 Finite Element Analysis
The planet carrier analyzed in this study is a double-wall integrated structure with a closed annular connecting plate, which is well-suited for large and medium-sized transmissions due to its high load-bearing capacity, excellent stiffness, and minimal deformation. The three-dimensional models of the planetary transmission system were constructed with appropriate simplifications, eliminating features such as bearings, retaining rings, and bolts that have minimal influence on the analysis results.
The finite element analysis was conducted using the following material parameters for the steel casting ZG35CrMo: elastic modulus $E = 2 \times 10^{11}$ Pa, Poisson’s ratio $\nu = 0.28$, and yield strength $\sigma_{s} = 534$ MPa. The model was discretized into 60,674 elements and 97,592 nodes, with refined meshing at critical locations including shaft holes and shoulder positions.
2.5 Static Analysis Results
The stress analysis of the planet carrier revealed that the overall stress distribution was relatively uniform throughout the component. The maximum stress of 194.9 MPa occurred at the shaft shoulder position of the planet carrier, which remained well below the yield strength of 534 MPa, satisfying the safety factor requirements. The strain analysis showed minimal deformation, with the maximum displacement of 0.02006 mm occurring at the outer rim. These results confirm that the planet carrier design is structurally sound, with no significant stress concentration observed at critical locations.
Chapter 3: Low-Temperature Mechanical Properties of Planet Carrier Steel Casting
3.1 Test Material
All test specimens were machined from the same heat of test block material attached to the planet carrier steel casting ZG35CrMo. The casting process and heat treatment procedures were identical to the actual production components. The chemical composition of the steel casting material is presented below:
| Element | C | Si | Mn | Cr | Mo | P | S | Fe |
|---|---|---|---|---|---|---|---|---|
| Content (wt%) | 0.35 | 0.41 | 0.57 | 0.97 | 0.21 | 0.0022 | 0.0026 | Balance |
3.2 Tensile Testing at Room Temperature
Tensile tests were conducted according to the standard for metallic materials at ambient temperature. Round cross-section standard specimens with a gauge length of 100 mm and diameter of 10 mm were prepared from the attached test block material. Before yielding, the stress rate was maintained at approximately 10 MPa/s; after yielding, the crosshead displacement rate did not exceed 0.5 mm/s.
The results of five replicate tests were averaged to obtain the basic mechanical properties of the steel casting material:
| Temperature | Tensile Strength $\sigma_{b}$ (MPa) | Yield Strength $\sigma_{s}$ (MPa) | Elongation $\delta$ (%) |
|---|---|---|---|
| Room Temperature | 777.645 | 534.314 | 13.03 |
3.3 Charpy Impact Testing
The Charpy impact test was selected to evaluate the impact toughness of the steel casting material. Both V-notch and U-notch specimens were prepared according to national standards. The V-notch impact tests were conducted at temperatures of 20°C, 0°C, -20°C, -40°C, and -60°C, while the U-notch impact tests were performed at 20°C, -20°C, and -60°C. The low-temperature environment was achieved using a mixture of liquid nitrogen and anhydrous ethanol, with specimens maintained at the target temperature for 15 minutes before rapid transfer to the impact testing machine.
The impact test results for the V-notch specimens are summarized below:
| Group | Temperature | Impact Energy $KV_{A}$ (J) | Average $KV_{A}$ (J) |
|---|---|---|---|
| 1 | 20°C | 58.5245, 62.8697, 56.1360, 73.9487 | 62.87 |
| 2 | 0°C | 67.5470, 58.3269, 55.4565, 51.9773 | 58.33 |
| 3 | -20°C | 18.8462, 22.5878, 25.5470, 23.3702 | 22.59 |
| 4 | -40°C | 18.7978, 18.7894, 17.7974, 19.7731 | 18.79 |
| 5 | -60°C | 17.5995, 17.9035, 17.7706, 18.3405 | 17.90 |
The impact test results for the U-notch specimens are presented below:
| Group | Temperature | Impact Energy $KU_{A}$ (J) | Average $KU_{A}$ (J) |
|---|---|---|---|
| 1 | 20°C | 84.4038, 89.7903, 91.2448, 93.7224 | 89.79 |
| 2 | -20°C | 31.1215, 34.0479, 30.2594, 40.7629 | 34.05 |
| 3 | -60°C | 21.5245, 24.3251, 26.8021, 24.6488 | 24.33 |
3.4 Analysis of Impact Test Data
The relationship between impact energy and temperature for the steel casting material exhibits a significant dependence on temperature. The impact energy decreases rapidly between 0°C and -20°C, demonstrating a clear transition from ductile to brittle behavior. At -60°C, the average impact energy decreased by approximately 72% compared to the value at room temperature, indicating a high sensitivity of this steel casting material to low-temperature conditions.
To quantitatively characterize the ductile-to-brittle transition behavior, the Boltzmann function was applied to fit the relationship between impact energy and temperature:
$$KV_{A} = A_{2} + \frac{A_{1} – A_{2}}{1 + \exp[(T – x_{0})/x]}$$
where $A_{1}$ represents the lower shelf energy, $A_{2}$ represents the upper shelf energy, $x_{0}$ is the ductile-to-brittle transition temperature, and $x$ describes the transition temperature range. The fitted curve exhibits the characteristic “S” shape that can be divided into three distinct regions: an upper shelf region at higher temperatures with predominantly ductile fracture behavior, a lower shelf region at low temperatures with brittle cleavage fracture, and a transition region where the material behavior changes from ductile to brittle. The ductile-to-brittle transition temperature for this steel casting material was determined to be approximately -9.8°C.
3.5 Fracture Morphology Observation and Mechanism Analysis
For the V-notch specimens at room temperature (20°C) and 0°C, the fracture surfaces exhibited significant roughness with clearly observable fiber zones and expansion zones, indicative of ductile tearing characteristics. Below -20°C, the fiber zones disappeared, and the fracture surfaces became relatively smooth with small crystallographic facets and no observable plastic deformation, indicating predominantly brittle fracture.
For the U-notch specimens, the fracture surface cross-section changed from a trapezoidal shape at room temperature to a rectangular shape at low temperatures, with decreasing macroscopic deformation and increasingly flat fracture surfaces. Three typical impact fracture regions were clearly observed: the fiber zone, radial zone, and shear lip. As the temperature decreased, the proportions of the fiber zone and shear lip decreased while the radial zone expanded correspondingly.
Comparing the impact energies between V-notch and U-notch specimens at the same temperature, the V-notch specimens consistently demonstrated lower impact energy values, approximately two-thirds of the U-notch values. This difference is attributed to the more severe stress concentration at the sharper V-notch configuration, which facilitates crack initiation and propagation.
Scanning electron microscopy (SEM) observation of the impact fracture surfaces revealed distinct microstructural features. At room temperature and 0°C, the fracture surfaces predominantly exhibited dimple characteristics typical of ductile fracture. At 0°C, the dimples were fewer, shallower, and larger in size compared to those at room temperature. With further temperature reduction, the ductile features transitioned to brittle features, with radial tearing ridges appearing due to rapid crack propagation. At -20°C, only scattered dimples remained, showing clear cleavage features. At -40°C, numerous cleavage steps and river patterns were observed. At -60°C, the fracture surface exhibited a crystalline appearance with metallic luster and distinct crystal particles.
The underlying mechanism for temperature-dependent fracture behavior relates to dislocation movement. As temperature decreases, dislocation movement becomes more difficult, and slip cannot proceed as fully as at room temperature, making brittle fracture more favorable. This explains both the decrease in impact energy and the transition in fracture morphology with decreasing temperature.
Chapter 4: Fatigue Performance of Planet Carrier Steel Casting
4.1 Fatigue Testing Methodology
Fatigue failure is characterized by structural damage accumulation under cyclic loading, occurring at stress levels far below the static strength limit. The fatigue process comprises three stages: micro-crack initiation (fatigue source formation), macro-crack propagation, and final unstable fracture. Based on the actual service conditions of the planet carrier, which primarily experiences tensile and torsional loads, the fatigue test was conducted under tension-tension loading conditions.
Fatigue test specimens were prepared according to national standards for metallic material fatigue testing. The specimens were machined and carefully hand-polished to remove surface scratches and burrs that could introduce undesirable stress concentrations. The fatigue testing was performed using a GPS100 high-frequency fatigue testing machine, with a stress ratio of 0.5 and a working frequency range of 110-114 Hz at room temperature (20°C).
4.2 Fatigue Test Results and S-N Curve
The stress levels for the fatigue tests were selected as different percentages of the yield strength determined from tensile testing. The fatigue test data obtained at various stress levels are presented below:
| Specimen No. | Stress Level (%) | Stress Value (MPa) | Number of Cycles |
|---|---|---|---|
| 1 | 60 | 320.40 | 12,905,414 |
| 2 | 65 | 347.10 | 6,964,871 |
| 3 | 70 | 373.80 | 5,429,980 |
| 4 | 80 | 427.20 | 4,867,454 |
| 5 | 90 | 480.60 | 2,682,280 |
| 6 | 110 | 587.40 | 2,234,910 |
| 7 | 120 | 640.80 | 2,153,864 |
| 8 | 130 | 694.20 | 1,971,451 |
The S-N curve was constructed using the fatigue test data. At the initial stage, as the stress level decreased, the increase in the number of cycles to failure was relatively modest. However, when the stress level decreased below approximately 500 MPa, the curve slope decreased more significantly, with the number of cycles increasing rapidly, indicating the high-cycle fatigue regime. At a stress level of 320 MPa, the S-N curve trend became nearly horizontal, with the corresponding fatigue life exceeding 10⁷ cycles, entering the infinite life region. Based on the S-N curve, the fatigue limit of the steel casting material ZG35CrMo was determined to be 320 MPa.
$$S = \sigma_{a} = \frac{\sigma_{max} – \sigma_{min}}{2}$$
4.3 Fracture Observation and Mechanism Analysis
Macroscopic observation of the fatigue fracture surfaces revealed three characteristic regions. The fatigue source region exhibited a relatively smooth and bright appearance. In the crack propagation region, the fracture surface showed significant unevenness with larger undulations. The final fracture zone had a relatively small area with a relatively smooth surface.
SEM observation of the fatigue fracture surfaces revealed the presence of fatigue striations, which are the definitive microstructural characteristic of fatigue failure. These striations appear as groups of parallel lines in the micrographs. Upon higher magnification, fatigue steps could also be clearly distinguished. The mechanism of fatigue striation formation is related to the cyclic nature of loading. When the cyclic tensile stress increases from minimum to maximum, the crack opens with stress concentration at the crack tip, causing crack propagation. As the rate of stress increase slows, crack tip stress concentration diminishes with tip blunting, and the crack propagation rate decreases. When the tensile stress decreases, the separation distance between crack surfaces reduces, causing partial crack closure, and minimal crack growth occurs during this phase. Each pair of striations represents one complete stress cycle.
4.4 Fatigue Analysis Comparison
To validate the experimental results, finite element fatigue analysis was performed on the planet carrier model in conjunction with the static analysis results. The comparison between the simulated and experimental S-N curves showed that the simulated results predicted fewer cycles to failure at the same stress level compared to experimental results. The fatigue limit obtained from simulation was also lower. The simulated S-N curve demonstrated similarity and consistency with the experimental curve, although it was more conservative in estimating fatigue life. This confirms that the experimental S-N curve provides reliable data for engineering design purposes.
Chapter 5: Fatigue Crack Propagation Theory and Fracture Toughness Testing
5.1 Fatigue Crack Propagation
Under long-term cyclic loading, structures develop cracks on surfaces or in internal regions, which undergo initiation, propagation, and final fracture stages. The fatigue crack propagation process can be divided into three distinct regions based on the relationship between crack growth rate and stress intensity factor range.
The first region represents slow crack propagation where the crack growth rate $da/dN$ is very small, and crack propagation does not occur until the stress intensity factor range reaches the threshold value $\Delta K_{th}$. In this region, material microstructure significantly influences crack initiation. The second region represents stable crack propagation, which is predominantly described by fatigue crack growth laws. In this region, environmental loading and mean stress are the primary factors controlling crack growth. This region is characterized by the well-known Paris-Erdogan equation:
$$\frac{da}{dN} = C(\Delta K)^{m}$$
where $C$ and $m$ are material-dependent constants. The third region represents unstable crack propagation where the crack accelerates rapidly, leading to sudden fracture failure.
5.2 Fatigue Crack Propagation Modes
Three modes of crack propagation are recognized in fracture mechanics. Mode I represents the opening mode where the crack faces separate under tensile loading perpendicular to the crack plane. This mode is the most dangerous and commonly encountered in engineering applications. The fracture toughness parameters determined from Mode I crack propagation tests provide the most conservative safety assessments.
5.3 Fracture Toughness Testing
The plane strain fracture toughness $K_{IC}$ is a critical material property that characterizes the ability of a material to resist unstable crack propagation under plane strain and small-scale yielding conditions. The fracture toughness testing was conducted using standard compact tension C(T) specimens, as shown in the specimen drawing. The test specimens were prepared from the attached steel casting material with two different sampling orientations: L-R orientation and C-R orientation, as illustrated in the sampling direction diagram.
Considering the potential fatigue failure locations in the planet carrier and the engineering safety requirements, the C-R oriented specimens were selected as the primary test specimens, while L-R oriented specimens served as references. The final shape of the C(T) specimens was achieved through wire electrical discharge machining. The specimen surfaces were polished to facilitate observation of crack propagation during fatigue crack pre-cracking.
5.4 Fatigue Crack Pre-cracking
Fatigue crack pre-cracking was performed using an MTS 809 Axial/Torsional Test System at room temperature with a loading frequency of 2 Hz. The propagation of the fatigue crack was monitored in real-time until the crack reached the predetermined length. The number of cycles required for pre-cracking is recorded below:
| Specimen No. | Orientation | Number of Cycles |
|---|---|---|
| 1 | C-R | 7,436 |
| 2 | C-R | 7,230 |
| 3 | C-R | 7,623 |
| 4 | C-R | 7,408 |
| 5 | C-R | 7,167 |
| 6 | L-R | 8,225 |
| 7 | L-R | 8,054 |
| 8 | L-R | 7,989 |
5.5 Fracture Toughness Determination
After fatigue crack pre-cracking was completed, the C(T) specimens were subjected to a slowly increasing tensile load with an extensometer installed in the specimen notch to measure crack opening displacement. The load P and crack mouth opening displacement V were recorded automatically to generate the P-V curves.
All P-V curves obtained from the testing exhibited the third common form, where the crack propagated or experienced subcritical crack propagation before reaching the maximum load. Therefore, the critical load $P_{Q}$ was determined from the intersection of the P-V curve with a straight line having a slope 5% less than the initial linear portion of the curve. This load is designated as $P_{5}$.
The stress intensity factor $K_{I}$ was calculated using the following equations:
$$K_{I} = \frac{P}{B\sqrt{W}} \cdot f\left(\frac{a}{W}\right)$$
$$f\left(\frac{a}{W}\right) = \frac{(2+\frac{a}{W})[0.886 + 4.64(\frac{a}{W}) – 13.31(\frac{a}{W})^{2} + 14.72(\frac{a}{W})^{3} – 5.6(\frac{a}{W})^{4}]}{(1-\frac{a}{W})^{3/2}}$$
where $B$ is the specimen thickness, $W$ is the distance from the loading hole center to the crack propagation edge, $a$ is the initial crack length, and $P$ is the critical load $P_{Q}$ determined from the P-V curve.
After the test, the fracture surfaces were examined to verify the morphology of the pre-crack. The crack lengths were measured at equal intervals across the specimen width, and the average value was calculated as:
$$a = \frac{a_{2} + a_{3} + a_{4}}{3}$$
The validity of the fracture toughness values was assessed using two criteria. The load ratio criterion requires:
$$\frac{P_{max}}{P_{Q}} \leq 1.1$$
The specimen thickness criterion requires:
$$B \geq 2.5\left(\frac{K_{I}}{\sigma_{Y}}\right)^{2}$$
where $\sigma_{Y}$ is the yield strength of the material. Only when both criteria were satisfied was the stress intensity factor $K_{I}$ considered a valid plane strain fracture toughness $K_{IC}$.
5.6 Results and Analysis
The fracture toughness data for the steel casting specimens are summarized below:
| Specimen No. | Orientation | a (mm) | $P_{Q}$ (kN) | $P_{max}$ (kN) | $P_{max}/P_{Q}$ | $K_{IC}$ (MPa·m1/2) |
|---|---|---|---|---|---|---|
| 1 | C-R | 10.2 | 17.371 | 17.371 | 1 | 75.386 |
| 2 | C-R | 10.2 | 17.324 | 17.324 | 1 | 75.182 |
| 3 | C-R | 10.1 | 17.901 | 17.901 | 1 | 77.686 |
| 4 | C-R | 10.3 | 18.198 | 18.198 | 1 | Invalid |
| 5 | C-R | 9.9 | 16.619 | 16.619 | 1 | 72.122 |
| 6 | L-R | 10.1 | 19.794 | 19.794 | 1 | 85.901 |
| 7 | L-R | 10.2 | 20.531 | 20.531 | 1 | 89.100 |
| 8 | L-R | 10.1 | 20.483 | 20.483 | 1 | 88.892 |
Based on the experimental data, the average fracture toughness $K_{IC}$ value for the C-R oriented specimens was 75.093 MPa·m1/2, while the L-R oriented specimens exhibited a significantly higher average value of 87.964 MPa·m1/2. This indicates that the steel casting material possesses better resistance to crack propagation along the axial direction compared to the radial direction.
The area under the P-V curve represents the energy absorbed during the entire process from crack initiation through propagation to final fracture. A larger energy absorption area indicates better resistance to crack propagation and fracture. SEM observation of the fracture surfaces revealed numerous dimples on both orientations at room temperature, characteristic of ductile fracture. However, distinct differences were observed. For the C-R oriented specimens, the dimples exhibited elongated shapes with a banded distribution pattern, and were relatively small and shallow. In contrast, the L-R oriented specimens showed deep dimples with uniform size and shape distribution, with more microstructural particles participating in the fracture process.
The fracture mechanism for this steel casting material involves the nucleation, growth, and coalescence of microvoids, ultimately leading to macroscopic crack propagation and fracture failure. The microstructural particles play a significant role in impeding and resisting crack propagation. For the L-R orientation, more particles participate in the crack propagation resistance process compared to the C-R orientation, resulting in better fracture toughness, which is consistent with the quantitative test results.
Conclusions
This research work conducted a comprehensive investigation of the low-temperature mechanical properties and fatigue resistance of planet carrier steel casting material ZG35CrMo used in wind turbine gearboxes. The key findings and conclusions are summarized as follows:
(1) Through structural analysis of the wind turbine gearbox planetary transmission system and finite element simulation, it was determined that the planet carrier is most susceptible to fatigue damage at the shaft shoulder position, where maximum stress concentration of 194.9 MPa occurs. This identification of fatigue-critical locations provides a basis for subsequent material testing and parameter selection.
(2) The Charpy impact testing at various temperatures demonstrated that the steel casting material ZG35CrMo exhibits a ductile-to-brittle transition temperature of approximately -9.8°C. At the same test temperature, the V-notch specimen had an impact energy of approximately two-thirds of the U-notch specimen. Microstructural observation revealed that as temperature decreases, dimples on fracture surfaces become smaller and shallower. Below the transition temperature, cleavage fracture characteristics become increasingly evident, with the appearance of river patterns and cleavage steps.
(3) The fatigue testing of the steel casting material established the S-N curve with a fatigue limit of 320 MPa. SEM observation confirmed the presence of typical fatigue striations on fracture surfaces, characteristic of fatigue failure, with each striation representing one complete stress cycle.
(4) Fracture toughness testing using standard C(T) specimens yielded plane strain fracture toughness values of 87.964 MPa·m1/2 for L-R oriented specimens and 75.093 MPa·m1/2 for C-R oriented specimens. The fracture mechanism was identified as microvoid nucleation, growth, and coalescence leading to macroscopic crack propagation and failure. The presence of microstructural particles impedes crack propagation, with the effect being more pronounced in the L-R orientation.
This research provides valuable theoretical support for the design, production, and application of large-scale wind turbine steel casting components designed for low-temperature service conditions. The findings contribute to improving the reliability and safety of wind turbine systems operating in harsh environments while reducing maintenance costs and promoting the further development of wind energy technology.