
In modern manufacturing, the increasing demand for complex components with intricate geometries, lightweight structures, and high precision has exposed the limitations of conventional casting technologies. The inherent difficulties in creating complex cores and molds, long lead times for tooling, and the high cost of flexible production have driven the exploration of additive manufacturing techniques. Among these, 3d sand printing has emerged as a transformative approach for producing sand molds directly from digital models without the need for physical patterns. By combining the geometric freedom of 3d sand printing with the robustness of traditional casting, it is possible to achieve integrated forming, rapid prototyping, and high-quality production of complex castings. In this study, I systematically investigated the influence of spatial grid structures on the performance of printed sand molds, optimized the process parameters using response surface methodology, and developed a complete 3d sand printing casting process for a thin-wall complex aluminum alloy component. Additionally, I explored the multi-piece arrangement of sand molds in a single print job to improve the utilization rate of the printing platform and reduce production costs. This thesis provides a theoretical basis and practical guidance for the industrial application of 3d sand printing in complex casting manufacturing.
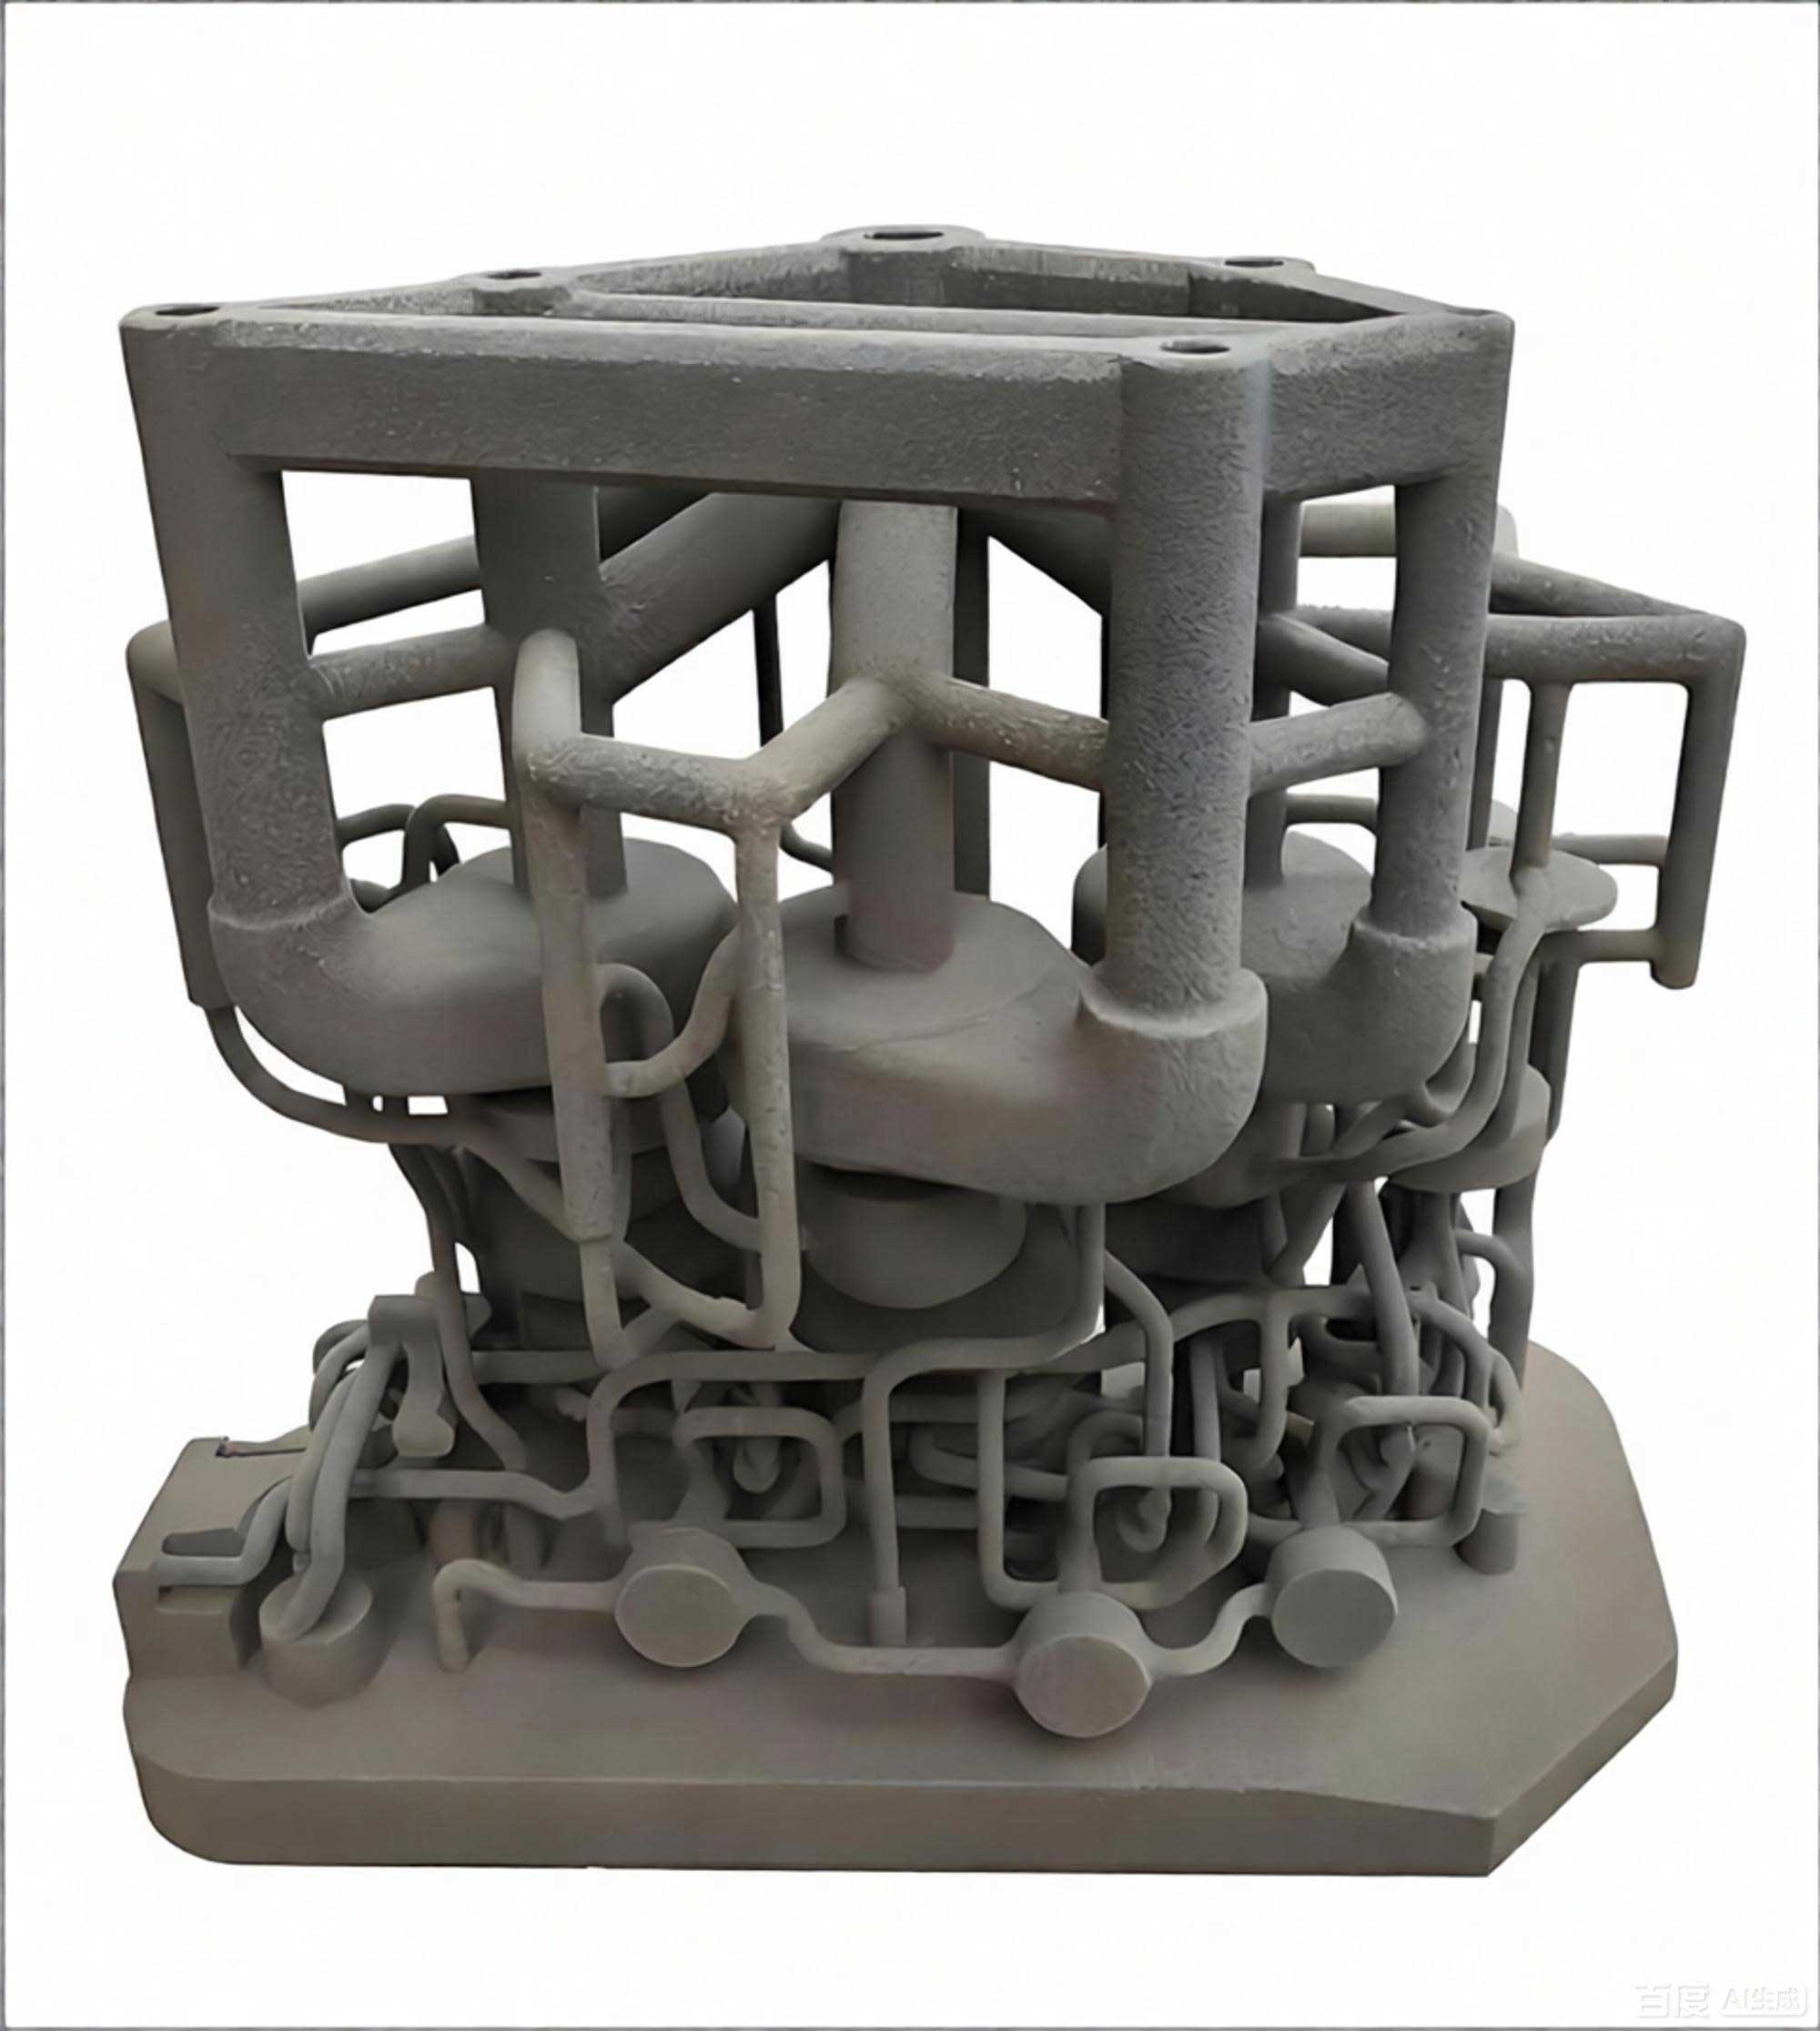
1. Materials and Experimental Methods
The experiments in this work were carried out using a binder jetting type 3d sand printing machine (DZ2000C). The printing layer thickness was set to 0.5 mm, and the forming accuracy was within ±0.3 mm. The raw sand was a commercial silica sand with an AFS fineness of 85–95, a clay content of about 0.12%, and a moisture content of less than 0.2%. The binder was furan resin with a density of 1.12–1.18 g/cm³ and viscosity of 5–20 mPa·s, while the curing agent was a sulfonic acid type. The sand mixture was prepared by uniformly mixing 100 parts by weight of sand with 2.5 parts of curing agent and then fed into the printer. The binder was selectively deposited on each layer of sand according to the sliced model data, and the parts were cured in a post-printing period of 24 hours before testing.
To evaluate the performance of the printed sand molds, I measured several key properties: compressive strength, flexural strength, gas evolution, and permeability. Standard cylindrical specimens (50 mm diameter, 50 mm height) were printed for compressive strength and permeability tests. Flexural strength specimens were rectangular bars with dimensions 151 mm × 11.2 mm × 11.2 mm, and tensile specimens were “8”-shaped. The strength tests were performed using an SWY-IIIS intelligent strength tester. Gas evolution was measured by an SFL-IIS gas evolution tester at 850°C for 120 seconds, using 1 g of sand taken from the specimens. Permeability was measured by an STD-III electric permeability tester. The moisture content was determined with a sand moisture tester. Grain size distribution was analyzed by an electromagnetic sieve shaker. The as-printed sand mold specimens were tested after 24 hours of room-temperature storage, with five samples per condition for statistical reliability.
2. Spatial Grid Structure and Optimization via Response Surface Methodology
2.1 Single-Factor Effects of Grid Parameters
I first designed grid structures with three hole geometries: circular holes with a diameter of 5 mm, square holes with a circumscribed circle diameter of 5 mm, and regular hexagonal holes with a circumscribed circle diameter of 5 mm. The gap between adjacent grid cells (wall thickness) was set to 3 mm. Compared with solid specimens, the circular-grid specimens showed a compressive strength of 3.316 MPa (reduction of 29.8%), flexural strength of 1.818 MPa (reduction of 32.3%), gas evolution of 10.8 mL/g (reduction of 1.55 mL/g relative to solid), and permeability of 233.5 (an increase of 123.9%). The square-grid specimens gave a compressive strength of 3.144 MPa, flexural strength of 1.624 MPa, gas evolution of 10.89 mL/g, and permeability of 231.6. The hexagonal-grid specimens gave a compressive strength of 2.769 MPa, flexural strength of 1.474 MPa, gas evolution of 11.01 mL/g, and permeability of 220.5. The circular hole structure provided the best overall balance, with higher strength and permeability while maintaining lower gas evolution.
Next, I investigated the effect of gap dimension (intercell wall thickness) from 1 to 5 mm while keeping the hole size constant at 5 mm. The results for circular grids are summarized in Table 1.
| Gap (mm) | Compressive strength (MPa) | Flexural strength (MPa) | Gas evolution (mL/g) | Permeability |
|---|---|---|---|---|
| 1 | 2.26 | 1.21 | 10.18 | 245.2 |
| 2 | 2.78 | 1.48 | 10.45 | 239.6 |
| 3 | 3.32 | 1.82 | 10.80 | 233.5 |
| 4 | 3.72 | 1.96 | 10.82 | 228.7 |
| 5 | 4.26 | 2.02 | 10.81 | 233.5 |
With increasing gap size, the strength increased monotonically because more binder and curing agent were needed to fill the larger structural walls, forming stronger bonding bridges. Gas evolution increased with gap size, but the growth slowed when gap exceeded 3 mm. Permeability generally decreased with larger gaps, although the trend was not strictly monotonic. Considering both strength and permeability, 3 mm was chosen as the central level for the response surface design.
I also varied the structural size (hole diameter or circumscribed circle diameter) from 3 to 7 mm while keeping the gap at 3 mm. For circular holes, the compressive strength decreased from about 4.47 MPa at 3 mm to 2.31 MPa at 7 mm, while flexural strength decreased from 2.29 MPa to 1.02 MPa in the same range. Gas evolution first decreased from 11.24 mL/g at 3 mm to 10.77 mL/g at 5 mm, then increased to 10.99 mL/g at 7 mm. Permeability increased from 226.1 at 3 mm to 234.3 at 5 mm, then dropped to 207.8 at 7 mm. Thus, 5 mm was selected as the central level for the structural size parameter.
2.2 Box-Behnken Response Surface Design
Based on the single-factor experiments, I established the following ranges: hole structure (A), with coded levels −1, 0, 1 representing square, circular, and regular hexagonal, respectively; gap dimension (B) from 2 to 4 mm; structural size (C) from 4 to 6 mm. The responses were compressive strength (Y1), flexural strength (Y2), gas evolution (Y3), and permeability (Y4). A Box-Behnken design was created with three factors and three levels, resulting in 17 experimental runs. The design matrix and measured responses are shown in Table 2.
| Run | A | B (mm) | C (mm) | Y1 (MPa) | Y2 (MPa) | Y3 (mL/g) | Y4 |
|---|---|---|---|---|---|---|---|
| 1 | -1 | -1 | 0 | 2.628 | 1.360 | 10.63 | 235.0 |
| 2 | 0 | 0 | 0 | 3.273 | 1.813 | 10.81 | 231.9 |
| 3 | 0 | -1 | 1 | 2.549 | 1.369 | 10.76 | 223.8 |
| 4 | 1 | 0 | -1 | 2.989 | 1.659 | 11.37 | 220.0 |
| 5 | -1 | 1 | 0 | 3.423 | 1.903 | 10.75 | 231.2 |
| 6 | 1 | -1 | 0 | 2.433 | 1.288 | 10.79 | 231.1 |
| 7 | 0 | 0 | 0 | 3.306 | 1.830 | 10.79 | 232.4 |
| 8 | 0 | 0 | 0 | 3.362 | 1.796 | 10.78 | 233.4 |
| 9 | 1 | 0 | 1 | 2.395 | 1.422 | 11.20 | 209.8 |
| 10 | -1 | 0 | -1 | 3.429 | 1.779 | 11.24 | 222.1 |
| 11 | 0 | 0 | 0 | 3.259 | 1.816 | 10.83 | 234.5 |
| 12 | 0 | 0 | 0 | 3.398 | 1.835 | 10.82 | 233.5 |
| 13 | 0 | 1 | -1 | 3.937 | 2.010 | 11.11 | 229.6 |
| 14 | 0 | 1 | 1 | 3.587 | 1.844 | 10.93 | 221.3 |
| 15 | 1 | 1 | 0 | 3.206 | 1.768 | 11.08 | 228.5 |
| 16 | -1 | 0 | 1 | 2.605 | 1.538 | 11.09 | 219.0 |
| 17 | 0 | -1 | -1 | 3.239 | 1.615 | 10.89 | 227.0 |
Using analysis of variance (ANOVA), I built quadratic regression models for each response. The final equations in terms of coded factors are given below.
For compressive strength:
$$Y_1 = 3.3196 – 0.13275A + 0.413B – 0.30725C – 0.0055AB + 0.0575AC + 0.085BC – 0.4353A^2 + 0.382B^2 – 0.0298C^2$$
For flexural strength:
$$Y_2 = 1.818 – 0.055375A + 0.23663B – 0.11125C – 0.01575AB + 0.001AC + 0.02BC – 0.17413A^2 – 0.064125B^2 – 0.044375C^2$$
For gas evolution:
$$Y_3 = 10.806 + 0.06625A + 0.125B – 0.07875C – 0.0075AB – 0.005AC – 0.0125BC + 0.1795A^2 – 0.123B^2 + 0.2395C^2$$
For permeability:
$$Y_4 = 233.14 – 2.2375A – 0.7875B – 3.15C + 0.3AB – 1.775AC – 1.275BC – 4.6955A^2 + 3.005B^2 – 10.72C^2$$
The ANOVA results are summarized in Table 3. All models were highly significant with p-values less than 0.0001. The lack-of-fit values were not significant, indicating good model adequacy. The coefficients of determination R² were above 0.98 for all responses, and the adjusted R² values were close to the predicted R² values, confirming the models’ predictive ability.
| Response | F-value | p-value | R² | Adj R² | Pred R² | C.V. (%) |
|---|---|---|---|---|---|---|
| Y1 (Compressive strength) | 57.05 | <0.0001 | 0.9866 | 0.9693 | 0.8487 | 2.50 |
| Y2 (Flexural strength) | 127.02 | <0.0001 | 0.9939 | 0.9861 | 0.9210 | 1.51 |
| Y3 (Gas evolution) | 62.47 | <0.0001 | 0.9877 | 0.9719 | 0.8410 | 0.31 |
| Y4 (Permeability) | 47.09 | <0.0001 | 0.9838 | 0.9629 | 0.8171 | 0.59 |
From the ANOVA, the order of significance of the linear factors on compressive strength, flexural strength, and gas evolution was B (gap size) > C (structural size) > A (hole structure). However, for permeability, the order was C > A > B. The interaction terms were mostly insignificant except for the AC interaction on permeability, which was significant (p = 0.033).
2.3 Optimization and Verification
I performed numerical optimization to maximize Y1, Y2, and Y4, while minimizing Y3, with equal weight for each response. The recommended solution was: circular hole structure, gap size of 3.67 mm, and structural size of 4.76 mm, predicting a compressive strength of 3.81 MPa, flexural strength of 2.01 MPa, gas evolution of 10.8 mL/g, and permeability of 235.9. Considering the practical adjustability of the printer, I set the gap size to 3.7 mm and structural size to 4.8 mm while keeping the circular geometry. Five specimens were printed and tested; the average values are listed in Table 4.
| Sample | Compressive strength (MPa) | Flexural strength (MPa) | Gas evolution (mL/g) | Permeability |
|---|---|---|---|---|
| 1 | 3.78 | 2.06 | 10.9 | 235.7 |
| 2 | 3.81 | 2.03 | 10.8 | 236.3 |
| 3 | 3.85 | 1.98 | 10.1 | 236.5 |
| 4 | 3.87 | 2.04 | 10.5 | 235.9 |
| 5 | 3.79 | 1.99 | 10.7 | 236.6 |
| Average | 3.82 | 2.02 | 10.6 | 236.2 |
Compared with the solid sand mold, the optimized grid structure reduced compressive strength by about 19%, but still satisfied the requirement for casting. Meanwhile, permeability increased by 126.9% and gas evolution decreased by 12.5%, significantly improving the gas escape capability and reducing the risk of gas-related defects. This confirmed that the response surface methodology was effective in optimizing 3d sand printing process parameters for grid-structured molds.
3. Casting Process Design and Simulation for a Thin-Wall Complex Casting
3.1 Casting Design
I selected a thin-wall ZL101A aluminum alloy casting with overall dimensions of about 145 mm × 125 mm × 130 mm, a maximum wall thickness of 18 mm, a minimum wall thickness of 2 mm, and an average wall thickness of about 5.5 mm. The component had many bosses, thin ribs, and asymmetric features, making it difficult to produce by conventional sand molding. The casting mass was about 0.6 kg. I designed a gating system based on traditional principles adapted for 3d sand printing. An open gating system was chosen, with a cross-sectional area ratio of straight runner : transverse runner : inner runner = 1 : 2 : 2.2. The minimum cross-sectional area of the inner runner was calculated using the conventional formula:
$$A_{\text{inner}} = \frac{G_L}{\rho_L \mu t \sqrt{2g h_p}}$$
where \(G_L\) is the total mass of liquid metal (casting + gating + riser), \(\rho_L\) is the liquid density, \(\mu\) is the flow coefficient, \(t\) is the pouring time, and \(h_p\) is the effective pressure head. The pouring time was estimated as \(t = S\sqrt{G_L}\) with \(S = 2.3\) for small castings. The effective pressure head was obtained from the geometry of the pouring system. The calculated inner runner area was about 3.2 cm². The gating system consisted of a pouring cup, a straight sprue, a runner, and six inner gates to ensure uniform filling and minimize oxidation.
The initial casting design included the riser placed on the top thick section. To improve directional solidification and reduce shrinkage defects, I optimized the design by adding chills at complex locations and additional blind risers. The chills were made of iron and placed at the bottom and middle of the casting, while the top riser was enlarged and three blind risers were added. The final optimized casting model with gating and riser system was used for numerical simulation.
3.2 Numerical Simulation Setup
I used ProCAST to simulate the mold filling and solidification processes. The casting assembly was imported as an IGES file, and a cubic sand box with dimensions of 200 mm × 200 mm × 200 mm was defined. The surface mesh was generated with 27,124 elements, and the volume mesh contained 353,209 elements. The casting material was EN AC-42100 (AlSi7Mg0.3), with an initial temperature of 725°C. The sand mold material was furan resin-bonded sand, initially at 25°C. The interfacial heat transfer coefficient between the casting and the sand mold was set to 500 W/(m²·°C), while that between the casting and the chills was 2000 W/(m²·°C). The mold outer surfaces were subjected to air cooling. The filling was simulated as gravity filling with a pouring time of 4 seconds, and the simulation was run until complete solidification.
3.3 Initial Simulation Results
The initial filling simulation showed that the liquid metal rose smoothly and evenly from the bottom toward the top of the mold cavity. The filling process was stable, with no splashing or underfilling observed. The total filling time for the cavity was about 4 seconds. The solidification sequence, however, was not favorable. The thin sections of the casting solidified first, while the thicker and more complex regions remained liquid for a longer time, creating isolated liquid pools. This resulted in a high risk of shrinkage porosity because those regions could not be fed by the riser once the feeding channels had solidified. The defect prediction from Porosity module indicated a total shrinkage porosity volume of 0.102 cc, with many defects located at the intersections of thin and thick sections and at complex geometric features. This confirmed that the initial design needed improvement.
3.4 Optimized Casting Simulation
In the optimized design, I added three chills at the bottom, one chill at a complex middle location, three chills at the top thick sections, and four additional blind risers. The modified gating system was simulated again. The filling process remained smooth and complete, with a filling time of 4.6 seconds. The solidification sequence was improved significantly: the chills accelerated the cooling of thick and complex areas, while the risers provided effective feeding during the later stages of solidification. The total solidification time was about 400 seconds. The predicted shrinkage porosity volume was reduced to 0.045 cc, a reduction of 55.9% compared with the initial design. The remaining defects were concentrated in the runner and risers rather than in critical areas of the casting. The optimized process was considered acceptable for production.
A comparison of the initial and optimized schemes is presented in Table 5.
| Scheme | Total shrinkage volume (cc) | Porosity volume (cc) | Defect mass (mg) |
|---|---|---|---|
| Initial | 7.416 | 0.102 | 0.122 |
| Optimized | 1.556 | 0.045 | 0.054 |
3.5 Trial Production of the Thin-Wall Casting
Using the optimized design, I prepared the sand molds by 3d sand printing. The mold was divided into four parts: bottom parting (60 mm high), second layer (45 mm), third layer (51 mm), and top layer (45 mm). Each layer had positioning protrusions and grooves to ensure accurate assembly. The gap between assembled parts was approximately 0.1–0.2 mm. The printed molds were left for 24 hours, then cleaned with compressed air and coated with a zirconia-based coating. After drying at 90°C for 1 hour, the chills and a ceramic foam filter were installed, and the mold was assembled. The assembled mold was preheated to 100°C for 2 hours before pouring. Approximately 1.51 kg of molten ZL101A alloy was poured at 725°C. After solidification and cooling, the casting was removed, and the gating and riser system was cut off by a band saw. The casting surface was smooth and free of visible defects. Dimensional inspection using a handheld 3D scanner showed that the casting was within tolerance.
The total lead time from initial design to the final trial casting was only 3 days, which is about 75% shorter than the conventional route (pattern making, core making, molding, and casting). This highlighted the advantage of combining 3d sand printing with conventional casting for complex parts.
4. Comparison of Microstructure and Mechanical Properties
To evaluate the influence of the molding process on the final casting quality, I prepared ZL101A alloy test plates using both traditional sand molding and 3d sand printing molding. The castings were subjected to the same pouring conditions and then cut into specimens for microstructure observation and tensile testing. Half of the specimens were tested in the as-cast condition and the other half after T6 heat treatment (solution at 520°C for 2 h, water quench, then artificial aging at 200°C for 3 h).
The optical micrographs revealed that in the as-cast state, both molding methods produced similar microstructures with angular, needle-shaped eutectic silicon particles dispersed in the α-Al matrix. After T6 heat treatment, the eutectic silicon became spheroidized and the sharp edges disappeared; the silicon particles were finer and more uniformly distributed in the 3d sand printing samples. Using the intercept method, I measured the secondary dendrite arm spacing (SDAS). The formula used was:
$$d = \frac{1}{m} \sum_{i=1}^{m} \frac{l_i}{n_i – 1}$$
where \(l_i\) is the length of the intercept line through the \(i\)-th dendrite group, \(n_i\) is the number of dendrite arms, and \(m\) is the total number of groups measured. The 3d sand printing samples exhibited a smaller SDAS, indicating a finer dendritic structure. This is because the printed sand mold had a higher thermal conductivity and a more open structure (especially with grid patterns), leading to faster cooling during solidification and hence a finer grain size.
Tensile tests were performed on the T6-treated specimens at a strain rate of 10 mm/min. Five specimens were tested for each condition, and the average values are summarized in Table 6.
| Molding method | Ultimate tensile strength (MPa) | Elongation (%) |
|---|---|---|
| Traditional sand molding | 249 | 2.2 |
| 3D sand printing molding | 288 | 2.8 |
The 3d sand printing samples achieved a tensile strength of 288 MPa and elongation of 2.8%, which are 15.7% and 27.3% higher than the traditional molding samples, respectively. Scanning electron microscopy of the fracture surfaces indicated a mixed ductile-brittle fracture mode in both cases. However, the traditional molding samples exhibited more pronounced cleavage facets and porosity, while the 3d sand printing samples showed a more uniform dimple structure, which contributed to their superior mechanical properties. This confirmed that the 3d sand printing process not only accelerates prototyping but also improves the structural integrity of castings.
5. Multi-Piece Printing and Space Arrangement in the Sand Printer
In practical production, 3d sand printing machines often suffer from low utilization of the build volume, especially when producing small batch castings. To address this, I introduced a metric called the sand utilization ratio (or mold-sand ratio), defined as the ratio of the sand volume used by the printed molds to the total volume of sand in the build box:
$$\eta = \frac{V_{\text{mold}}}{V_{\text{box}}} \times 100\%$$
where \(V_{\text{mold}}\) is the volume occupied by the printed sand molds (including cavities and solid walls) and \(V_{\text{box}}\) is the total volume of the build box. I designed a one-box-multiple-cavity casting layout for two different castings: the small thin-wall ZL101A casting (irregular shape, about 145×125×130 mm) and a larger ductile iron multi-way valve casting (about 313×252×156 mm). The small casting was produced in a six-cavity mold, while the larger casting was produced in a four-cavity mold. The molds were arranged in the build box (2000×1100×800 mm) using three strategies: horizontal arrangement, vertical arrangement, and mixed arrangement.
For the small thin-wall casting, the six-cavity mold had overall dimensions of 410×350×201 mm. The horizontal arrangement could place 30 molds in the box with a sand utilization of 49.17%, or 36 molds with 59% utilization in another configuration. The vertical arrangement allowed 27 molds (44.25%) or 36 molds (59%) depending on the orientation. The mixed arrangement achieved the highest values: 40 molds with 65.55% and 44 molds with 72.11% utilization.
For the larger multi-way valve casting, the four-cavity mold measured 750×600×256 mm. The horizontal arrangement placed 6 molds (39.27%) or 9 molds (58.91%). The vertical arrangement placed 7 molds (45.82%), 8 molds (52.36%), and 12 molds (78.55%). The mixed arrangement achieved either 10 molds (65.45%) or 12 molds (78.55%). The maximum utilization of 78.55% was reached when the molds almost completely filled the build box, demonstrating the importance of geometric packing optimization.
Finally, I combined both types of sand molds in the same build job to print two different castings simultaneously. The larger multi-way valve molds were used as the primary structure, and the smaller thin-wall molds were inserted into the remaining space. The best configuration placed 7 large molds and 16 small molds, giving a total of 23 sand molds with a sand utilization of 72.04%. This arrangement allowed the printer to produce both molds in a single run, saving both printing time and raw materials, and significantly improving overall efficiency. This demonstrated the feasibility of multi-material, multi-cavity printing in 3d sand printing for complex small-batch castings.
6. Conclusions
In this thesis, I investigated the development and application of 3d sand printing casting processes for complex castings. The main conclusions are summarized as follows:
- Spatial grid structures significantly affect the performance of printed sand molds. The circular hole structure offered the best balance among strength, gas evolution, and permeability. Using Box-Behnken response surface methodology, the optimal process parameters were determined: circular holes, a gap size of 3.7 mm, and a structural size of 4.8 mm. This combination produced a compressive strength of 3.82 MPa, flexural strength of 2.02 MPa, gas evolution of 10.6 mL/g, and permeability of 236.2. Compared to solid molds, the optimized grid structure increased permeability by about 127% and reduced gas evolution by 12.5% while preserving adequate strength for casting.
- The combination of traditional casting design and 3d sand printing enabled the rapid production of a thin-wall ZL101A casting. An open gating system with area ratios of 1:2:2.2 was designed. Numerical simulation allowed the optimization of risers and chills, reducing shrinkage defects from 0.102 cc to 0.045 cc and ensuring defect-free critical regions. The total trial production time was only 3 days, which is 75% shorter than conventional methods.
- The 3d sand printing molding process produced ZL101A castings with finer and more uniform microstructures than traditional molding. After T6 heat treatment, the ultimate tensile strength and elongation were 288 MPa and 2.8%, respectively, compared to 249 MPa and 2.2% for traditional molding. This confirms that 3d sand printing not only accelerates development but also enhances mechanical properties.
- For multi-piece production, I proposed a sand utilization ratio and demonstrated various spatial arrangements in the build box. For small castings, a mixed arrangement achieved 72.11% utilization; for larger castings, the maximum was 78.55%. By combining both types of molds in one print job, I placed 7 large and 16 small molds, achieving 72.04% utilization and proving the feasibility of printing multiple different sand molds simultaneously.
These findings provide a valuable reference for the industrial application of 3d sand printing in the rapid casting of complex components, with benefits in lead time reduction, material saving, and overall production efficiency.