
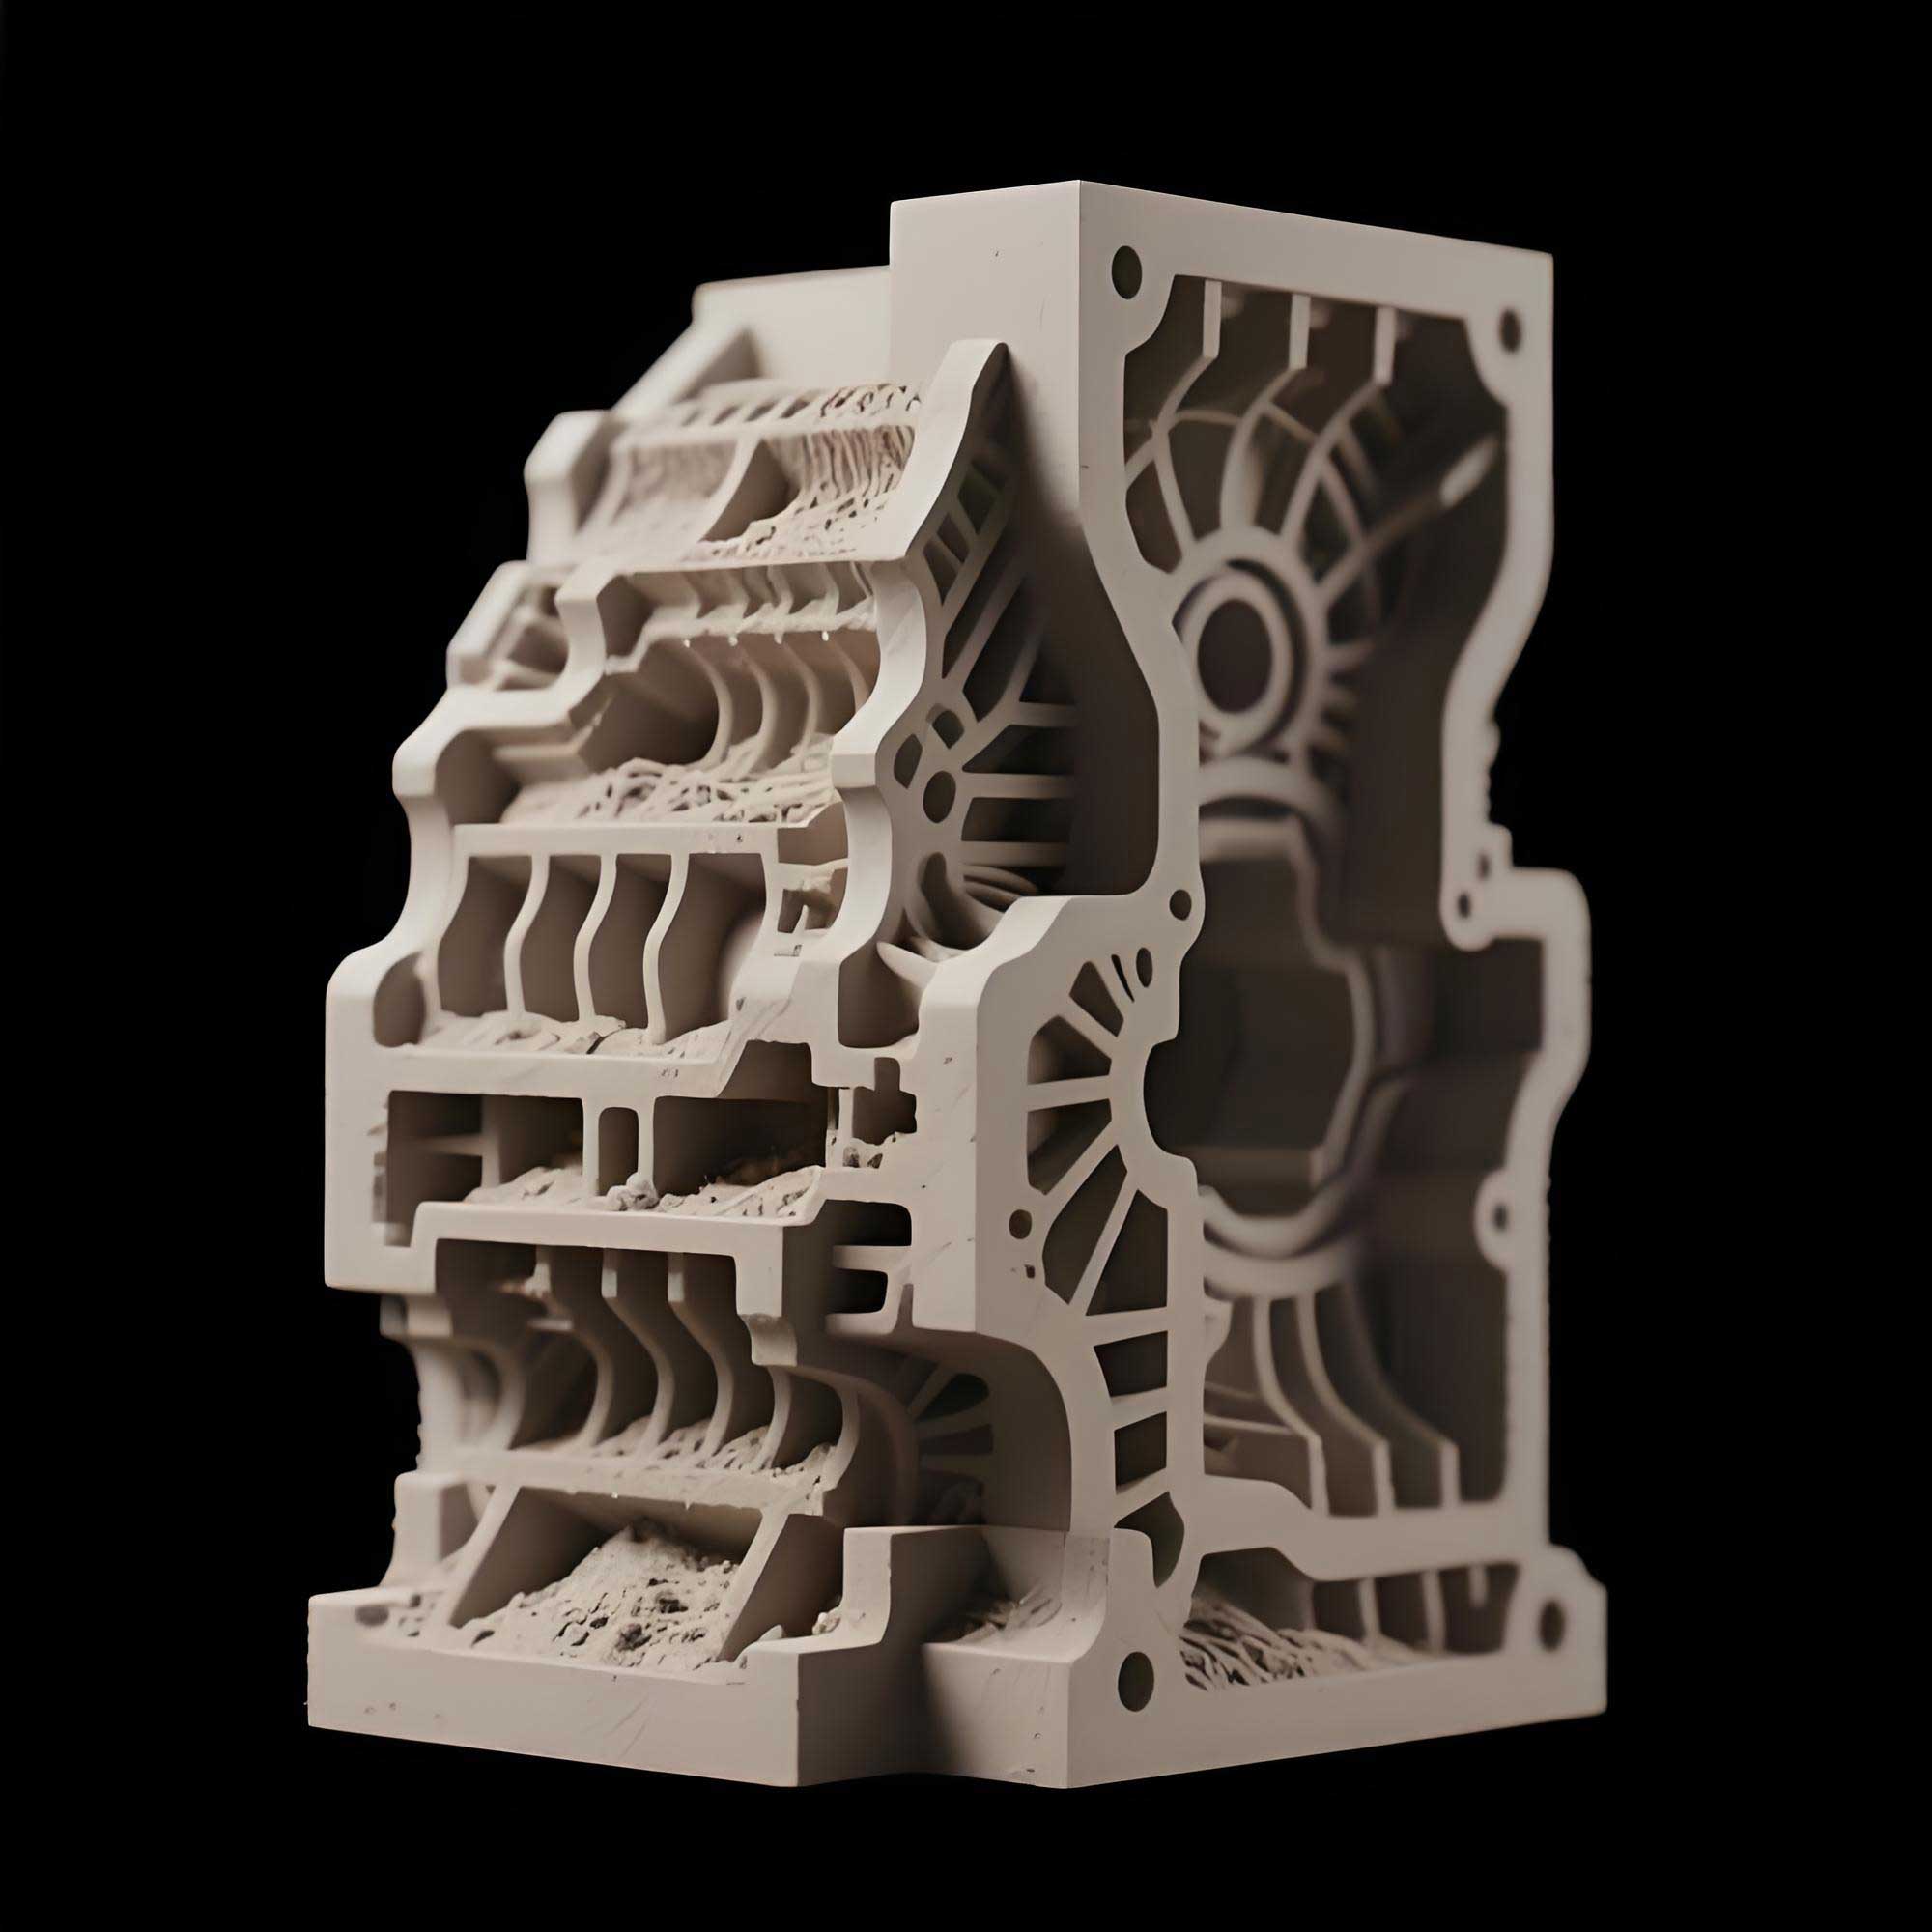
In recent years, with the widespread application of 3D sand printing technology in the foundry industry, the design philosophy of castings has been fundamentally liberated from the constraints of traditional molding processes. The development trend has been continuously moving toward complexity, thin-wall geometry, lightweight construction, and precision fabrication. These advancements have found extensive applications in aerospace, automotive, marine, and other critical industrial sectors. Consequently, the sand molds produced via 3D printing must possess excellent technological performance to meet the demanding requirements of high-quality casting formation. In our research, we adopted a systematic approach to optimize the 3D sand printing forming process, integrating response surface methodology with numerical simulation and practical casting trials. Our goal was to develop a cost-effective and high-performance sand mold suitable for producing thin-walled impeller castings with complex internal geometries.
Traditional molding methods involve mixing additives with base sand to create a sand mixture with a certain strength, which is then compacted manually or mechanically using patterns. In contrast, 3D sand printing operates on the principles of powder discrete accumulation and micro-droplet inkjet technology. The pre-mixed sand is vibrated and discharged through a sand spreader onto the printing platform to form a sand bed. The binder is then jetted from the printhead onto the designated forming area on the sand bed surface. Through the penetration and diffusion of the binder between sand grains, resin bridges are formed to bond the sand particles together, thereby achieving the fabrication of the target sand mold. One critical difference in this process is that no external force is applied to compact the sand. Consequently, higher binder and curing agent contents are often required to achieve high-strength printed sand molds. However, increasing the binder content also leads to a rise in gas evolution and adversely affects the forming accuracy of the mold. Additionally, higher raw material consumption significantly increases the production cost. On the other hand, the sand layering process determines the accumulation of each sand layer based on the set layer thickness. If the layer thickness is too small, the number of printing passes increases, reducing efficiency. Conversely, if the layer thickness is too large, the bonding force between sand particles weakens, resulting in lower mold strength. Therefore, a scientific data analysis method is essential to optimize the 3D sand printing forming process, ensuring that the resulting mold not only meets performance requirements but also minimizes raw material consumption.
Conventional optimization approaches typically employ controlled variable experiments to analyze the relationship between individual parameters and the response of interest. However, these methods inevitably neglect the interaction effects among parameters and thus cannot fully characterize the relationship between process variables and responses. Moreover, single-variable optimization requires a large number of experiments, which is time-consuming, material-intensive, and increases the overall experimental cost. To overcome these limitations, researchers have introduced multivariate statistical techniques to optimize the analysis process. Among these, the response surface methodology is the most widely adopted approach. The Box-Behnken design (BBD) in particular offers an efficient experimental strategy that can estimate main effects, interaction effects, and quadratic effects of the process variables with a relatively small number of experimental runs. In our study, we employed the Box-Behnken response surface method to conduct optimization experiments for the 3D sand printing forming process, with tensile strength and gas evolution as the performance responses.
Experimental Materials and Equipment
The primary materials used in our experiments were silica sand as the base aggregate, a 3D printing furan resin as the binder, and a specialized 3D printing curing agent. The key performance indicators of these three materials are summarized in Tables 1 through 3 below.
Table 1. Technical performance of 3D printed silica sand
| w(Si)/% | Average fineness/μm | Loss on ignition (LOI)/% | Angular coefficient | Bulk density/(g·cm-3) |
| 90~92 | 64~72 | ≤0.2 | <1.25 | 1.35~1.45 |
Table 2. Technical performance of 3D printed furan resin
| Viscosity/(mPa·s) | Density/(g·cm-3) | Electrical conductivity/(μS·cm-1) | Surface tension/(mN·m-1) | Free formaldehyde/% |
| 6~8 | 1.12~1.18 | ≤20 | 35~40 | ≤0.1 |
Table 3. Technical performance of 3D printed curing agent
| Viscosity/(mPa·s) | Density/(g·cm-3) | Total acidity/% | Free sulfuric acid/% |
| 20~40 | 1.30~1.35 | 25.5~26.5 | <2.5 |
The 3D sand printing equipment employed in this investigation was an ExOne S-Max Pro printer, with a build volume of 1800 mm × 1000 mm × 700 mm, a printing resolution of 400 dpi, and an adjustable layer thickness range of 0.20 to 0.50 mm. The tensile strength of the printed sand molds was measured using a SWY-B digital hydraulic strength testing machine, while the gas evolution was evaluated using a GET-III intelligent gas evolution tester. All performance tests on the printed specimens were conducted in accordance with the national standard GB/T 2684-2009.
Optimization Experiment Design
Based on our operational experience with the 3D sand printing equipment, we established the plausible ranges for the forming process parameters. Three variables were selected: resin inkjet content (%), curing agent addition (%), and printed layer thickness (mm). The resin inkjet content was defined as the mass fraction of resin relative to the sand within the forming area of each layer, while the curing agent addition referred to the mass fraction of the curing agent in the pre-mixed sand. The response variables were the tensile strength (MPa) and gas evolution (mL/g) of the printed sand specimens. We employed a three-factor, three-level Box-Behnken design via Design-Expert software, and the experimental design factors and their level coding are presented in Table 4.
Table 4. The factors and level coding of experimental design
| Level | Resin inkjet content (A)/% | Curing agent addition (B)/% | Layer thickness (C)/mm |
| 1 | 1.35 | 0.20 | 0.25 |
| 2 | 1.50 | 0.30 | 0.35 |
| 3 | 1.65 | 0.40 | 0.45 |
The Box-Behnken design was specifically chosen because compared to other response surface designs, such as central composite design, the BBD requires approximately 37% fewer experimental runs while still providing a reliable estimation of the quadratic response surface model. This reduction in experimental effort significantly shortens the development cycle and reduces material consumption. In our case, the BBD generated a total of 17 experimental runs, including 5 center point replicates to estimate the pure experimental error. The experimental sequence was randomized to minimize the influence of uncontrolled systematic variations. The performance responses measured for each parameter combination are listed in Table 5.
Table 5. BBD design and experimental results
| Run No. | A | B | C | Tensile strength/MPa | Gas evolution/(mL·g-1) |
| 1 | 3 | 2 | 3 | 2.17 | 11.50 |
| 2 | 2 | 2 | 2 | 2.14 | 10.33 |
| 3 | 3 | 1 | 3 | 2.31 | 11.06 |
| 4 | 3 | 2 | 1 | 2.59 | 11.63 |
| 5 | 2 | 2 | 2 | 2.22 | 10.18 |
| 6 | 2 | 3 | 1 | 2.31 | 10.69 |
| 7 | 2 | 1 | 1 | 2.38 | 9.80 |
| 8 | 1 | 2 | 3 | 1.46 | 7.39 |
| 9 | 2 | 2 | 3 | 1.93 | 9.62 |
| 10 | 2 | 2 | 2 | 2.13 | 10.30 |
| 11 | 1 | 2 | 1 | 1.64 | 7.04 |
| 12 | 2 | 2 | 2 | 2.18 | 10.21 |
| 13 | 3 | 3 | 2 | 2.37 | 12.05 |
| 14 | 2 | 3 | 3 | 1.88 | 10.44 |
| 15 | 1 | 2 | 2 | 1.82 | 7.61 |
| 16 | 2 | 2 | 2 | 2.26 | 10.16 |
| 17 | 1 | 3 | 2 | 1.67 | 8.16 |
The statistical significance and adequacy of the developed models were evaluated by analysis of variance (ANOVA). For the model to be considered statistically meaningful, it should exhibit a significant P-value (typically less than 0.05), while the lack-of-fit term should be non-significant (typically greater than 0.1). Additionally, we examined the coefficient of determination R², the adjusted R², and the coefficient of variation (Cv) to verify the goodness of fit and the reliability of the predictions.
Tensile Strength Response Surface Analysis
The ANOVA results for tensile strength are presented in Table 6. The model F-value of 56.68 and the associated P-value (<0.0001) indicate that the quadratic model is highly significant. The lack-of-fit P-value of 0.5055, which is greater than 0.1, confirms that the lack of fit is not significant relative to pure error, thereby validating that this model can be used to predict the tensile strength responses within the studied range. The coefficient of determination R² = 0.9865 suggests that over 98% of the variability in tensile strength is captured by the model, demonstrating excellent agreement between the experimental data and the model predictions. The adjusted determination coefficient R²Adj = 0.9691 implies that less than 4% of the total variation in tensile strength is unexplained. Furthermore, the coefficient of variation Cv = 2.58% is relatively low, confirming the high precision and reliability of the experimental results.
Table 6. Variance analysis for tensile strength
| Source | Sum of squares | df | Mean square | F-value | P-value |
| Model | 1.47 | 9 | 0.1635 | 56.68 | <0.0001 |
| A | 1.02 | 1 | 1.02 | 351.93 | <0.0001 |
| B | 0.0001 | 1 | 0.0001 | 0.0390 | 0.8491 |
| C | 0.3444 | 1 | 0.3444 | 119.39 | <0.0001 |
| AB | 0.0002 | 1 | 0.0002 | 0.0780 | 0.7881 |
| AC | 0.0009 | 1 | 0.0009 | 0.3120 | 0.5939 |
| BC | 0.0001 | 1 | 0.0001 | 0.0347 | 0.8576 |
| A² | 0.0970 | 1 | 0.0970 | 33.61 | 0.0007 |
| B² | 0.0057 | 1 | 0.0057 | 1.97 | 0.2031 |
| C² | 0.0025 | 1 | 0.0025 | 0.8583 | 0.3851 |
| Residual | 0.0202 | 7 | 0.0029 | ||
| Lack of fit | 0.0083 | 3 | 0.0028 | 0.9256 | 0.5055 |
| Pure error | 0.0119 | 4 | 0.0030 | ||
| Total | 1.49 | 16 |
By fitting the data from Table 6 using the design expert software, we established the following quadratic regression equation for tensile strength:
$$Y_{1} = 2.19 + 0.3563A – 0.0037B – 0.2075C + 0.0075AB – 0.015AC + 0.005BC – 0.1518A^{2} – 0.0368B^{2} – 0.0242C^{2}$$
To visually assess the main effects and interaction effects of the process parameters on tensile strength, we generated three-dimensional response surface plots and two-dimensional contour plots from the regression model. In response surface analysis, the steepness of the slope in the response surface plot reflects the degree of influence of the corresponding process variable on the response. Furthermore, the shape of the contour lines provides insight into the significance of interaction effects: a more elliptical contour indicates a more significant interaction between the corresponding variables. When the printed layer thickness was held constant at 0.35 mm and the curing agent addition was fixed at 0.30%, the tensile strength rapidly increased with increasing resin inkjet content. This reveals that the resin inkjet content is the dominant factor controlling tensile strength. At the same time, when the resin inkjet content was held at 1.50%, varying the curing agent addition had negligible impact on the tensile strength. When the curing agent addition was kept at 0.30%, reducing the layer thickness improved the tensile strength at a rate slower than the rate of increase caused by elevating the resin inkjet content. Among the two-factor interaction combinations, the combination of resin inkjet content and printing layer thickness produced the most elliptical contour lines, signifying the most significant interactive effect on tensile strength. This observation supports the conclusion that resin inkjet content and layer thickness are the primary controlling factors, while the curing agent content plays a comparatively minor role when the printed specimens are dried and allowed to cure for 24 hours.
The tensile strength of printed sand molds is primarily derived from the bonding bridges formed between sand grains. When the resin content increases, the number of bonding bridges between sand particles increases and the specific surface area for bonding also expands. Thus, tensile strength of printed sand molds shows a strong positive linear correlation with resin inkjet content. Printed layer thickness, often referred to as the z-resolution, alters the number of layers in the object and thereby influences the binder diffusion behavior between adjacent sand layers. As the layer thickness increases, the quantity of resin binder per unit volume of sand bed may become insufficient to form complete bonding bridges, thus reducing tensile strength. The curing agent governs the kinetics of the resin curing reaction, which is accompanied by the generation of water that can dilute the acid catalyst and hinder the reaction progress. However, since the printed “Figure-8” test specimens were oven-dried and conditioned for 24 hours before tensile testing, the moisture-related effects were significantly reduced. Therefore, under the interactive conditions of the studied parameters, the influence of curing agent content on tensile strength was not statistically significant.
Gas Evolution Response Surface Analysis
The ANOVA results for gas evolution are summarized in Table 7. The model F-value of 564.2 with a P-value <0.0001 confirms the high statistical significance of the model. The lack-of-fit P-value of 0.3245 indicates that the lack of fit is not significant relative to pure error, allowing the model to be used for reliable predictions. The coefficient of determination R² = 0.9986 and the adjusted R²Adj = 0.9969 both demonstrate a strong correlation between the observed and predicted values. Moreover, the coefficient of variation Cv = 0.849% is exceptionally low, confirming that the experimental results are highly consistent and reproducible.
Table 7. Variance analysis for gas evolution
| Source | Sum of squares | df | Mean square | F-value | P-value |
| Model | 35.81 | 9 | 3.98 | 564.2 | <0.0001 |
| A | 32.16 | 1 | 32.16 | 4559.88 | <0.0001 |
| B | 1.82 | 1 | 1.82 | 258.63 | <0.0001 |
| C | 0.0760 | 1 | 0.0760 | 10.78 | 0.0134 |
| AB | 0.0042 | 1 | 0.0042 | 0.5990 | 0.4643 |
| AC | 0.0020 | 1 | 0.0020 | 0.2871 | 0.6087 |
| BC | 0.0012 | 1 | 0.0012 | 0.1737 | 0.6893 |
| A² | 1.68 | 1 | 1.68 | 238.27 | <0.0001 |
| B² | 0.0030 | 1 | 0.0030 | 0.4272 | 0.5342 |
| C² | 0.0217 | 1 | 0.0217 | 3.07 | 0.1230 |
| Residual | 0.0494 | 7 | 0.0071 | ||
| Lack of fit | 0.0269 | 3 | 0.0090 | 1.59 | 0.3245 |
| Pure error | 0.0225 | 4 | 0.0056 | ||
| Total | 35.86 | 16 |
By fitting the experimental data, the following quadratic regression equation was established for gas evolution:
$$Y_{2} = 10.24 + 2.0A + 0.4775B – 0.0975C – 0.0325AB + 0.0225AC – 0.0175BC – 0.6317A^{2} – 0.0268B^{2} – 0.0718C^{2}$$
Examining the response surface and contour plots for gas evolution, we observed that when the layer thickness remained at 0.35 mm and the curing agent was at 0.30%, the gas evolution increased much more rapidly with resin inkjet content than with curing agent content. This confirms that resin inkjet content is the dominant variable controlling gas evolution. When the curing agent was held constant at 0.30% and the resin inkjet content at 1.50%, variations in printed layer thickness had almost no discernible effect on gas evolution. Similarly, with a constant resin inkjet content of 1.50% and layer thickness of 0.35 mm, changing curing agent addition and layer thickness jointly produced minimal impact. Among the two-factor interactions, the combination of resin inkjet content and curing agent addition produced the most pronounced elliptical contours, suggesting that these two parameters have the most significant synergistic effect on gas evolution.
The gas evolution of a printed sand mold is defined as the quantity of gas generated per unit mass of sand when heated, and it is directly related to the tendency of the casting to develop blowhole defects. Furan resin is an organic compound that decomposes at elevated temperatures around 850 °C, producing volatile gases. As the resin content in the sand increases, more organic matter is available to decompose, thereby increasing the gas yield. The curing agent provides the acidic environment necessary for the curing reaction, and a higher curing agent concentration accelerates the synthesis of bonding bridges. Under heating conditions, the resin bridges release gases in proportion to the amount of curing agent present. Hence, the combination of resin inkjet content and curing agent addition has the strongest influence on gas evolution. Adjusting the printed layer thickness indirectly changes the resin content within the sand mold, primarily affecting surface roughness and mechanical strength rather than directly altering the total gas-forming potential. Therefore, within the studied parameter range, the effect of layer thickness on gas evolution is relatively small.
Process Parameter Optimization and Performance Prediction
In actual production, the quality and properties of the sand mold play a critical role in determining the final quality of the castings. An ideal 3D sand printing process should yield a mold that simultaneously satisfies high tensile strength and low gas evolution while also minimizing raw material consumption and maximizing printing efficiency. Based on the response surface analysis, we utilized the numerical optimization function of the Design-Expert software to optimize the process parameters and predict the corresponding response values. The optimization criteria were set to maximize tensile strength and minimize gas evolution within the tested ranges. The optimization results are presented in Table 8.
Table 8. Optimization comparison and validation results
| Parameter | Pre-optimization | Post-optimization | Measured value |
| Resin inkjet content/% | 1.530 | 1.445 | 1.440 |
| Curing agent addition/% | 0.300 | 0.214 | 0.210 |
| Layer thickness/mm | 0.250 | 0.306 | 0.300 |
| Tensile strength/MPa | 2.28 | 2.10 | 2.14 |
| Gas evolution/(mL·g-1) | 10.10 | 9.00 | 8.92 |
Although the tensile strength of the pre-optimized process was slightly higher than the post-optimized process, the optimized parameters were still more favorable for production for several reasons. First, the raw material consumption was reduced: the furan resin content decreased by 5.88% and the curing agent content was reduced by 30%. Second, the layer thickness increased by 0.05 mm, which translates to a 16.7% improvement in printing efficiency. Finally, the gas evolution was also reduced, which is beneficial for minimizing casting defects such as blowholes. For practical convenience, we adjusted the optimized parameters to closely attainable values: resin inkjet content of 1.44%, curing agent addition of 0.21%, and printed layer thickness of 0.30 mm. Under these conditions, we printed the “Figure-8” test specimens to validate the predicted performance. The measured tensile strength was 2.14 MPa and the gas evolution was 8.92 mL/g, which are in excellent agreement with the predicted values. This confirms that the Box-Behnken response surface methodology effectively optimizes the 3D sand printing forming process.
Furthermore, our process offers economic and production advantages over traditional optimization methods. The Box-Behnken design allowed us to reduce the number of experimental runs by approximately 37% compared to conventional full factorial designs, thus shortening the development cycle and decreasing material usage. At the same time, the optimized layer thickness and reduced binder consumption contribute to cost savings in industrial-scale production.
Verification via Low-Pressure Casting of a Thin-Walled Impeller
To validate the rationality and practicality of the optimized 3D sand printing forming process, we selected a thin-walled impeller casting as the verification component. The overall outline dimensions of this impeller were 318 mm × 318 mm × 124 mm, with a maximum wall thickness of 44.5 mm and a minimum wall thickness of only 1.2 mm, resulting in a highly uneven wall thickness distribution. Sixteen sets of blades were arranged around the center, forming a complex internal cavity, rendering the overall structure quite intricate. The casting mass was 6.3 kg and the material was ZL101A aluminum alloy. Considering the structural complexity and material characteristics, we chose sand mold low-pressure casting as the forming process. The gating system was designed as an open-type configuration with a cross-sectional area ratio of the sprue, runner, and ingate as ΣAdirect : ΣAhorizontal : ΣAinternal = 1.0 : 2.1 : 2.3.
The casting design incorporated a central sprue with a diameter of 40 mm. The top of the sprue connected to the stepped internal ingates was enlarged, and the feeding distance among the sprue columns was set to 167 mm to enhance the venting and feeding capabilities at the flange surface. Chills were placed on the side walls of the top and bottom sections of the casting to accelerate the solidification rate at the thicker sections, promote directional solidification, and reduce the risk of concentrated shrinkage porosity. A filter was positioned at the bottom of the sprue to stabilize the melt flow velocity, effectively removing harmful inclusions and improving the overall casting quality.
The core system for the impeller was designed as an integral structure via 3D sand printing. The sand core achieved dimensional accuracy controlled within ±0.015%. During handling, core assembly, and pouring operations, no core breakage or structural failure was observed. Owing to the significant wall thickness variations in the impeller casting, we pre-heated the sand core by torch firing before pouring. The pouring temperature was set at approximately 745 °C, and the holding pressure was 38 kPa. These conditions facilitated improved feeding of the thin-walled regions and ensured complete filling of the mold cavity.
After pouring and subsequent fettling, the trial-produced impeller casting exhibited a clean surface finish and complete blade profiles. X-ray inspection confirmed that no shrinkage porosity or gas hole defects were present in the critical areas of the casting. The dimensional accuracy of the non-machined surfaces was controlled within ±0.9 mm, meeting the DCTG6 dimensional tolerance requirements. This practical trial production conclusively demonstrated that the optimized 3D sand printing forming process produces high-quality sand molds that are fully capable of manufacturing complex thin-walled castings with excellent surface quality and internal integrity. The successful trial also confirms that the response surface methodology is a powerful and reliable tool for the rational design and optimization of 3D sand printing processes, providing a robust scientific foundation for the production of similar complex components in the foundry industry.
Conclusions
From this comprehensive investigation, we have drawn several important conclusions. First, the response surface optimization experiments clearly revealed that resin inkjet content is the most significant factor affecting both the tensile strength and gas evolution of printed sand molds. As resin inkjet content increased, both tensile strength and gas evolution increased rapidly. Under the interactive conditions of the studied parameters, the interaction between resin inkjet content and layer thickness was most significant for tensile strength, while the interaction between resin inkjet content and curing agent addition was most significant for gas evolution. Second, the Box-Behnken response surface method proved to be an efficient and effective approach for optimizing the 3D sand printing forming process. Compared to traditional orthogonal experimental designs, the BBD approach reduced the number of experimental runs by approximately 37%, thereby shortening the test cycle and lowering material costs. Additionally, the optimized process parameters reduced the consumption of furan resin by 5.88% and curing agent by 30% while increasing the layer thickness by 0.05 mm, which translated to a 16.7% improvement in printing efficiency. The final adjusted and validated process parameters were a resin inkjet content of 1.44%, a curing agent addition of 0.21%, and a printed layer thickness of 0.30 mm, yielding a tensile strength of 2.14 MPa and a gas evolution of 8.92 mL/g, values that fully satisfy the performance requirements for the foundry sand mold. Third, the low-pressure casting trial of the thin-walled impeller casting verified the practical feasibility and rationality of the optimized 3D sand printing forming process. The resulting castings exhibited smooth surface roughness, complete and clear blade contours, no shrinkage or gas hole defects in critical positions as confirmed by X-ray inspection, and dimensional accuracy within the allowable tolerances. This successful implementation underscores the great potential of combining 3D sand printing with response surface optimization for the high-quality, cost-effective production of complex thin-walled metal components.