
I treat sand mold casting as a representative traditional manufacturing process that converts energy, metallic charge materials, molding materials, and human labor into functional metal components. In my research, I focus on the process design stage because decisions made at this stage determine not only whether a casting can be produced without defects, but also how much carbon emission, production time, and resource cost will be generated in the subsequent sand mold casting process. I classify the design features that affect casting quality, resource consumption, and environmental impact, and I build a carbon benefit model that combines carbon emission, production time, and resource cost. Using this model, I optimize the parameters associated with casting geometry features and pouring features. The objective is to improve the comprehensive carbon benefit of sand mold casting while satisfying casting quality constraints.
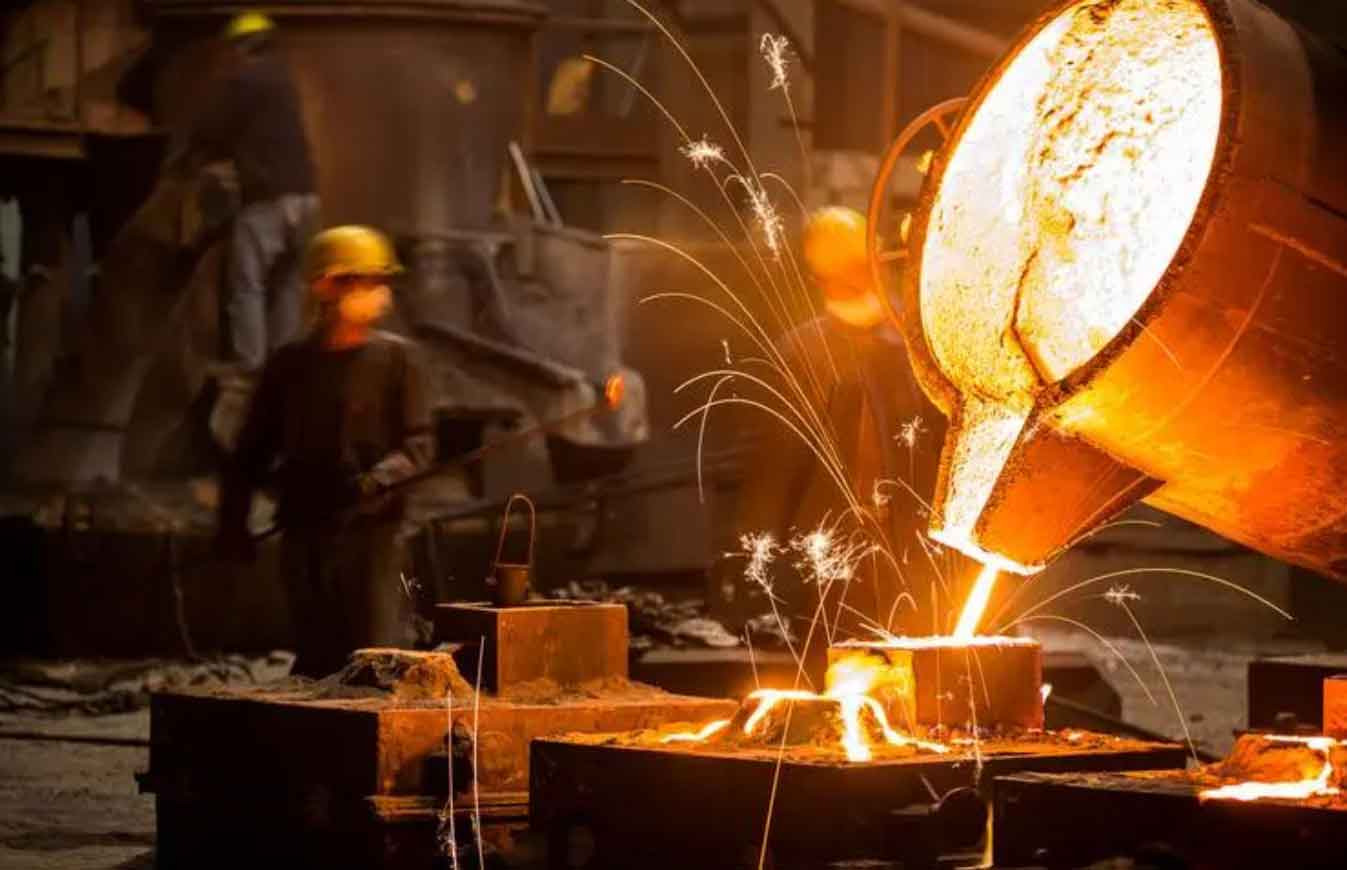
Background and Motivation
Traditional manufacturing industries provide substantial economic and social value, but they also consume large amounts of energy and resources. Industrial energy consumption continues to rise, and manufacturing activities are a major contributor to greenhouse gas emissions. Sand mold casting is especially energy-intensive because it involves melting, alloying, molding, core making, sand preparation, pouring, cooling, shakeout, cleaning, heat treatment, and inspection. In many sand mold casting plants, energy utilization is relatively low, resource consumption is high, and the environmental burden is significant. Therefore, reducing carbon emission and improving resource efficiency in sand mold casting are important for sustainable development.
I observe that sand mold casting has several characteristics that make low-carbon design challenging. First, the process chain is discrete and contains many parallel and serial operations. Second, the quality of the final casting is strongly affected by process design parameters such as pouring temperature, pouring time, gating system dimensions, riser type, machining allowance, and core design. Third, carbon emission, production time, and resource cost are not always consistent with each other. A design that reduces carbon emission may increase cost, and a design that shortens production time may increase material consumption. Thus, I need a combined evaluation model rather than a single indicator.
In my study, I propose that the design feature of a sand mold casting should be treated as the bridge between product requirements and process behavior. The feature determines which process parameters can be adjusted, which resources are consumed, and which carbon sources are activated. I therefore develop a carbon benefit model for sand mold casting that can be used to evaluate and optimize process design schemes.
Related Work and Research Gap
Previous studies on sustainable manufacturing have proposed energy indicators, energy benchmarks, life cycle assessment, lean energy-saving strategies, and multi-objective optimization models. These studies show that process parameters can significantly affect energy consumption and environmental impact. In machining, for example, cutting speed, feed rate, tool path, and feature sequence have been optimized to reduce energy consumption and carbon emission. In casting, researchers have studied defect reduction, scheduling optimization, energy management, and carbon emission calculation. Some studies have established carbon emission models for sand mold casting and have used process design parameters to reduce carbon emission.
However, I find several gaps. Many existing methods focus on a single objective, such as carbon emission, cost, or production time. They do not always consider the trade-offs among carbon emission, efficiency, and economic cost. In addition, the relationship between casting process design features and the subsequent process chain is not fully quantified. The design feature of a sand mold casting is not only a geometric attribute; it also determines process routes, material input, energy demand, and defect risk. Therefore, I develop a feature-based carbon benefit model for sand mold casting and use it to optimize feature-associated parameters.
Process Analysis of Sand Mold Casting
I analyze sand mold casting as a sequence of manufacturing stages. The main stages include melting, alloying, molding, core making, sand preparation, pouring, cooling, shakeout, cleaning, heat treatment, machining, and inspection. Each stage consumes energy and materials and generates emissions or waste. The process design stage determines the type of mold, the gating system, the riser system, the core arrangement, the machining allowance, and the pouring parameters. These decisions affect the entire sand mold casting process.
I describe the sand mold casting process as a flow of material and energy. Metallic charge materials, alloying elements, molding sand, binder, coating, water, compressed air, and electricity enter the system. The system produces finished castings, returned sand, scrap, waste gas, dust, and carbon dioxide. The design feature of the sand mold casting influences how these flows are distributed. For example, changing the hole-making method from machining to core forming changes the mold structure, the core-making process, the amount of metal poured, and the cleaning operation.
Classification of Sand Mold Casting Process Design Features
I classify the process design features of sand mold casting into three categories: casting material features, casting geometry structure features, and pouring features. This classification helps me identify the associated process parameters and quantify their effects.
| Feature category | Definition | Typical examples | Main affected indicators |
|---|---|---|---|
| Casting material feature, \(CF\) | Features related to material properties in sand mold casting | Molding sand type, sand heat storage coefficient, alloy type, binder ratio, coating type | Carbon emission, pouring temperature, pouring time, sand consumption, waste sand |
| Casting geometry structure feature, \(HF\) | Features related to the geometry of the casting and mold | Wall thickness, cast hole, fillet, groove, rib, mold wall thickness, core number | Machining allowance, minimum cast hole, core design, metal charge, molding time |
| Pouring feature, \(ZF\) | Features related to gating and feeding systems | Runner type, runner number, runner size, riser type, riser number, riser size | Pouring time, pouring temperature, filling velocity, yield, defect risk |
I define the casting material feature as \(CF\). It includes the material attributes that determine thermal behavior, chemical reactions, and resource consumption. I define the casting geometry structure feature as \(HF\). It includes the geometric attributes of the casting and the mold that influence molding, core making, and machining. I define the pouring feature as \(ZF\). It includes the design of the gating system and feeding system that controls metal flow and solidification.
Impact Mechanism of Feature-Associated Parameters
I study how feature-associated parameters affect the sand mold casting process. The selection of molding sand affects sand density, heat storage, gas evolution, and mold strength. These factors influence pouring time and pouring temperature. The selection of alloy affects fluidity, shrinkage, and solidification range. The geometry of the casting affects machining allowance, minimum cast hole size, draft angle, and core design. The pouring system affects filling velocity, turbulence, slag entrapment, and shrinkage porosity.
| Feature | Associated parameter | Impact mechanism in sand mold casting |
|---|---|---|
| Material feature | Molding sand type, binder ratio | Changes mold strength, gas evolution, heat storage, sand reuse rate, and waste sand generation |
| Material feature | Alloy type | Changes melting energy, pouring temperature range, shrinkage behavior, and defect sensitivity |
| Geometry feature | Machining allowance | Changes casting net weight, metal charge, machining time, and scrap generation |
| Geometry feature | Minimum cast hole | Determines whether a hole is formed by core or by machining, affecting core making, drilling, and metal usage |
| Geometry feature | Draft angle, fillet, rib | Affects mold filling, pattern removal, stress concentration, and cleaning effort |
| Pouring feature | Pouring temperature | Affects fluidity, shrinkage porosity, gas absorption, and melting energy |
| Pouring feature | Pouring time | Affects filling velocity, turbulence, cold shut, slag inclusion, and mold erosion |
| Pouring feature | Gating ratio, riser size | Affects yield, feeding efficiency, metal charge, and solidification defect formation |
In sand mold casting, the pouring time can be estimated by an empirical relationship:
$$\tau = S_1 \sqrt{m}$$
where \(\tau\) is the pouring time, \(S_1\) is a coefficient related to wall thickness, and \(m\) is the total mass of the poured metal. This relationship shows that the pouring feature is coupled with the geometry feature because the total mass depends on the casting, gating system, and riser system. When I optimize a sand mold casting design, I must therefore consider the coupling among features.
Carbon Benefit Model for Sand Mold Casting
I build a carbon benefit model for sand mold casting with three components: carbon emission, production time, and resource cost. The model evaluates a process design scheme from environmental, efficiency, and economic perspectives. I use feature-associated parameters to calculate each component.
Carbon Emission Model
I divide the total carbon emission of sand mold casting into energy carbon emission, material carbon emission, and process carbon emission. The total carbon emission is:
$$C_{Total}=C_N+C_M+C_P$$
where \(C_{Total}\) is the total carbon emission, \(C_N\) is the energy carbon emission, \(C_M\) is the material carbon emission, and \(C_P\) is the process carbon emission. I further relate each carbon source to the three feature categories:
$$C_N=\sum_{i=1}^{u} m(a_i^{CF}) EF_i + \sum_{j=1}^{v} m(a_j^{HF}) EF_j + \sum_{k=1}^{w} m(a_k^{ZF}) EF_k$$
In this equation, \(m(a_i^{CF})\) is the consumption of energy associated with the \(i\)-th casting material feature, and \(EF_i\) is its carbon emission factor. The terms for \(HF\) and \(ZF\) follow the same logic.
For material carbon emission, I use:
$$C_M=\sum_{r=1}^{o} m(b_r^{CF}) f_r + \sum_{s=1}^{p} m(b_s^{HF}) f_s + \sum_{t=1}^{q} m(b_t^{ZF}) f_t$$
Here, \(m(b_r^{CF})\) is the consumption of material associated with the \(r\)-th casting material feature, and \(f_r\) is its carbon emission factor. Material carbon emission is often the largest part in sand mold casting because metallic charge materials such as pig iron and steel scrap have high emission factors.
For process carbon emission, I use:
$$C_P=\sum_{d=1}^{x} V(c_d^{CF}) a_d + \sum_{e=1}^{y} V(c_e^{HF}) a_e + \sum_{f=1}^{z} V(c_f^{ZF}) a_f$$
where \(V(c_d^{CF})\) is the amount of gas generated by a chemical reaction associated with the \(d\)-th casting material feature, and \(a_d\) is its carbon emission factor. Process carbon emission mainly comes from chemical reactions in melting, slag formation, and binder decomposition.
To compare different energy types, I convert them into standard coal equivalent:
$$m(A)=a_A \cdot e_A$$
where \(m(A)\) is the mass of standard coal equivalent for energy \(A\), \(a_A\) is the physical amount of energy \(A\), and \(e_A\) is its conversion coefficient.
Production Time Model
I model production time from the sand preparation stage to the inspection stage. When several machines operate in parallel, I use the longest operation time in the stage. The total production time is:
$$PT_{Total}=\sum_{i’=1}^{m}\sum_{j’=1}^{n} \left[\bar{t}_{CF}^{i’j’}(N)+\bar{t}_{HF}^{i’j’}(N)+\bar{t}_{ZF}^{i’j’}(N)\right] + \sum_{i’=1}^{m}\sum_{k’=1}^{n’} \left[t_{CF}^{i’k’}(N)+t_{HF}^{i’k’}(N)+t_{ZF}^{i’k’}(N)\right]$$
where \(\bar{t}\) represents the average processing time of the main equipment, \(t\) represents auxiliary time such as loading, unloading, and transportation, and \(N\) is the production batch. Feature-associated parameters change both main and auxiliary times. For example, a cast hole formed by a core may shorten machining time but add core-making time. A larger machining allowance may increase metal melting time and machining time.
Resource Cost Model
I divide resource cost into energy cost, material cost, labor cost, and remaining cost:
$$RC_{Total}=RC_{energy}+RC_{material}+RC_{labor}+RC_{rest}$$
Each cost category is further related to the three feature categories:
$$RC_X=RC(d^{CF})+RC(d^{HF})+RC(d^{ZF}),\quad X\in\{\text{energy},\text{material},\text{labor},\text{rest}\}$$
Energy cost mainly comes from electricity, coke, and fuel. Material cost includes pig iron, steel scrap, returned iron, molding sand, binder, coating, and water. Labor cost is calculated from working hours. Remaining cost includes scrap loss, equipment depreciation, pattern cost, and sand box cost. The resource cost model allows me to compare process design schemes in economic terms.
Carbon Benefit Formulation
I combine the three models into a carbon benefit index:
$$TC=\alpha \cdot C_{Total}+\beta \cdot PT_{Total}+\mu \cdot RC_{Total}$$
where \(TC\) is the carbon benefit of the process design scheme, \(\alpha\) is the weight of carbon emission, \(\beta\) is the weight of production time, and \(\mu\) is the weight of resource cost. A lower \(TC\) indicates a better carbon benefit. The weights reflect the production priorities of a sand mold casting enterprise. If environmental performance is the main priority, \(\alpha\) can be increased. If delivery time is critical, \(\beta\) can be increased. If cost control is critical, \(\mu\) can be increased.
Parameter Optimization for Sand Mold Casting
I optimize the parameters associated with casting geometry features and pouring features. I keep casting material features relatively fixed because they are often determined by the application, alloy specification, and available sand mold casting process. The optimization variables include machining allowance, minimum cast hole diameter, core diameter, core length, core number, pouring time, pouring temperature, gating ratio, riser type, and riser size.
| Feature category | Optimization variable | Typical range or selection basis | Main objective |
|---|---|---|---|
| Geometry feature | Machining allowance | Based on maximum casting size and molding method | Reduce metal charge and machining time |
| Geometry feature | Cast hole diameter and depth | Based on minimum cast hole table and production batch | Replace drilling with core forming when beneficial |
| Geometry feature | Core diameter and length | Based on hole size and core strength | Ensure hole quality and reduce sand consumption |
| Pouring feature | Pouring temperature | Based on alloy type and main wall thickness | Avoid shrinkage and reduce melting energy |
| Pouring feature | Pouring time | Based on empirical formula and simulation | Avoid turbulence and cold shut |
| Pouring feature | Gating ratio | Based on gating system type and casting size | Improve yield and filling stability |
| Pouring feature | Riser type and size | Based on feeding distance and shrinkage demand | Eliminate internal defects with minimum metal |
I formulate the optimization problem as:
$$\min TC=\alpha \cdot C_{Total}+\beta \cdot PT_{Total}+\mu \cdot RC_{Total}$$
subject to:
$$
\begin{aligned}
R_1 &= \{X \mid g_i(X) \leq K_1\} \\
R_2 &= \{X \mid m_i(X) \leq K_2\} \\
T_{min} &\leq T \leq T_{max} \\
V_{min} &\leq V \leq V_{max} \\
cond_1, \ldots, cond_m &\mid b_{min} \leq V \leq cond_1, \ldots, cond_m \mid b_{max}
\end{aligned}
$$
where \(K_1\) is the allowable total shrinkage porosity, \(K_2\) is the allowable voidage, \(T\) is pouring temperature, \(V\) is filling velocity, and \(cond_1,\ldots,cond_m\) represent process conditions such as wall thickness, gating system size, and molding method. I use casting simulation to verify quality constraints before calculating carbon benefit.
Optimization Procedure
I follow a systematic procedure for parameter optimization in sand mold casting.
| Step | Action | Output |
|---|---|---|
| 1 | Select feature-associated parameters and determine initial values using standards and tables | Initial process design scheme |
| 2 | Build the initial scheme and verify casting quality by simulation | Shrinkage porosity and voidage results |
| 3 | Calculate carbon emission, production time, and resource cost | Carbon benefit of the initial scheme |
| 4 | Adjust feature-associated parameters and generate optimized schemes | Candidate schemes |
| 5 | Repeat quality verification and carbon benefit calculation | Comparison of all schemes |
| 6 | Select the scheme with the best carbon benefit while satisfying quality constraints | Optimized sand mold casting process design |
Case Study I: Geometry Feature of a Disk Casting
I conduct the first case study on a disk-like casting. The casting material is gray cast iron. The casting has three holes with a diameter of 45 mm. The quality of these holes is important. I compare three process design schemes. In scheme FE1, the holes are produced by machining. In scheme FE2, the holes are produced by sand cores. In scheme FE3, the sand-core hole-making scheme is further optimized by changing the hole machining allowance and core diameter. I use casting simulation to verify that all feasible schemes satisfy the quality constraints.
| Scheme | Process route |
|---|---|
| FE1 | Sand mixing, core making, molding, flow coating and drying, core setting, mold closing, pouring, cooling, shakeout, heat treatment, grinding, inspection |
| FE2 | Sand mixing, molding, flow coating and drying, mold closing, pouring, cooling, shakeout, heat treatment, drilling, grinding, inspection |
| FE3 | Sand mixing, core making for holes, molding, flow coating and drying, core setting, mold closing, pouring, cooling, shakeout, heat treatment, grinding, inspection |
The initial process parameters are listed below.
| Parameter | FE1 | FE2 | FE3 |
|---|---|---|---|
| Draft angle (°) | 1.6 | 1.6 | 1.6 |
| Pouring temperature (°C) | 1420 | 1420 | 1420 |
| Sand gas evolution (ml/g) | 15.5 | 15.5 | 15.5 |
| Pouring time (s) | 6 | 6 | 6 |
| Cooling time (h) | 24 | 24 | 24 |
| Surface machining allowance (mm) | 2.5 | 2.5 | 2.5 |
| Hole machining allowance (mm) | 0 | 1.5 | 2.5 |
| Core diameter (mm) | 0 | 42 | 40 |
I calculate the carbon emission for the three schemes. The results show that material carbon emission is the largest component, followed by energy carbon emission. Steel scrap and pig iron are the main contributors. The sand-core schemes reduce the amount of metal that must be melted because the holes are not drilled from solid metal. FE3 reduces carbon emission further by optimizing the hole machining allowance and core diameter.
| Carbon source | FE1 | FE2 | FE3 |
|---|---|---|---|
| Pig iron | 646.405 | 634.038 | 633.941 |
| Steel scrap | 4244.098 | 4162.904 | 4162.160 |
| Molding sand | 154.063 | 156.142 | 155.839 |
| Steel shot | 15.798 | 15.948 | 15.918 |
| Water | 0.349 | 0.349 | 0.349 |
| Auxiliary material | 81.396 | 89.942 | 81.239 |
| Coating | 90.902 | 91.752 | 91.603 |
| Alcohol | 3.390 | 3.390 | 3.390 |
| Natural gas | 34.880 | 34.880 | 34.880 |
| Coke | 195.250 | 191.515 | 194.442 |
| Main equipment electricity | 397.351 | 377.391 | 387.670 |
| Melting energy | 1043.876 | 1023.905 | 1025.941 |
| Core making, core setting, drying | 0 | 39.982 | 27.188 |
| Machining energy | 20.9 | 2.3 | 4.8 |
| Process carbon emission | 24.699 | 25.150 | 25.024 |
The total carbon emission comparison shows that FE3 has the lowest carbon emission. FE2 reduces carbon emission compared with FE1, and FE3 reduces carbon emission further. This result indicates that in sand mold casting, changing the hole-making method from machining to core forming can reduce the metal charge and melting energy. Optimizing the core diameter and machining allowance can improve the carbon benefit even when the same process route is used.
| Scheme | Total carbon emission | Relative comparison |
|---|---|---|
| FE1 | Highest | Baseline |
| FE2 | Lower than FE1 | Reduced by about 1.229% compared with FE1 in the optimized stage |
| FE3 | Lowest | Reduced by about 1.470% compared with FE1 |
I also calculate production time. FE1 requires drilling after shakeout, which increases cleaning-stage time. FE2 and FE3 use core making to form the holes, which shifts the time from cleaning to core making. The total production time of FE2 and FE3 is shorter than that of FE1. FE3 has the shortest production time among the three schemes.
| Scheme | Production time characteristic | Result |
|---|---|---|
| FE1 | Longer cleaning stage due to drilling | Highest total production time |
| FE2 | Core making added but drilling reduced | Lower than FE1 |
| FE3 | Optimized core parameters and fewer cleaning operations | Lowest total production time |
For resource cost, FE1 has high material cost because more metal must be melted. FE1 also has high labor cost because drilling requires additional workers and time. FE2 and FE3 reduce material cost and labor cost. FE3 achieves the lowest resource cost after parameter optimization. The remaining cost includes pattern and tooling cost. In small-batch sand mold casting, the pattern cost can be significant, so process designers should consider the production batch when selecting the tooling method.
| Cost category | FE1 | FE2 | FE3 |
|---|---|---|---|
| Material cost | High | Medium | Low |
| Energy cost | High | Medium | Low |
| Labor cost | High | Medium | Low |
| Remaining cost | High | Medium | Low |
The carbon benefit values are calculated with weights \(\alpha=0.45\), \(\beta=0.78\), and \(\mu=0.62\). FE1 has the highest carbon benefit value, FE2 has a lower value, and FE3 has the lowest value. Since a lower carbon benefit value means better comprehensive performance, FE3 is the best scheme for the disk casting geometry feature.
| Scheme | Carbon benefit | Interpretation |
|---|---|---|
| FE1 | 12012.703 | Machined holes, highest value |
| FE2 | 10548.009 | Sand-core holes, improved |
| FE3 | 10503.226 | Optimized sand-core holes, best |
This case study confirms that the casting geometry structure feature of a sand mold casting has a strong influence on carbon emission, production time, and resource cost. By changing the hole-making method and optimizing the associated core and allowance parameters, I can improve the carbon benefit of sand mold casting without sacrificing casting quality.
Case Study II: Pouring Feature of a Base Casting
I conduct the second case study on a base casting used for road facilities. The casting material is gray cast iron. The casting is a small-to-medium sand mold casting. The initial scheme FE1 uses a semi-closed gating system without a riser. The gating ratio is designed as \(1.256:1.4:1\). The initial pouring temperature is 1420 °C, and the pouring time is 8 s. Simulation shows that internal shrinkage defects occur. These defects would reduce service performance and require additional repair or machining, which would increase carbon emission and cost.
| Parameter | FE1 | FE2 | FE3 |
|---|---|---|---|
| Draft angle (°) | 0.4 | 0.4 | 0.4 |
| Sand gas evolution (ml/g) | 15.5 | 15.5 | 15.5 |
| Pouring temperature (°C) | 1420 | 1420 | 1400 |
| Pouring time (s) | 8 | 8 | 6 |
| Cooling time (h) | 24 | 24 | 24 |
| Machining allowance (mm) | 2 | 2 | 2 |
| Gating ratio | 1.256:1.4:1 | 1.256:1.4:1 | 1.256:1.3:1 |
| Gating system mass (kg) | 5.727 | 5.727 | 5.271 |
| Riser type | None | Neck-down riser | Pressure riser |
| Riser number | 0 | 1 | 1 |
| Riser mass (kg) | 0 | 0.193 | 1.521 |
| Total gating and riser mass (kg) | 5.727 | 5.920 | 6.792 |
To eliminate the internal defects, I add a neck-down riser in FE2. Simulation shows that the shrinkage porosity disappears, and the voidage is acceptable. However, the added riser increases the metal mass and therefore increases carbon emission in the melting stage. To improve the carbon benefit further, I optimize the pouring temperature, pouring time, gating ratio, and riser type in FE3. The optimized scheme uses a pressure riser with a different mass distribution and a lower pouring temperature.
| Material | FE1 | FE2 | FE3 |
|---|---|---|---|
| Pig iron (kg) | 11.0389 | 11.1150 | 11.0005 |
| Steel scrap (kg) | 37.6533 | 37.9127 | 37.5223 |
| Resin sand (kg) | 34.6344 | 33.6351 | 33.6620 |
| Coating (kg) | 0.9925 | 0.9520 | 0.9785 |
| Water (kg) | 0.3506 | 0.3531 | 0.3495 |
| Steel shot (kg) | 0.1020 | 0.1020 | 0.1020 |
I calculate carbon emission for the three schemes. The results show that FE2 has higher carbon emission than FE1 because the riser increases the melted metal mass. FE3 reduces carbon emission compared with FE2 by optimizing the pouring feature parameters. The main reduction comes from lower melting energy and lower metal charge. The process carbon emission also changes slightly because the slag reaction and binder decomposition depend on the pouring conditions.
| Carbon source | FE1 | FE2 | FE3 |
|---|---|---|---|
| Pig iron | 23.5129 | 23.6749 | 23.4311 |
| Steel scrap | 308.7569 | 310.8845 | 307.6829 |
| Molding sand | 8.8075 | 8.5534 | 8.5602 |
| Steel shot | 0.8364 | 0.8364 | 0.8364 |
| Water | 0.0004 | 0.0004 | 0.0004 |
| Auxiliary material | 3.2561 | 3.2528 | 3.2552 |
| Coating | 5.9780 | 5.7341 | 5.8937 |
| Alcohol | 1.3265 | 1.3379 | 1.3227 |
| Coke | 3.5168 | 3.5410 | 3.5045 |
| Total electricity | 40.0828 | 45.3363 | 39.8064 |
| Process carbon emission | 1.2330 | 1.1280 | 1.2160 |
The total carbon emission of FE3 is lower than that of FE2 by about 0.981%. This reduction is achieved even though FE3 still uses a riser, because the riser and gating system are optimized. The result confirms that the pouring feature is critical in sand mold casting. A larger riser can eliminate shrinkage defects but may increase carbon emission. A well-designed riser and gating system can maintain quality while reducing metal charge.
| Scheme | Total carbon emission | Quality result |
|---|---|---|
| FE1 | Lower than FE2 but with defects | Internal shrinkage porosity |
| FE2 | Higher than FE1 | Defects eliminated by riser |
| FE3 | Lower than FE2 | Defects eliminated and carbon emission reduced |
I also compare production time. FE2 has a longer production time than FE1 because of the additional riser and metal handling. FE3 has the shortest production time among the three schemes because the pouring time and gating system are optimized. The cleaning stage is also reduced because the optimized process produces fewer defects and less need for repair.
| Scheme | Production time characteristic | Result |
|---|---|---|
| FE1 | No riser but defects require additional handling | Medium |
| FE2 | Riser added, more metal handling | Longer |
| FE3 | Optimized pouring and gating | Shortest |
For resource cost, I consider material cost, energy cost, labor cost, and remaining cost. FE2 has the highest cost because of the additional riser and higher metal charge. FE3 reduces the cost by optimizing the pouring feature parameters. The labor cost is calculated from a fixed staffing arrangement. The remaining cost mainly includes the pattern and tooling cost. FE3 achieves the lowest resource cost among the three schemes.
| Staffing category | Operation | Number of workers |
|---|---|---|
| Melting department | Melting | 2 |
| Molding department | Jolt-squeeze molding | 1 |
| Molding department | Pattern removal | 2 |
| Molding department | Flow coating | 1 |
| Molding department | Pouring | 3 |
| Sand preparation department | Sand mixing | 2 |
| Sand preparation department | Shakeout | 2 |
| Sand preparation department | Old sand treatment | 2 |
| Cleaning department | Gating and riser removal | 1 |
| Cleaning department | Machining | 1 |
| Cleaning department | Shot blasting | 1 |
| Scheme | Resource cost comparison |
|---|---|
| FE1 | Baseline |
| FE2 | Higher than FE1 |
| FE3 | Lower than FE2 by about 1.384% |
The carbon benefit values for the base casting are calculated with the same weights. FE1 has a carbon benefit of 314.498, FE2 has a carbon benefit of 317.500, and FE3 has a carbon benefit of 313.211. Since lower values are better, FE3 achieves the best carbon benefit. This result shows that adding a riser can solve a quality problem, but it may not be the best final solution. By optimizing the pouring feature parameters, I can maintain quality and improve the comprehensive carbon benefit.
| Scheme | Carbon benefit | Interpretation |
|---|---|---|
| FE1 | 314.498 | Initial scheme with defects |
| FE2 | 317.500 | Quality improved but carbon benefit worse |
| FE3 | 313.211 | Quality satisfied and best carbon benefit |
Discussion
The two case studies show that the feature-based carbon benefit model can be used to evaluate sand mold casting process designs in a systematic way. In the disk casting case, the geometry feature determines whether holes are formed by machining or by cores. This decision changes metal charge, melting energy, core making, drilling, and cleaning. In the base casting case, the pouring feature determines whether internal defects occur and how much riser metal is needed. This decision changes yield, melting energy, and production time.
I find that carbon emission, production time, and resource cost often have different responses to parameter changes. A process design that reduces carbon emission may increase production time if it adds core making. A process design that eliminates defects may increase carbon emission if it adds a large riser. Therefore, the carbon benefit model is useful because it balances these effects. The weighting factors can be adjusted according to enterprise priorities. If a sand mold casting plant focuses on low carbon emission, the weight \(\alpha\) can be increased. If the plant focuses on fast delivery, the weight \(\beta\) can be increased. If the plant focuses on cost reduction, the weight \(\mu\) can be increased.
I also observe that material carbon emission is usually the largest source in sand mold casting. Pig iron and steel scrap dominate the carbon emission inventory. Reducing the metal charge is therefore a powerful way to improve carbon benefit. This can be achieved by optimizing the casting geometry feature, such as reducing machining allowance and using cores for holes. It can also be achieved by optimizing the pouring feature, such as designing a more efficient riser and gating system. Energy carbon emission is the second largest source. Melting energy is the main contributor. Reducing pouring temperature and avoiding excessive superheat can reduce melting energy. Process carbon emission is relatively small but still important because it is directly related to chemical reactions and binder decomposition.
Production time is influenced by the process route. Machining operations in the cleaning stage can be time-consuming. Core making can add time in the molding stage but can reduce cleaning time. The net effect depends on the batch size, equipment capacity, and labor arrangement. In my case studies, the optimized schemes reduce total production time because they avoid unnecessary operations and reduce defect repair. Resource cost follows a similar pattern. Material cost and labor cost are sensitive to the process route. Energy cost is sensitive to melting and heat treatment. Remaining cost is sensitive to tooling and pattern selection.
Implications for Sand Mold Casting Practice
I suggest that sand mold casting enterprises can apply the proposed method in the following ways. First, they can build a feature library for their common castings. The feature library should include material features, geometry features, and pouring features. Second, they can associate each feature with process parameters and resource consumption data. Third, they can use casting simulation to verify quality constraints before physical production. Fourth, they can calculate carbon benefit for alternative process designs and select the best one. Fifth, they can continuously update the model with actual production data to improve accuracy.
| Practical action | Expected benefit |
|---|---|
| Build a feature library for sand mold casting | Standardize process design knowledge |
| Link features with carbon emission and cost data | Enable quantitative evaluation |
| Use simulation for quality verification | Reduce trial-and-error experiments |
| Apply carbon benefit optimization | Balance environment, efficiency, and cost |
| Update the model with production data | Improve decision accuracy |
Limitations and Future Work
I acknowledge that my study has limitations. The carbon benefit model depends on the accuracy of carbon emission factors, energy consumption data, and production time data. In actual sand mold casting plants, these data may vary with equipment condition, operator skill, and batch size. The model also simplifies some dynamic interactions in the process. For example, the relationship between pouring temperature and defect formation is nonlinear and may require more detailed simulation or experimental validation. In addition, the case studies focus on specific geometry and pouring features. More case studies are needed to generalize the conclusions.
In future work, I plan to extend the model in several directions. First, I will include more feature categories, such as mold feature and heat treatment feature. Second, I will consider new manufacturing technologies such as additive manufacturing for sand molds and cores. Third, I will integrate real-time production data and machine learning to improve parameter estimation. Fourth, I will apply the carbon benefit model to other manufacturing processes, such as machining, forging, and welding. Fifth, I will develop a decision support system that can recommend the best process design scheme for a given casting and production condition.
Conclusion
I develop a carbon benefit model for sand mold casting based on process design features. I classify the design features into casting material features, casting geometry structure features, and pouring features. I establish quantitative models for carbon emission, production time, and resource cost. I propose an optimization method that uses carbon benefit as the objective and uses feature-associated parameters as decision variables. I verify the method with two case studies: a disk casting for the geometry feature and a base casting for the pouring feature. The results show that optimizing the hole-making method, core parameters, pouring temperature, pouring time, gating ratio, and riser design can improve the comprehensive carbon benefit of sand mold casting while satisfying quality requirements.
The main contribution of my work is that I connect process design features with carbon emission, production time, and resource cost in sand mold casting. This connection allows process designers to evaluate the consequences of design decisions before production. The carbon benefit model can help sand mold casting enterprises reduce environmental impact, improve resource efficiency, and lower production cost. I believe that feature-based carbon benefit modeling and parameter optimization will play an important role in the sustainable development of traditional manufacturing, especially in sand mold casting.
| Research element | Main outcome |
|---|---|
| Feature classification | Casting material feature, casting geometry structure feature, pouring feature |
| Carbon emission model | Energy carbon, material carbon, process carbon |
| Production time model | Main operation time and auxiliary time |
| Resource cost model | Energy cost, material cost, labor cost, remaining cost |
| Carbon benefit model | Weighted combination of carbon emission, production time, and resource cost |
| Optimization method | Parameter optimization under quality constraints |
| Case study I | Geometry feature optimization of a disk casting |
| Case study II | Pouring feature optimization of a base casting |
Overall, I conclude that carbon benefit modeling is a practical and effective approach for sand mold casting process design. It supports low-carbon decision-making, improves production efficiency, and reduces resource cost. By continuously refining the model and applying it to more sand mold casting cases, manufacturers can move toward more sustainable and competitive production.