
I studied the investment casting process design and parameter optimisation of a stainless steel pump body because this type of casting is used in demanding fluid-handling systems where pressure tightness, corrosion resistance, and dimensional accuracy are essential. In my work I treated the pump body as a high-integrity CF8 stainless steel casting weighing about 24.75 kg, with an overall envelope of approximately 304 mm by 246 mm by 165 mm, a maximum wall thickness of 30 mm, and a minimum wall thickness of 11 mm. The casting contains an inlet flange, an outlet flange, a mouth ring, pump feet, and internal passages, so the hot spots are not only large but also dispersed. I found that conventional process design often gives a low process yield, usually below 35%, and that shrinkage porosity, shrinkage cavities, mistuns, gas porosity, and slag inclusion are the main risks. Although lost foam castings can be attractive for complex geometries because they reduce core assembly and allow greater design freedom, I selected investment casting for this pump body because the surface finish, dimensional precision, and internal soundness required by the application are better suited to a ceramic shell process. In several comparisons I made during the study, lost foam castings were useful as a reference point, but lost foam castings did not provide the same level of confidence for thin internal passages and pressure-critical flange sections. I therefore focused my investigation on investment casting, numerical simulation, modulus-based feed design, and design-of-experiments optimisation.
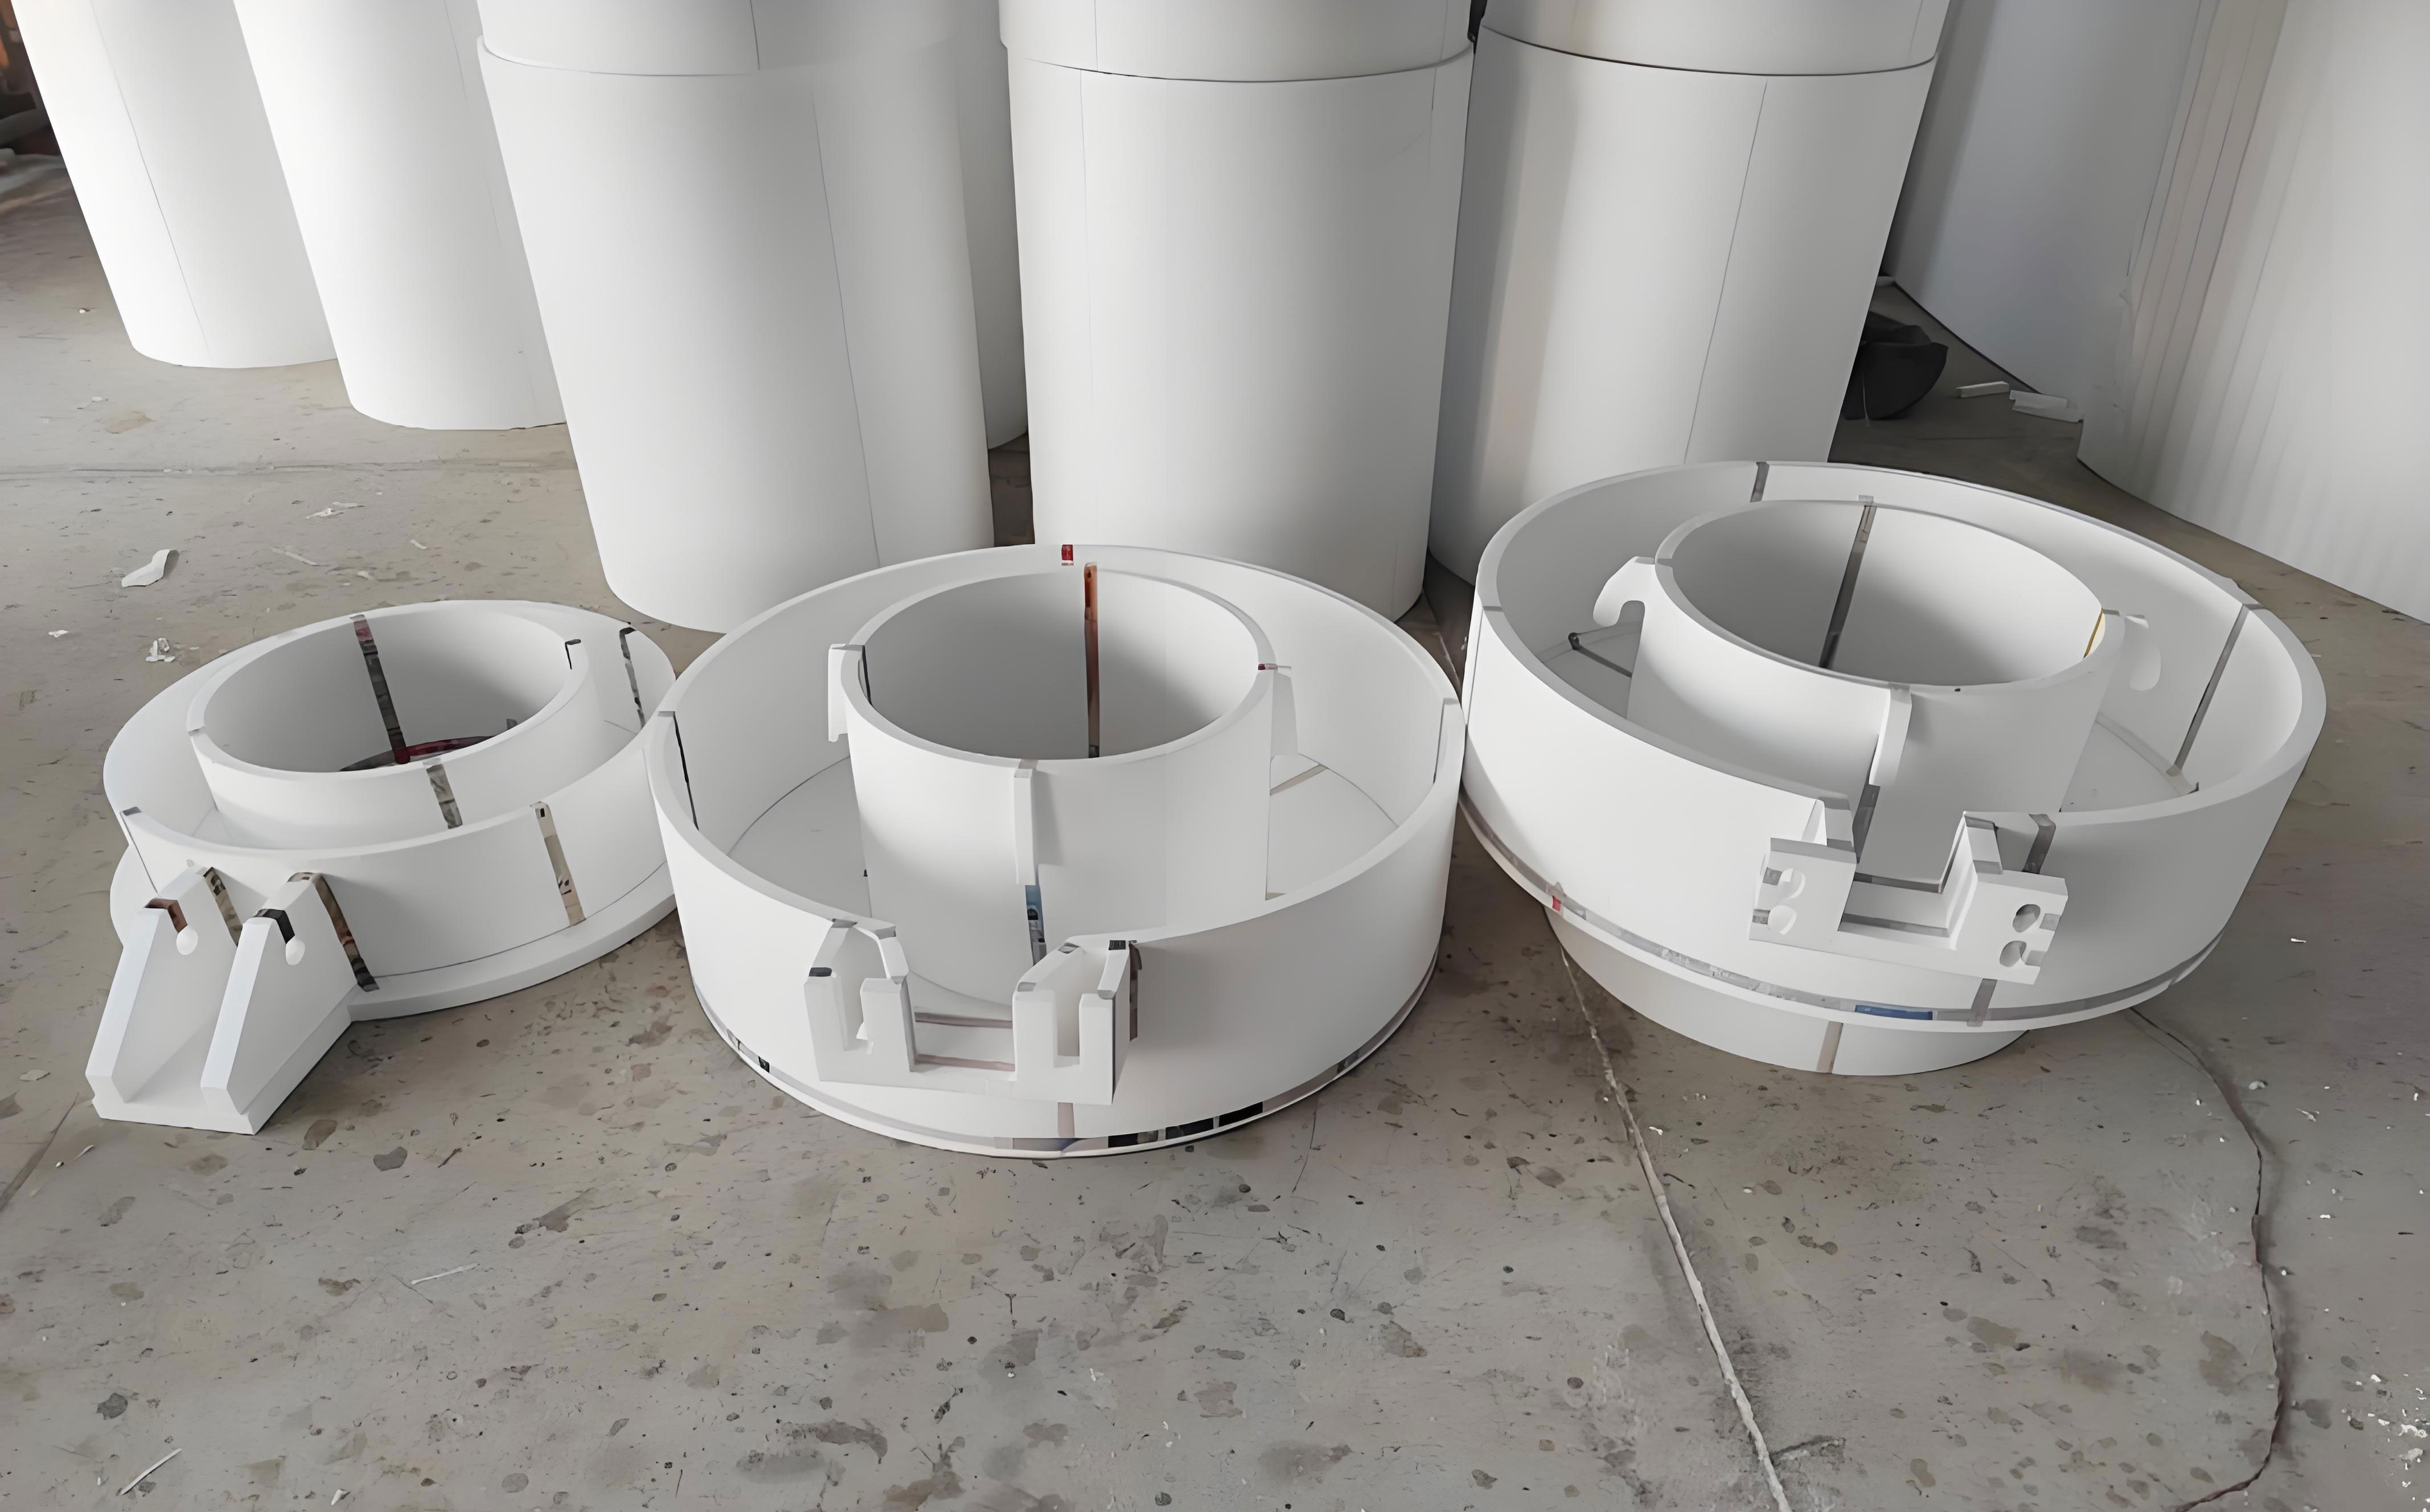
The core problem I addressed was not simply whether a pump body could be cast, but whether it could be cast repeatedly with a high process yield and without internal defects. The original shop process produced acceptable external shapes but suffered from shrinkage defects near the pump feet, the mouth ring, and the inlet flange, depending on the pouring position. I used ProCAST to reproduce the actual defects, then I redesigned the gating system and verified the new designs by simulation and production trials. After that, I used hot-spot modulus ratios to reduce the gating and feeding volume while still maintaining directional solidification. Finally, I used an L9 orthogonal array to study how shell temperature, shell thickness, and pouring temperature affect the shrinkage volume at critical locations. The result was a process that increased the casting yield from 34% to 47% and produced a sound pump body. The same modulus-ratio method was then applied to a second, similar pump body, and the predicted gating dimensions again produced a defect-free casting in simulation. The following figure is included as a general reference for the lost foam castings route, which I mention repeatedly because it is a common alternative for complex castings, although it was not the route I selected for this stainless steel pump body.
I began with the material specification because the thermophysical properties of CF8 determine the solidification interval, the feeding demand, and the safe pouring-temperature window. The chemical composition I used is summarised in Table 1. The carbon content is low, the chromium content is about 17.5 wt.%, and the nickel content is about 8.2 wt.%, which gives the alloy the corrosion resistance needed for pump service. The solidus temperature is about 1370 degrees C, and the liquidus temperature is about 1451 degrees C. These values were used in the simulation together with the shell properties. I also noted that lost foam castings made from similar stainless steels can suffer from carbon pickup and residue-related defects, which is another reason I retained the investment casting route for this pressure-bearing component.
| Element | C | Si | Mn | S | Cr | Ni | Mo | Fe |
|---|---|---|---|---|---|---|---|---|
| wt.% | 0.06 | 0.70 | 1.10 | 0.009 | 17.5 | 8.2 | 0.20 | Balance |
I used medium-temperature pattern wax because it has good fluidity, adequate green strength, low ash content, and acceptable shrinkage. The wax was injected on a single-arm wax injection machine. The storage cylinder was held at 70 to 75 degrees C, and the cooling cylinder was held at 65 to 70 degrees C. The room temperature was controlled at 24 plus or minus 2 degrees C. For the ceramic shell, I used a face coat made from 200-mesh zircon powder, colloidal silica, a wetting agent, and an antifoam agent. The face slurry viscosity was controlled at 45 plus or minus 5 seconds using a standard flow cup. The face stucco was 100-mesh zircon sand. For the transition and backup coats, I used mullite powder and mullite sand. The backup slurry viscosity was maintained at 20 plus or minus 5 seconds. The transition stucco was 30 to 60 mesh mullite sand, and the backup stucco was 16 to 30 mesh mullite sand. I used steam dewaxing at a pressure of at least 0.5 MPa, with a target of 0.8 MPa, and I fired the shells at 1100 degrees C for 60 minutes. These conditions are summarised in Table 2.
| Step | Material or Parameter | Value |
|---|---|---|
| Pattern wax | Medium-temperature wax | Softening range 50 to 70 degrees C |
| Wax storage | Storage cylinder | 70 to 75 degrees C |
| Wax cooling | Cooling cylinder | 65 to 70 degrees C |
| Face slurry | 200-mesh zircon, colloidal silica | 45 plus or minus 5 s viscosity |
| Face stucco | 100-mesh zircon sand | Applied after face dip |
| Backup slurry | Mullite powder | 20 plus or minus 5 s viscosity |
| Transition stucco | Mullite sand | 30 to 60 mesh |
| Backup stucco | Mullite sand | 16 to 30 mesh |
| Dewaxing | Steam autoclave | 0.5 to 0.8 MPa |
| Shell firing | Gas-fired furnace | 1100 degrees C for 60 minutes |
For the numerical simulation, I exported the three-dimensional model as an IGS file and imported it into ProCAST. I generated a finite-element mesh with a casting mesh size of 6 mm and a shell mesh size of 8 mm. For the first initial scheme, the mesh contained 74,402 nodes and 612,220 elements. For the second initial scheme, the mesh contained 69,154 nodes and 581,540 elements. I used gravity pouring, CF8 as the casting alloy, and mullite as the shell material. The interface heat-transfer coefficient between the casting and the shell was set to 500 W/m2 K. The initial shell temperature was 1050 degrees C, the pouring temperature was 1600 degrees C, and the pouring rate was 4 kg/s. After filling, the assembly cooled in air, and the external shell-to-air heat-transfer coefficient was 50 W/m2 K. The governing equations I relied on include the energy equation, the continuity equation, and the momentum equation. I used the following forms for the solidification and flow calculations:
$$\rho C_p \frac{\partial T}{\partial t} = \nabla \cdot (k \nabla T) + \rho L \frac{\partial f_s}{\partial t}$$
$$\nabla \cdot \mathbf{u} = 0$$
$$\rho \frac{\partial \mathbf{u}}{\partial t} + \rho(\mathbf{u}\cdot\nabla)\mathbf{u} = -\nabla p + \mu \nabla^2 \mathbf{u} + \rho \mathbf{g}$$
I also used the classical modulus concept to characterise feeding. The modulus of a casting section is the ratio of its volume to its cooling surface area:
$$M = \frac{V}{A}$$
Chvorinov’s rule indicates that solidification time is related to the modulus by a power law, which is why the modulus is a practical measure of hot-spot severity:
$$t_s = B \left(\frac{V}{A}\right)^n = B M^n$$
For feed design, I defined a modulus ratio between the feeding channel and the hot spot it must feed. For a given ingate or riser, the ratio is:
$$k_i = \frac{M_i}{M_{h,i}}$$
where \(M_i\) is the modulus of the feeding channel and \(M_{h,i}\) is the modulus of the hot spot. When the feeding channel has a sufficiently large modulus and remains liquid longer than the hot spot, directional solidification can proceed toward the feeding channel, and shrinkage defects can be moved into the gating or feeding system. I used the same idea for runners, spruces, and risers. I also calculated process yield as:
$$\eta = \frac{m_c}{m_c + m_g + m_r} \times 100\%$$
where \(m_c\) is the casting mass, \(m_g\) is the gating mass, and \(m_r\) is the riser mass. This equation was central to my yield optimisation because reducing gating and riser mass without introducing casting defects directly increases efficiency.
I then analysed the pump body hot spots. There are three main hot spots. Hot spot 1 is at the outlet flange and the adjacent internal passage, with an equivalent hot-spot circle diameter of about 25 mm. Hot spot 2 is at the inlet flange, with an equivalent hot-spot circle diameter of about 30 mm. Hot spot 3 is at the thick lower region opposite the inlet flange, with an equivalent hot-spot circle diameter of about 25 mm. The ProCAST-calculated moduli were 0.65 cm for hot spot 1, 0.76 cm for hot spot 2, and 0.60 cm for hot spot 3. These values are listed in Table 3. I later used these moduli repeatedly because they define the minimum feeding requirement for each region.
| Hot Spot | Location | Equivalent Diameter (mm) | Modulus (cm) |
|---|---|---|---|
| 1 | Outlet flange and adjacent passage | 25 | 0.65 |
| 2 | Inlet flange | 30 | 0.76 |
| 3 | Lower thick region opposite inlet flange | 25 | 0.60 |
I evaluated two main pouring positions. In the first position, the inlet flange faces upward. In the second position, the mouth ring faces upward. I considered other orientations as well, including outlet flange upward, outlet flange downward, and both flanges on the side. I rejected the side positions because they made gating attachment difficult, increased cleaning and finishing work, and did not naturally place feed channels near the isolated hot spots. I also rejected the outlet-flange-down position because it complicated shell making and did not provide a reliable feeding path to the outlet flange. The inlet-flange-up position allowed the largest hot spot to be fed directly from above, and it provided a simpler path for sequential solidification. The mouth-ring-up position was also feasible because the mouth ring is a hot-spot concentration, but it required a more complex arrangement of multiple ingates. I therefore designed two initial schemes, Scheme 1 with the inlet flange upward and Scheme 2 with the mouth ring upward.
Scheme 1 used a top-pouring system with three ingate families. The first ingate family was designed to feed the inlet flange and the adjacent lower connection. Two first ingates were used, each 80 mm by 60 mm by 40 mm. The second ingate was 90 mm by 55 mm by 60 mm and was used to feed the outlet flange. Because the outlet flange is thick and large in diameter, I added a pad that extended to a height of 40 mm on the outlet flange face. The third ingate family consisted of two ingates, each 30 mm by 40 mm by 20 mm, intended to feed the two pump feet. These ingates were connected through a first runner and a second runner. The first runner was 330 mm by 70 mm by 70 mm and connected the first ingate, the second ingate, and the sprue. The second runner was 250 mm by 40 mm by 45 mm and connected the third ingates. The sprue was 60 mm by 60 mm by 80 mm. Two open risers were used to feed the gating system and provide a pressure head. Each riser was \(\Phi 83\) mm at the bottom, \(\Phi 120\) mm at the top, and 160 mm high. The second riser served as the pouring cup. Two tie bars, each 10 mm by 15 mm, connected the two risers so that their temperatures remained closer to each other before solidification. The total height of Scheme 1 was 435 mm. The dimensions are summarised in Table 4.
| Component | Scheme 1 Initial Dimensions | Quantity |
|---|---|---|
| First ingate | 80 mm x 60 mm x 40 mm | 2 |
| Second ingate | 90 mm x 55 mm x 60 mm | 1 |
| Third ingate | 30 mm x 40 mm x 20 mm | 2 |
| First runner | 330 mm x 70 mm x 70 mm | 1 |
| Second runner | 250 mm x 40 mm x 45 mm | 1 |
| Sprue | 60 mm x 60 mm x 80 mm | 1 |
| Riser | \(\Phi 83\) mm x \(\Phi 120\) mm x 160 mm | 2 |
| Tie bar | 10 mm x 15 mm | 2 |
| Total height | 435 mm | — |
Scheme 2 also used top pouring, but the inlet flange was downward and the mouth ring was upward. A single first ingate, 50 mm by 70 mm by 20 mm, was used for the outlet flange, with a pad extending 55 mm above the outlet flange face. Four second ingates, each 50 mm by 35 mm by 40 mm, were used for the mouth ring. A third ingate, 40 mm by 40 mm by 112 mm, was used to feed the bottom inlet flange. The first runner was 340 mm by 70 mm by 70 mm and connected the first ingate with two of the second ingates. Two second runners, each 100 mm by 70 mm by 75 mm, connected the remaining second ingates. One open riser, \(\Phi 83\) mm by \(\Phi 120\) mm by 160 mm, was used as the pouring cup and to provide a pressure head. Two tie bars, each 10 mm by 15 mm, connected the riser to the first runner, and a second tie bar connected the pump feet to the first runner for venting, slag removal, and wax removal. The total height of Scheme 2 was 410 mm. The dimensions are summarized in Table 5.
| Component | Scheme 2 Initial Dimensions | Quantity |
|---|---|---|
| First ingate | 50 mm x 70 mm x 20 mm | 1 |
| Second ingate | 50 mm x 35 mm x 40 mm | 4 |
| Third ingate | 40 mm x 40 mm x 112 mm | 1 |
| First runner | 340 mm x 70 mm x 70 mm | 1 |
| Second runner | 100 mm x 70 mm x 75 mm | 2 |
| Riser | \(\Phi 83\) mm x \(\Phi 120\) mm x 160 mm | 1 |
| Tie bar | 10 mm x 15 mm | 2 |
| Total height | 410 mm | — |
In the filling simulation of Scheme 1, the metal entered through the second riser and passed through the first ingate into the inlet flange, then flowed downward into the pump feet. At about 1 s, the flow was still reasonably controlled. At about 2 s, some turbulence, entrainment, and splashing appeared, but the thin pump feet required a relatively fast fill to avoid mistun. After the mouth ring filled, the flow became smoother and rose through the outlet and inlet flanges. The casting was filled in about 7 s, and the complete gating system was filled in about 15 s. The total filling time was approximately 15 s. I observed that the velocity field was acceptable for the casting itself, although some entrainment occurred in the early stage. This is a common trade-off in investment casting, and it is also a concern in lost foam castings, where pattern decomposition can introduce additional gas-related defects if the pouring rate is not controlled.
In the solidification simulation of Scheme 1, the casting mostly followed bottom-to-top directional solidification, but isolated liquid regions still formed late in solidification. At about 330 s, the pump feet and the lower part of the outlet flange began to solidify, while the outer shell of the pump body also began to solidify. This blocked the feeding path between the pump feet and the mouth ring. At about 540 s, an isolated liquid region formed at the connection between the pump feet and the mouth ring, and it could not be fed. This produced shrinkage porosity in that region. The rest of the casting was fed by the designed ingates. The last solidification region was located below the second riser in the runner, and the total solidification time was about 1600 s. When I displayed the shrinkage threshold at 2, the predicted shrinkage volume in the casting was about 0.6 cm3, concentrated at the pump-foot-to-mouth-ring connection. The actual shop defect appeared in the same location after the ingates were cut off. This agreement between simulation and production gave me confidence that the simulation could be used as a predictive tool. It also showed that lost foam castings, despite their advantages in shape complexity, would not automatically solve this type of thermal hot-spot problem, because the root cause was feeding-path blockage rather than moulding method alone.
| Scheme | Filling Time | Solidification Time | Main Defect Location | Predicted Shrinkage Volume | Initial Yield |
|---|---|---|---|---|---|
| Scheme 1 | 15 s | 1600 s | Pump foot and mouth-ring connection | 0.6 cm3 | 33% |
| Scheme 2 | 14 s | 1658 s | Inlet flange and third-ingate connection | 10.3 cm3 | 34% |
In Scheme 2, the filling behaviour was different. The metal entered through the riser and then split into four second ingates and one third ingate. It filled the mouth ring and the inlet flange first, then the pump feet and the outlet flange. Because the metal was divided early into several streams, the flow became irregular and entrainment and splashing were more pronounced. The casting was filled in about 6 s, and the gating system was filled in about 14 s. The total filling time was about 14 s. The main liquid impact occurred in the runner, with a velocity of about 1.7 m/s. Since the impact was mostly in the gating system, the casting itself was less affected, but I still needed to control the pouring rate to reduce slag and entrainment. In the solidification simulation, the casting did not follow bottom-to-top directional solidification. A large isolated liquid region formed at the inlet flange. At about 368 s, the pump feet, inlet flange, and outlet flange began to solidify. At about 818 s, the mouth ring began to solidify and was fed by the four second ingates, while the inlet flange was fed by the third ingate. The feeding path of the third ingate gradually narrowed. At about 1008 s, the third-ingate feeding path was blocked, and a large isolated liquid region formed between the inlet flange and the third ingate. At the threshold of 4, the predicted shrinkage volume in the casting was about 10.3 cm3. The actual production result showed a clear shrinkage cavity at the same location after the third ingate was removed. This was a severe defect and confirmed that the initial Scheme 2 was not acceptable.
I then optimised Scheme 1. The simulation had shown that the shrinkage defect was not caused by a lack of riser feeding but by an incorrect arrangement of the third ingate. The third ingate solidified before it could feed the pump feet, so the pump-foot-to-mouth-ring connection became isolated. I moved the third ingate from above the pump feet to below the mouth ring. I also adjusted the feeding sequence so that the sprue fed the third ingate, the third ingate fed the mouth ring from below, and the mouth ring fed the pump feet. This created a complete feeding path and prevented the early blockage of the third-ingate channel. I added a second tie bar above the pump feet for venting and slag removal. In the optimised Scheme 1, the sprue was 60 mm by 60 mm by 250 mm. The third ingate was enlarged to 160 mm by 60 mm by 40 mm. The second tie bar was 20 mm by 25 mm by 135 mm. The other ingates and runners remained the same, and pouring was still conducted through the second riser. The optimised dimensions are given in Table 6.
| Component | Optimised Scheme 1 Dimensions | Change from Initial |
|---|---|---|
| Sprue | 60 mm x 60 mm x 250 mm | Increased height |
| Third ingate | 160 mm x 60 mm x 40 mm | Moved below mouth ring and enlarged |
| Second tie bar | 20 mm x 25 mm x 135 mm | Added above pump feet |
| First ingate | 80 mm x 60 mm x 40 mm | Unchanged |
| Second ingate | 90 mm x 55 mm x 60 mm | Unchanged |
| First runner | 330 mm x 70 mm x 70 mm | Unchanged |
| Second runner | 250 mm x 40 mm x 45 mm | Unchanged |
| Riser | \(\Phi 83\) mm x \(\Phi 120\) mm x 160 mm | Unchanged |
In the filling simulation of optimised Scheme 1, the metal entered through the second riser and then passed through the first ingate into the inlet flange. Because the third ingate was now located at the lowest position, the metal first filled the third ingate. At about 1 s, the flow was similar to the initial scheme. At about 3 s, turbulence and air entrainment still appeared, but after the mouth ring filled, the flow became smoother. At about 7 s, the casting was filled. The gating system was filled in about 16 s. The total filling time was about 16 s. The change in the gating system did not significantly change the filling behaviour, which was desirable because the filling behaviour of the initial Scheme 1 was already acceptable.
In the solidification simulation of optimised Scheme 1, the pump feet were fed by the third ingate, and the outlet flange was fed by the first ingate. The inlet flange was fed by the second ingate. The hot spots were each fed by their corresponding ingate, and the solidification sequence followed the intended directional pattern. No isolated liquid region formed in the casting. The casting was almost completely solidified at about 1313 s, and the entire assembly solidified at about 1443 s. The last solidification region was in the runner. At a shrinkage threshold of 2, the casting itself showed no shrinkage defects. All shrinkage cavities were concentrated in the gating system, especially at the riser base and the runner. The process yield of optimised Scheme 1 remained about 33%, but the casting was sound. This was a good result, but the yield was still too low for a competitive production process.
I also optimised Scheme 2. The initial Scheme 2 defect was caused by insufficient feeding distance from the third ingate to the inlet flange. Because the contact area between the third ingate and the inlet flange was limited by the casting geometry, simply enlarging the third ingate was not practical. I therefore moved the third ingate to the side of the inlet flange and connected it to a dedicated sprue. I extended the second runner to connect to the new sprue. The feeding sequence became third runner to sprue, sprue to third ingate, and third ingate to inlet flange. In the optimised Scheme 2, the sprue was 70 mm by 70 mm by 205 mm. The third ingate was 50 mm by 70 mm by 50 mm and was shaped as a flange pad extending 60 mm from the inlet flange mouth. The third runner was 175 mm by 70 mm by 70 mm. The other ingates and runners were unchanged. The dimensions are given in Table 7.
| Component | Optimised Scheme 2 Dimensions | Change from Initial |
|---|---|---|
| Sprue | 70 mm x 70 mm x 205 mm | New dedicated sprue |
| Third ingate | 50 mm x 70 mm x 50 mm | Moved to inlet flange side |
| Third runner | 175 mm x 70 mm x 70 mm | Added to connect sprue |
| First ingate | 50 mm x 70 mm x 20 mm | Unchanged |
| Second ingate | 50 mm x 35 mm x 40 mm | Unchanged |
| First runner | 340 mm x 70 mm x 70 mm | Unchanged |
| Second runner | 100 mm x 70 mm x 75 mm | Unchanged |
| Riser | \(\Phi 83\) mm x \(\Phi 120\) mm x 160 mm | Unchanged |
In the filling simulation of optimised Scheme 2, the metal entered through the riser and split through the four second ingates into the inlet flange and the mouth ring. Part of the metal also entered through the new sprue. At about 2 s, the flow was irregular, with some splashing and entrainment. At about 4 s, the metal filled the third ingate and began to fill the inlet flange. At about 8 s, the casting was filled. The gating system was filled in about 15 s. The total filling time was about 15 s. The flow still impacted the runner at about 1.7 m/s, but since the impact was in the gating system, it did not directly damage the casting. In the solidification simulation, the inlet-flange isolated liquid region was successfully fed by the new third ingate. The pump feet solidified first. At about 942 s, the mouth ring began to solidify and was fed by the four second ingates. The outlet flange was fed by the first ingate, and the inlet flange was fed by the third ingate. At about 1952 s, the outlet flange was fully fed. At about 2752 s, the entire assembly was solidified. At a shrinkage threshold of 2, the casting showed no shrinkage defects, and all shrinkage cavities were concentrated in the runner and riser base. The optimised Scheme 2 was therefore also technically sound. Its yield was about 34%, still low, and it required a more complex gating arrangement and a longer solidification time than optimised Scheme 1.
| Scheme | Filling Time | Solidification Time | Casting Defects | Defect Location in Gating | Yield |
|---|---|---|---|---|---|
| Optimised Scheme 1 | 16 s | 1443 s | None | Runner and riser base | 33% |
| Optimised Scheme 2 | 15 s | 2752 s | None | Runner and riser base | 34% |
I compared the two optimised schemes. Both produced sound castings in simulation, but optimised Scheme 1 had a shorter solidification time, a simpler gating system, and easier handling in production. I selected optimised Scheme 1 for production validation. The wax tree was assembled, the shell was prepared, the metal was melted and poured, and the casting was cleaned. After pressure testing and X-ray inspection, the mouth-ring region showed no cavity-type defects. The production result confirmed that the optimised Scheme 1 was capable of producing a qualified pump body. However, the yield was still only 33%, which meant that a large amount of metal was being poured into the gating and feeding system and then returned as scrap. I therefore moved to the next stage of my work: yield optimisation using modulus ratios.
I calculated the modulus of each hot spot and then systematically reduced the modulus of each feeding channel until a defect appeared. The objective was to find the minimum feeding modulus that still produced a sound casting. This is a more rigorous approach than simply making the gating system large, and it is particularly important for stainless steel pump bodies because the material cost and melting cost are significant. The method can also be used for lost foam castings, but in my case the ceramic shell process allowed me to control shell temperature and shell thickness independently, which gave me additional process variables to optimise. The following paragraphs describe the modulus-ratio experiments.
For the first ingate, which feeds hot spot 1 at the outlet flange, I tested five modulus ratios. The hot-spot modulus was fixed at 0.65 cm. The first-ingate modulus was reduced from 0.83 cm to 0.72 cm. The results are shown in Table 8. At a modulus ratio of 1.17 or higher, the simulation showed no defect at hot spot 1. At a modulus ratio of 1.10, a defect appeared at the lower part of the outlet flange. Therefore, the minimum acceptable ratio for the first ingate was \(k_1 = 1.17\). This means that the first ingate must have a modulus at least 1.17 times that of hot spot 1.
| First Ingate Modulus (cm) | Hot Spot 1 Modulus (cm) | Ratio \(k_1\) | Simulated Defect |
|---|---|---|---|
| 0.83 | 0.65 | 1.28 | None |
| 0.81 | 0.65 | 1.25 | None |
| 0.79 | 0.65 | 1.22 | None |
| 0.76 | 0.65 | 1.17 | None |
| 0.72 | 0.65 | 1.10 | Yes |
For the second ingate, which feeds hot spot 2 at the inlet flange, I tested seven modulus ratios. The hot-spot modulus was 0.76 cm. The second-ingate modulus was reduced from 0.92 cm to 0.48 cm. The results are shown in Table 9. At a modulus ratio of 0.78 or higher, the inlet flange had no shrinkage defect. At a modulus ratio of 0.63, shrinkage appeared below the inlet flange. Therefore, the minimum acceptable ratio for the second ingate was \(k_2 = 0.78\). This is an important result because it shows that the inlet flange could be fed by a relatively small ingate when the feeding path remained open. In comparison, lost foam castings often require a more generous feeding path because the pattern decomposition can disturb the thermal field and the mould atmosphere, but in this investment casting process the modulus ratio could be reduced substantially.
| Second Ingate Modulus (cm) | Hot Spot 2 Modulus (cm) | Ratio \(k_2\) | Simulated Defect |
|---|---|---|---|
| 0.92 | 0.76 | 1.21 | None |
| 0.85 | 0.76 | 1.12 | None |
| 0.81 | 0.76 | 1.07 | None |
| 0.71 | 0.76 | 0.93 | None |
| 0.66 | 0.76 | 0.87 | None |
| 0.60 | 0.76 | 0.78 | None |
| 0.48 | 0.76 | 0.63 | Yes |
For the third ingate, which acts as a reverse-feeding channel for hot spot 3 at the lower mouth-ring and pump-foot region, I tested three modulus ratios. The hot-spot modulus was 0.60 cm. The third-ingate modulus was reduced from 0.96 cm to 0.85 cm. The results are shown in Table 10. At a modulus ratio of 1.5 or higher, the casting showed no defect. At a modulus ratio of 1.4, a shrinkage defect appeared. Therefore, the minimum acceptable ratio for the third ingate was \(k_3 = 1.5\). The third ingate needed a larger relative modulus because it had to feed a region that was partly surrounded by thinner sections, and the feeding path had to remain open until the lower mouth-ring region solidified.
| Third Ingate Modulus (cm) | Hot Spot 3 Modulus (cm) | Ratio \(k_3\) | Simulated Defect |
|---|---|---|---|
| 0.96 | 0.60 | 1.60 | None |
| 0.90 | 0.60 | 1.50 | None |
| 0.85 | 0.60 | 1.40 | Yes |
After establishing the minimum ingate ratios, I optimised the runner, sprue, and riser. The runner is directly connected to the first and second ingates, so its modulus must be large enough to keep those ingates fed. I tested runner moduli of 1.6 cm and 1.5 cm. The results are shown in Table 11. At a runner modulus of 1.6 cm, the simulation showed no defect. At 1.5 cm, a defect appeared at the inlet flange. The controlling ratio was the second-ingate-to-runner ratio, because the second ingate had the lowest modulus. The minimum runner-to-second-ingate ratio was \(k_{2,r} = 2.6\). The first-ingate-to-runner ratio at this condition was \(k_{1,r} = 2.1\). These ratios show that the runner must be substantially larger than the ingates, especially when the inlet flange is fed through a long path.
| Runner Modulus (cm) | First Ingate Modulus (cm) | Second Ingate Modulus (cm) | Ratio \(k_{1,r}\) | Ratio \(k_{2,r}\) | Simulated Defect |
|---|---|---|---|---|---|
| 1.6 | 0.76 | 0.60 | 2.1 | 2.6 | None |
| 1.5 | 0.76 | 0.60 | 2.0 | 2.5 | Yes |
The sprue is connected to the lower third ingate, so it directly affects the feeding of hot spot 3. I tested sprue moduli of 1.36 cm, 1.26 cm, 1.15 cm, and 1.04 cm. The third-ingate modulus was 0.90 cm. The results are shown in Table 12. At sprue moduli of 1.15 cm and above, the casting showed no defect. At a sprue modulus of 1.04 cm, the ratio to the third ingate was 1.15, and a defect appeared at the connection between the casting and the third ingate. Therefore, the minimum acceptable sprue-to-third-ingate ratio was \(k_{s,3} = 1.28\). This result was important because it allowed me to reduce the sprue size considerably while still keeping the third-ingate feeding path open.
| Sprue Modulus (cm) | Third Ingate Modulus (cm) | Ratio \(k_{s,3}\) | Simulated Defect |
|---|---|---|---|
| 1.36 | 0.90 | 1.51 | None |
| 1.26 | 0.90 | 1.40 | None |
| 1.15 | 0.90 | 1.28 | None |
| 1.04 | 0.90 | 1.15 | Yes |
I also tested the riser. In the original design the riser was intended to feed the entire gating system and provide a pressure head. When I reduced the riser modulus to a very small value, the casting still showed no defect. When I removed the riser completely, the casting still showed no defect in simulation. This showed that the riser was not required for feeding the casting under the optimised gating conditions. Its main function was to act as a pouring cup and to promote stable filling. I therefore replaced the large riser with a smaller pouring cup, \(\Phi 45\) mm by 120 mm, which provided a modest liquid head and helped with filling. The final process used the dimensions listed in Table 13. The runner was 70 mm by 70 mm by 390 mm, the sprue was 50 mm by 50 mm by 290 mm, the first ingate was 62 mm by 50 mm by 100 mm, the second ingate was 35 mm by 35 mm by 40 mm, and the third ingate was 40 mm by 60 mm by 75 mm. With these dimensions, the casting was sound and all shrinkage defects were located in the runner and sprue. The process yield increased from 34% to 47%. This was a major improvement because it reduced the amount of metal that had to be melted and returned, lowered energy consumption, and shortened the cleaning and cut-off work. I also noted that the same modulus-ratio approach could be applied to lost foam castings, although the gating ratios for lost foam castings would need to be adjusted for pattern decomposition and mould filling behaviour.
| Component | Final Optimised Dimension |
|---|---|
| Riser or pouring cup | \(\Phi 45\) mm x 120 mm |
| Runner | 70 mm x 70 mm x 390 mm |
| Sprue | 50 mm x 50 mm x 290 mm |
| First ingate | 62 mm x 50 mm x 100 mm |
| Second ingate | 35 mm x 35 mm x 40 mm |
| Third ingate | 40 mm x 60 mm x 75 mm |
I then applied the same modulus-ratio method to a second pump body. The second pump body weighed about 33.15 kg, with an envelope of approximately 335 mm by 270 mm by 180 mm, a maximum wall thickness of 33 mm, and a minimum wall thickness of 11 mm. Its inlet flange diameter was about 217 mm and its thickness was about 33 mm. Its outlet flange diameter was about 176 mm and its thickness was about 27 mm. The hot-spot moduli were 0.70 cm for hot spot 1, 0.84 cm for hot spot 2, and 0.63 cm for hot spot 3. Using the minimum ratios \(k_1 = 1.17\), \(k_2 = 0.78\), and \(k_3 = 1.5\), I calculated the required ingate moduli. The first ingate modulus was \(1.17 \times 0.70 = 0.819\) cm, rounded to 0.82 cm. The second ingate modulus was \(0.78 \times 0.84 = 0.655\) cm, rounded to 0.66 cm. The third ingate modulus was \(1.5 \times 0.63 = 0.945\) cm, rounded to 0.95 cm. The runner modulus was based on the second-ingate ratio \(k_{2,r} = 2.6\), giving \(0.66 \times 2.6 = 1.716\) cm, rounded to 1.72 cm. The sprue modulus was based on the third-ingate ratio \(k_{s,3} = 1.28\), giving \(0.95 \times 1.28 = 1.216\) cm, rounded to 1.22 cm. These values are listed in Table 14. I simulated the second pump body with these dimensions, and the casting showed no defects. All shrinkage cavities were located in the runner and sprue. This confirmed that the modulus-ratio method was transferable between similar pump bodies and could reduce process development time. It also showed that the method was more robust than simply copying a previous gating layout, because the ratios could be scaled according to each new casting’s hot-spot moduli.
| Feeding Feature | Calculated Modulus (cm) | Basis |
|---|---|---|
| First ingate | 0.82 | \(1.17 \times 0.70\) |
| Second ingate | 0.66 | \(0.78 \times 0.84\) |
| Third ingate | 0.95 | \(1.5 \times 0.63\) |
| Runner | 1.72 | \(2.6 \times 0.66\) |
| Sprue | 1.22 | \(1.28 \times 0.95\) |
After achieving the maximum-yield gating design, I still needed to optimise the process parameters because the same gating layout can behave differently when the shell temperature, shell thickness, and pouring temperature change. I used a design-of-experiments approach, specifically an L9 orthogonal array, to study these three factors at three levels. The response variables were the shrinkage volumes at three critical positions: position 1 at the outlet flange, position 2 at the mouth ring, and position 3 at the connection between the mouth ring and the pump feet. I defined the optimal condition as the one that minimised the shrinkage volume at all three positions. I chose shell temperature because it controls the heat extraction rate and the feeding-path lifetime. I chose shell thickness because it affects the thermal resistance between the casting and the environment. I chose pouring temperature because it affects superheat, fluidity, and the total liquid shrinkage. The factor levels are shown in Table 15.
| Factor | Level 1 | Level 2 | Level 3 |
|---|---|---|---|
| A: Shell temperature (degrees C) | 700 | 750 | 800 |
| B: Shell thickness (mm) | 7.5 | 8.0 | 8.5 |
| C: Pouring temperature (degrees C) | 1560 | 1580 | 1600 |
The L9 orthogonal array is shown in Table 16. This design allowed me to evaluate the main effects of the three factors with only nine simulation runs. Each row represents a different combination of shell temperature, shell thickness, and pouring temperature. I used the final optimised gating design for all runs, so the only changes were the process parameters.
| Run | A | B | C |
|---|---|---|---|
| 1 | 1 | 1 | 1 |
| 2 | 1 | 2 | 2 |
| 3 | 1 | 3 | 3 |
| 4 | 2 | 1 | 2 |
| 5 | 2 | 2 | 3 |
| 6 | 2 | 3 | 1 |
| 7 | 3 | 1 | 3 |
| 8 | 3 | 2 | 1 |
| 9 | 3 | 3 | 2 |
The simulation results for the nine runs are shown in Table 17. \(Y_1\), \(Y_2\), and \(Y_3\) are the shrinkage volumes at positions 1, 2, and 3, respectively. I recorded the quantitative shrinkage volumes from the post-processor. The results show clear differences among the runs. Run 6, with shell temperature 750 degrees C, shell thickness 8.5 mm, and pouring temperature 1560 degrees C, gave very low shrinkage at position 1 and position 3, and it eliminated shrinkage at position 3. Run 8, with shell temperature 800 degrees C, shell thickness 8.0 mm, and pouring temperature 1560 degrees C, gave very low shrinkage at position 1, moderate shrinkage at position 2, and zero shrinkage at position 3. Run 9, with shell temperature 800 degrees C, shell thickness 8.5 mm, and pouring temperature 1580 degrees C, also gave very low shrinkage at positions 1 and 2, and zero shrinkage at position 3. The highest shrinkages occurred in runs 4 and 7, which used lower shell temperatures or thinner shells in combination with higher pouring temperatures.
| Run | \(Y_1\) (cm3) | \(Y_2\) (cm3) | \(Y_3\) (cm3) |
|---|---|---|---|
| 1 | 1.100 | 0.360 | 1.900 |
| 2 | 1.210 | 0.760 | 1.900 |
| 3 | 0.800 | 0.830 | 1.900 |
| 4 | 1.100 | 0.734 | 2.230 |
| 5 | 0.500 | 0.660 | 1.900 |
| 6 | 0.030 | 0.160 | 0.000 |
| 7 | 1.400 | 0.940 | 0.400 |
| 8 | 0.020 | 0.210 | 0.000 |
| 9 | 0.024 | 0.032 | 0.000 |
I analysed the results using the average response at each factor level and the range. The average at a given level is:
$$\bar{y}_{A_i} = \frac{1}{n_i}\sum_{j=1}^{n_i} y_{ij}$$
The range is:
$$R = \bar{y}_{max} – \bar{y}_{min}$$
A larger range means that the factor has a stronger effect on the response. The calculated averages and ranges for the three positions are shown in Table 18. For position 1, the shell thickness had the largest range, followed by shell temperature, and then pouring temperature. This means that the outlet-flange shrinkage was most sensitive to the shell thickness. A thicker shell reduced the cooling rate at the outlet flange and helped the first ingate remain open longer. For position 2, the pouring temperature had the largest range, followed by shell thickness, and then shell temperature. This means that the mouth-ring shrinkage was most sensitive to pouring temperature, because higher superheat increased the liquid shrinkage demand. For position 3, shell temperature had the largest range, followed by shell thickness, and then pouring temperature. This means that the lower mouth-ring and pump-foot connection was most sensitive to shell temperature, because a cold shell could freeze the thin pump-foot section and block the feeding path from the third ingate.
| Response | Factor | Level 1 Average | Level 2 Average | Level 3 Average | Range |
|---|---|---|---|---|---|
| \(Y_1\) | A: Shell temperature | 1.0367 | 0.5433 | 0.4813 | 0.5554 |
| \(Y_1\) | B: Shell thickness | 1.2000 | 0.5767 | 0.2847 | 0.9153 |
| \(Y_1\) | C: Pouring temperature | 0.3833 | 0.7780 | 0.9000 | 0.5167 |
| \(Y_2\) | A: Shell temperature | 0.6500 | 0.5180 | 0.3940 | 0.2560 |
| \(Y_2\) | B: Shell thickness | 0.6780 | 0.5433 | 0.3407 | 0.3373 |
| \(Y_2\) | C: Pouring temperature | 0.2433 | 0.5087 | 0.8100 | 0.5667 |
| \(Y_3\) | A: Shell temperature | 1.9000 | 1.3767 | 0.1333 | 1.7667 |
| \(Y_3\) | B: Shell thickness | 1.5100 | 1.2667 | 0.6333 | 0.8767 |
| \(Y_3\) | C: Pouring temperature | 0.6333 | 1.3767 | 1.4000 | 0.7667 |
From these results, I identified the best level for each factor. For position 1, the best levels were A3, B3, and C1. For position 2, the best levels were A3, B3, and C1. For position 3, the best levels were also A3, B3, and C1. Therefore, the overall optimum was A3B3C1, which corresponds to a shell temperature of 800 degrees C, a shell thickness of 8.5 mm, and a pouring temperature of 1560 degrees C. This combination gave the smallest shrinkage volumes at all three critical positions. I also noted that a higher shell temperature reduced the temperature gradient between the shell and the melt, which delayed the freezing of thin sections and helped the feeding paths remain open. A thicker shell reduced the cooling rate and provided more thermal resistance, which also helped feeding. A lower pouring temperature reduced the superheat and the total liquid shrinkage, which reduced the shrinkage demand. However, the pouring temperature could not be lowered indefinitely because the metal still had to fill the thin sections without mistun. The selected pouring temperature of 1560 degrees C provided a good balance between fluidity and shrinkage control. I also considered the role of lost foam castings in this part of the study. In lost foam castings, the pattern decomposition can produce a different mould atmosphere and a different heat-transfer condition, so the optimum shell temperature and pouring temperature for lost foam castings might differ from the values I found here. Nevertheless, the general principle of reducing superheat, controlling shell thermal resistance, and maintaining feeding-path patency applies to lost foam castings as well.
I also used the orthogonal results to check the robustness of the final gating design. The final gating design was based on the minimum modulus ratios, so it was already close to the feeding limit. The DOE results showed that when the shell temperature was low, the shell thickness was thin, or the pouring temperature was high, the shrinkage volume increased. This is consistent with the physics of feeding: a cold shell, a thin shell, or a high superheat all reduce the time available for feeding and increase the demand for liquid metal. Therefore, the process window must be controlled carefully in production. In my recommended process, the shell temperature should be maintained near 800 degrees C, the shell thickness should be about 8.5 mm, and the pouring temperature should be about 1560 degrees C. These parameters gave the lowest shrinkage volumes and the best chance of producing a sound casting. I also recommend that the shell temperature be measured immediately before pouring, because the shell cools quickly after removal from the firing furnace. If the shell temperature drops below the target, the risk of shrinkage at position 3 increases. Similarly, if the pouring temperature rises above the target, the risk of shrinkage at position 2 increases. The practical control limits should therefore be established around the optimum values.
I combined the gating optimisation and the DOE optimisation into a single recommended process. The final gating dimensions are those in Table 13, and the final process parameters are a shell temperature of 800 degrees C, a shell thickness of 8.5 mm, and a pouring temperature of 1560 degrees C. The process yield is about 47%, and the casting is free of shrinkage defects at the critical positions. The shrinkage cavities are located in the runner and sprue, where they can be removed with the gating system. This is a much better result than the original process, which had a yield of about 34% and produced shrinkage defects in the casting. The improvement was achieved without adding expensive equipment or changing the alloy. The main changes were a better pouring position, a better feeding-channel layout, a smaller but sufficient modulus ratio, and a tighter process window. I also confirmed that the same modulus-ratio method could be applied to a second, similar pump body, which reduced the trial-and-error work for that part. The second pump body required first-ingate modulus of 0.82 cm, second-ingate modulus of 0.66 cm, third-ingate modulus of 0.95 cm, runner modulus of 1.72 cm, and sprue modulus of 1.22 cm, and the simulation showed no casting defects. This demonstrated that the method is not limited to a single part number. It can be used as a general design rule for similar stainless steel pump bodies, and it can also provide a starting point for lost foam castings if the thermal boundary conditions are adjusted for the lost foam process.
In my final assessment, the most important findings are as follows. First, the inlet-flange-up pouring position was better than the mouth-ring-up position for this pump body because it provided a more direct feeding path to the largest hot spot and simplified the gating layout. Second, the initial defects were caused by feeding-path blockage rather than by a simple shortage of riser metal. This was true for both schemes, and it shows why simulation is valuable: the visible defect location does not always indicate the true cause. Third, the modulus ratio is an effective design tool. I found minimum acceptable ratios of \(k_1 = 1.17\), \(k_2 = 0.78\), and \(k_3 = 1.5\) for the three ingates. I also found minimum runner-to-second-ingate ratio of \(k_{2,r} = 2.6\) and minimum sprue-to-third-ingate ratio of \(k_{s,3} = 1.28\). These ratios allowed me to reduce the gating mass while keeping the casting sound. Fourth, the riser was not needed for feeding once the gating system was correctly designed. A small pouring cup was sufficient to provide a stable fill and a modest pressure head. Fifth, the DOE results showed that shell thickness had the strongest effect on outlet-flange shrinkage, pouring temperature had the strongest effect on mouth-ring shrinkage, and shell temperature had the strongest effect on the lower mouth-ring and pump-foot connection. The optimum parameters were 800 degrees C shell temperature, 8.5 mm shell thickness, and 1560 degrees C pouring temperature. Sixth, the process yield increased from 34% to 47%, which is a significant economic improvement for a stainless steel pump body. Finally, the method was transferable to a second pump body, which means that the modulus-ratio approach can shorten process development and reduce the need for expensive trial castings. Even when lost foam castings are considered as an alternative, the same emphasis on feeding-path control, thermal management, and process window definition remains necessary, and lost foam castings would still need to be evaluated for carbon pickup, residue, and internal soundness in this pressure-bearing application.
I conclude that a combined approach of numerical simulation, modulus-ratio design, and orthogonal process optimisation is highly effective for stainless steel pump body investment casting. The approach allowed me to identify the original defect mechanisms, redesign the gating system, reduce the feeding mass, and select robust process parameters. The final process produced a sound casting with a yield of 47%, and the same method was successfully applied to a similar pump body. I believe this approach can be extended to other stainless steel pump bodies and to other high-integrity castings where shrinkage porosity must be avoided. Although lost foam castings offer advantages in some complex-shaped applications, the investment casting route gave me the combination of surface quality, dimensional precision, and feeding control that this pump body required. The findings also provide a practical basis for setting modulus ratios, gating dimensions, shell conditions, and pouring conditions in similar production environments.
| Final Parameter | Value |
|---|---|
| Pouring position | Inlet flange upward |
| Final casting yield | 47% |
| Shell temperature | 800 degrees C |
| Shell thickness | 8.5 mm |
| Pouring temperature | 1560 degrees C |
| Minimum first-ingate ratio \(k_1\) | 1.17 |
| Minimum second-ingate ratio \(k_2\) | 0.78 |
| Minimum third-ingate ratio \(k_3\) | 1.5 |
| Minimum runner-to-second-ingate ratio | 2.6 |
| Minimum sprue-to-third-ingate ratio | 1.28 |
The final recommended process is therefore a low-superheat, high-shell-temperature, thick-shell process with a compact but sufficient gating system. It keeps the feeding channels open long enough to feed the isolated hot spots, but it does not add unnecessary metal. This is the balance I was seeking. I also recommend that future work compare these results with lost foam castings under controlled conditions, because lost foam castings may offer different filling and cooling behaviour, and a direct comparison would help determine whether lost foam castings can meet the same pressure-tightness and inspection requirements. For the present study, however, the investment casting process with the optimised modulus ratios and DOE parameters is the most reliable route I identified.