
In the field of modern casting, the emergence of 3d sand printing has brought profound changes to the manufacturing of sand molds and cores. Unlike conventional mold making processes, 3d sand printing builds sand molds layer by layer directly from digital models. This technology offers the distinct advantages of clean production, reduced manual labor, high dimensional accuracy, and great design flexibility. The working environment is significantly improved because the scattering of sand is controlled within a sealed chamber and dust emission is minimized. Moreover, digital transmission of product data reduces the time spent on information exchange and eliminates the need for physical master patterns. This not only shortens the lead time but also enhances the adaptability of the production process. In addition, 3d sand printing enables the fabrication of intricate geometries that are impossible or uneconomical to produce using conventional methods. However, in spite of these remarkable advantages, 3d sand printing still faces a number of technical challenges that must be addressed before it can be widely adopted in foundries.
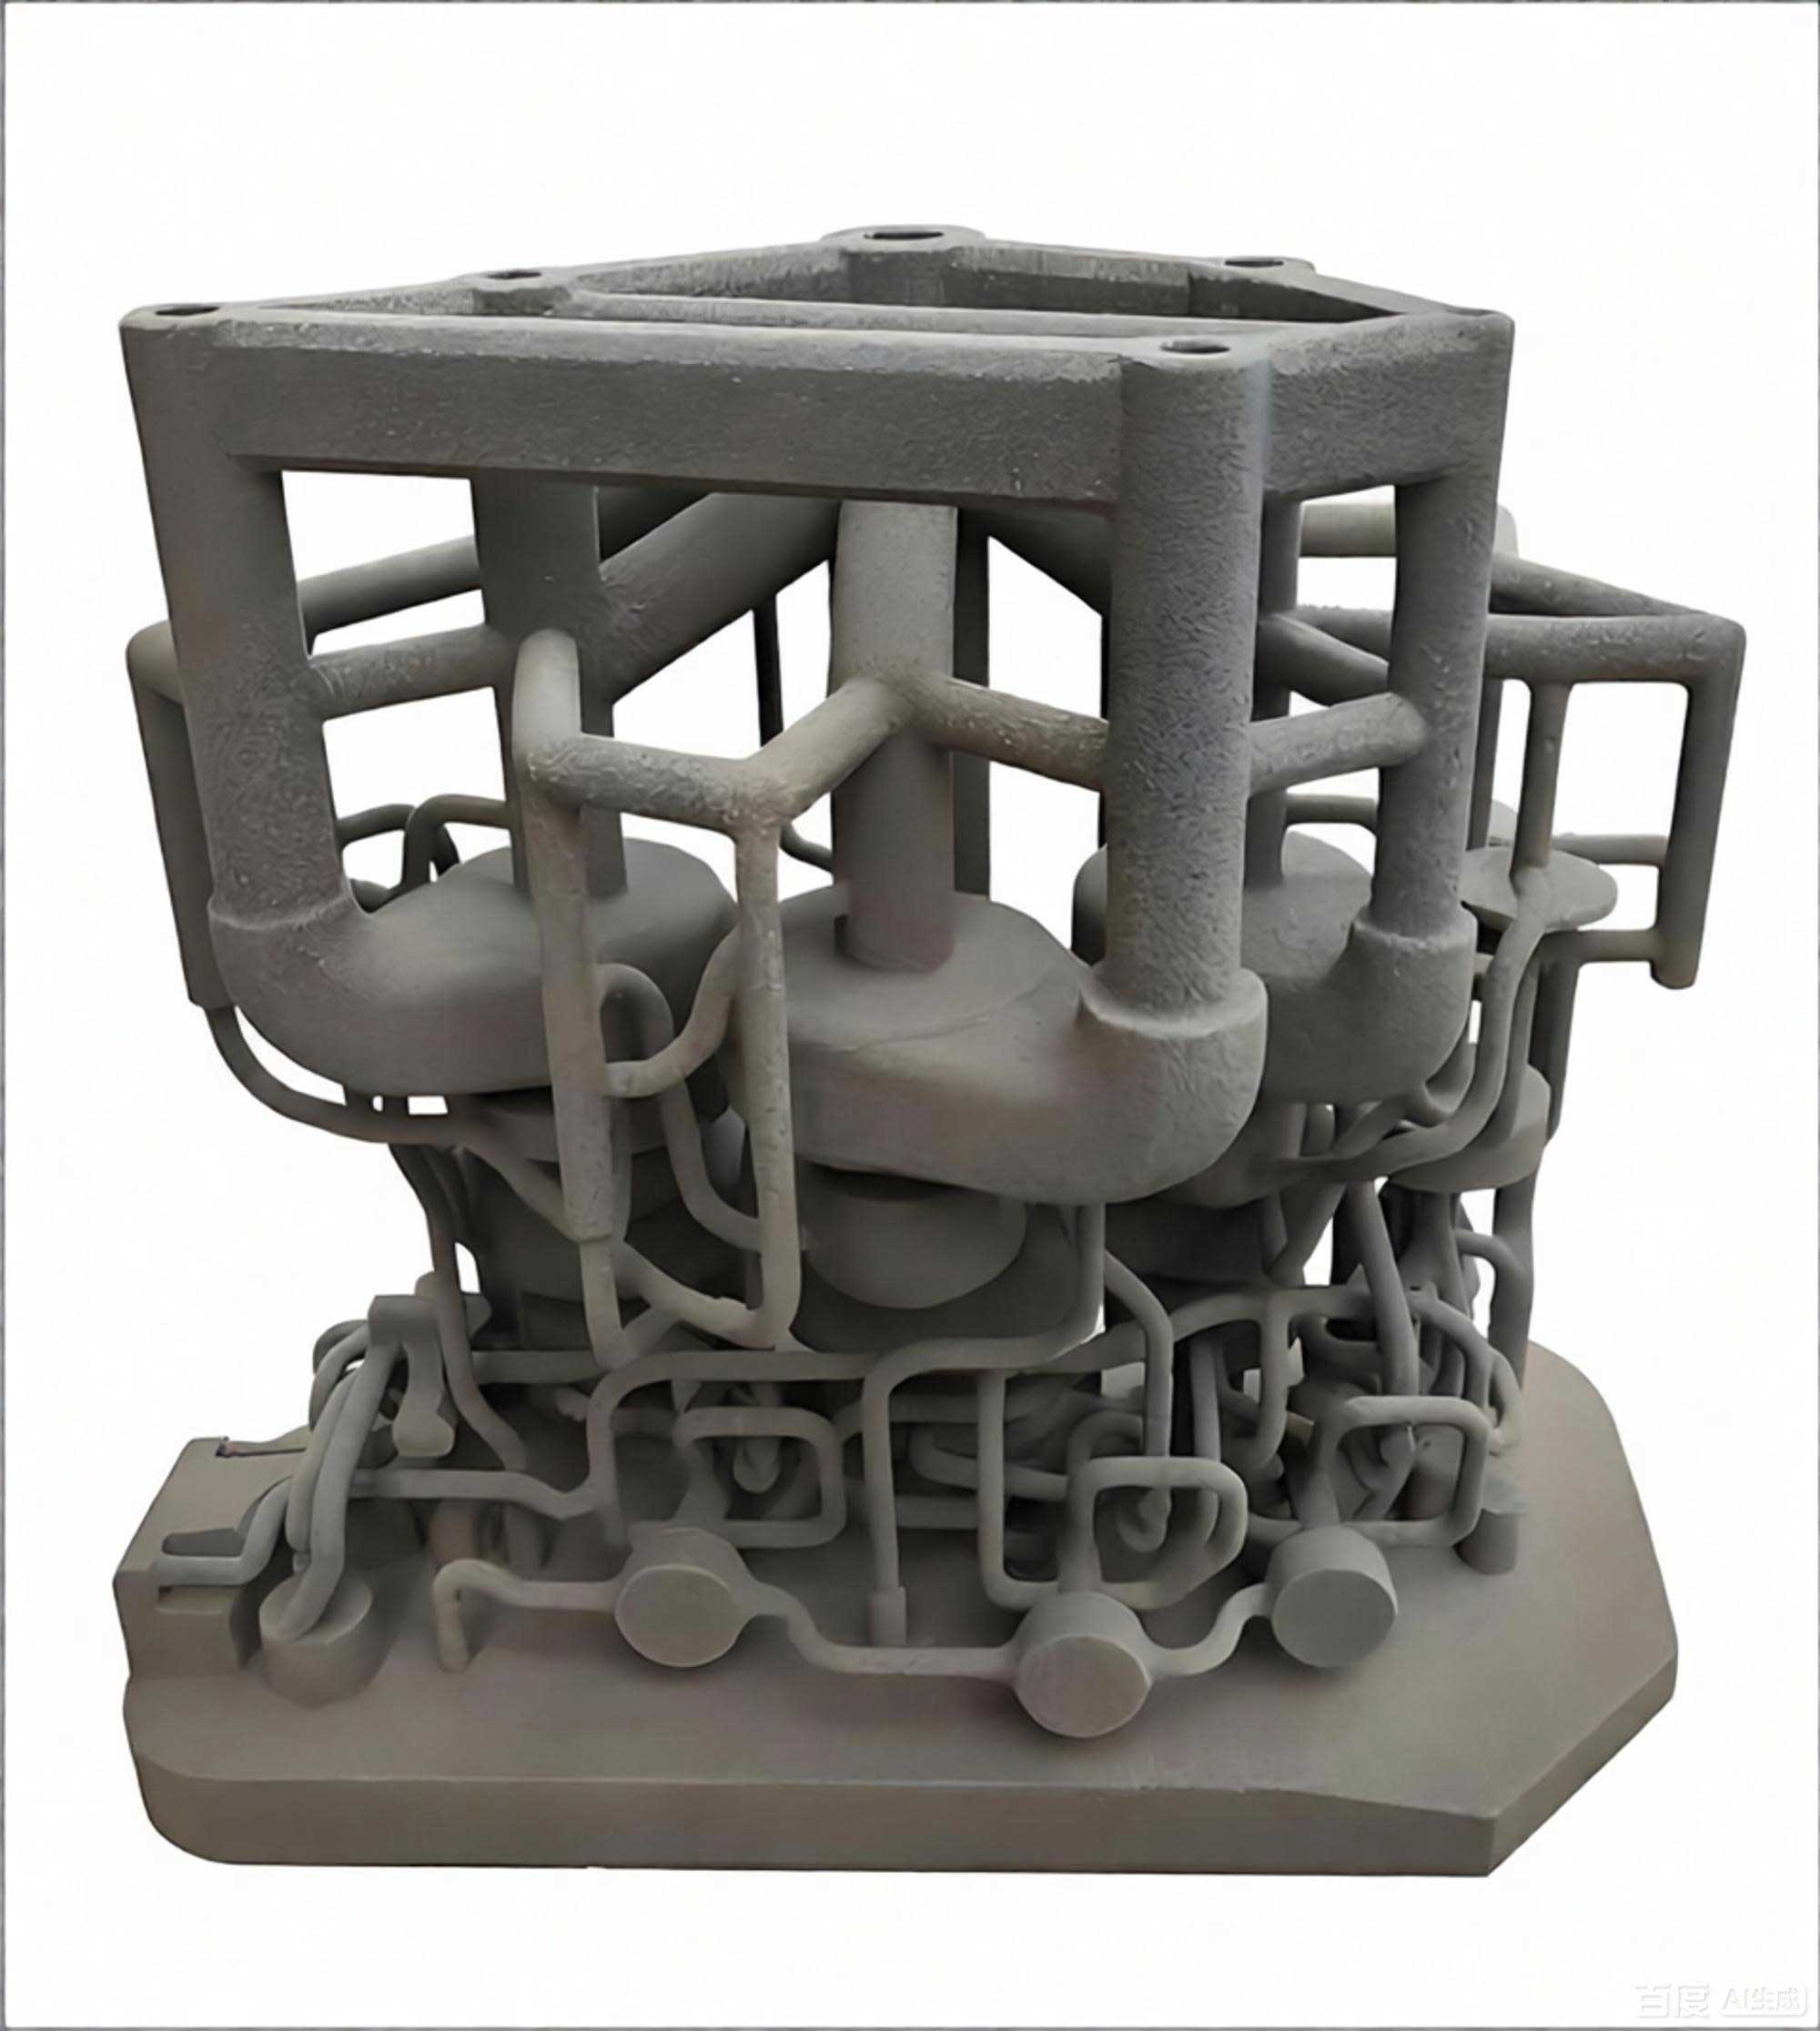
The most critical problems associated with 3d sand printing include insufficient compactness of the printed sand mold, relatively low mechanical strength, small sand particle sizes that lead to poor permeability and collapsibility, higher gas evolution, and the inability to simultaneously produce molds with different local properties. Traditional compaction techniques such as jolting, squeezing, sand slinging, blowing, and air impulse compaction are not directly applicable to the layer-by-layer deposition process of 3d sand printing. Therefore, the initial strength of the printed mold is usually achieved by adding more binder. Excessive binder addition, however, reduces permeability, increases gas evolution, and makes burnout and collapsibility worse. Additionally, the sand grain size used in 3d sand printing is often much smaller than that used in conventional foundries, which further reduces the permeability of the final mold. To overcome these drawbacks, new methods must be developed to compact each printed layer without interfering with the digital manufacturing workflow. In this work, I have focused on two novel approaches: a rolling compaction process applied during the layer-by-layer construction of 3d sand printing, and a spatial meshing design that creates a supporting cellular structure inside the sand mold. These methods aim to improve the density and strength of the sand mold while simultaneously reducing binder consumption and enhancing gas evacuation capabilities.
Rolling Compaction Principle and Experimental Setup
The first proposed approach is rolling compaction, which is inspired by the working principle of a road roller used to flatten and densify asphalt. In the context of 3d sand printing, a cylindrical roller is installed inside the printing chamber to press the freshly spread sand layer before the binder is applied. The roller moves across the surface of the sand bed, forcing the sand particles to rearrange into a tighter packing configuration. This reduces the void volume between particles and increases the number of contact points, thereby raising the green strength of the sand structure after binder curing. The process is illustrated by the fact that before rolling, the particles are loosely packed with large intergranular spaces; after rolling, the particles are displaced and slide closer together, yielding a much denser arrangement.
To simulate the layer-by-layer nature of 3d sand printing, I designed an experimental platform with an adjustable lifting table. This platform allows precise control of the sand layer thickness and the amount of vertical displacement caused by the rolling roller. The rolling compaction process is carried out after each layer is spread, exactly as it would be in a real 3d sand printing cycle. A schematic of the layered rolling compaction method can be described as follows: after a sand layer is evenly spread on the build platform, the roller traverses the top surface and presses the sand downward. The total reduction in height of that layer is the rolling reduction, also referred to as the press-down amount. After rolling, the top surface is smooth and dense. The subsequent layer of sand is then spread on top, and the process is repeated. Because the compaction only affects a shallow area under the roller, the dimensional accuracy of the lower layers is not adversely affected.
In order to study the influence of various process parameters on the mechanical properties of the final sand mold, I conducted a comprehensive set of experiments using both conventional foundry sand and sand specially formulated for 3d sand printing. The parameters varied included the rolling layer thickness, the rolling reduction, the roller diameter, the linear velocity of the roller surface, and the number of rolling passes. For each parameter combination, block specimens of dimensions 200 mm × 200 mm × 200 mm were produced. From these blocks, standard test specimens were machined using a digital CNC-free precision forming machine. The properties measured were tensile strength, compressive strength, bending strength, permeability, and compaction rate. The compaction rate is defined as the percentage decrease in the height of the sand bed after rolling relative to the original sand height before rolling. A higher compaction rate indicates a denser sand structure.
The experimental procedure was carefully planned to mimic the actual 3d sand printing process. We used resin sand with a binder content of 1.3% and a hardener content of 0.45% for the conventional sand tests. For the 3d sand printing sand, the binder content was reduced to 1.0% and the hardener to 0.3%, because the particle size was much finer. The conventional sand had an average particle size of 40 mesh, while the 3d sand printing sand was in the range of 100/200 mesh. Mechanical strength tests were performed 72 hours after specimen preparation to ensure complete curing of the binder.
Rolling Compaction Results on Conventional Foundry Sand
First, I investigated the uniformity of the sand mold properties in different spatial directions. Using a fixed rolling layer thickness of 2.5 mm, a rolling reduction of 2 mm, a roller diameter of 40 mm, a roller surface velocity of 0.2 m/s, and one rolling pass, I machined test specimens from seven different positions along each of the three principal axes: x (parallel to the rolling direction), y (parallel to the roller axis), and z (layer stacking direction). The results are shown in the following tables.
Effect of Height (z Direction)
| z (mm from bottom) | Bending Strength (MPa) | Tensile Strength (MPa) | Compressive Strength (MPa) | Permeability | Compaction Rate (%) |
|---|---|---|---|---|---|
| 25 | 1.194 | 1.052 | 2.561 | 580 | 28 |
| 50 | 1.165 | 1.034 | 2.328 | 585 | 25 |
| 75 | 1.125 | 0.995 | 2.191 | 590 | 23 |
| 100 | 1.071 | 0.942 | 1.979 | 600 | 20 |
| 125 | 1.005 | 0.872 | 1.845 | 615 | 17 |
| 150 | 0.955 | 0.812 | 1.705 | 630 | 14 |
| 175 | 0.873 | 0.691 | 1.598 | 650 | 13 |
The results clearly show that the lower portions of the sand mold, i.e., those closer to the build platform, exhibit higher strength and lower permeability. This happens because every rolling pass on the upper surface transmits a compressive force throughout the entire sand body. The bottom layers are repeatedly compacted as the process proceeds. Consequently, the density and strength gradually decrease from bottom to top. The tensile strength at a distance of 25 mm from the bottom is about 40% higher than that at 175 mm, while permeability decreases by about 12%. This finding indicates that in actual 3d sand printing, the upper portions of the mold may require additional rolling passes to achieve a uniform strength distribution.
Effect of Position along the Roller Axis (x Direction)
| x (mm from one side) | Bending Strength (MPa) | Tensile Strength (MPa) | Compressive Strength (MPa) | Permeability | Compaction Rate (%) |
|---|---|---|---|---|---|
| 25 | 0.906 | 0.743 | 1.725 | 565 | 28.5 |
| 50 | 0.872 | 0.682 | 1.664 | 585 | 27.2 |
| 75 | 0.824 | 0.660 | 1.624 | 590 | 26.5 |
| 100 | 0.810 | 0.651 | 1.592 | 590 | 26.0 |
| 125 | 0.822 | 0.649 | 1.628 | 595 | 26.3 |
| 150 | 0.869 | 0.675 | 1.650 | 575 | 27.1 |
| 175 | 0.901 | 0.738 | 1.713 | 560 | 28.6 |
In the direction parallel to the roller axis, the properties are symmetric about the center of the mold. The central region (x = 100 mm) experiences the lowest strength and the highest permeability, while the regions near the side walls have higher strength and lower permeability. This is attributed to the restraint of the side walls. During rolling, the sand particles in the center are in equilibrium under the applied forces, whereas particles near the walls are forced toward the center, effectively receiving a greater amount of compaction. Thus, the density near the walls is higher.
Effect of Position along the Rolling Direction (y Direction)
| y (mm from one end) | Bending Strength (MPa) | Tensile Strength (MPa) | Compressive Strength (MPa) | Permeability | Compaction Rate (%) |
|---|---|---|---|---|---|
| 25 | 1.196 | 0.993 | 2.514 | 590 | 26 |
| 50 | 1.203 | 1.045 | 2.485 | 580 | 28 |
| 75 | 1.191 | 0.986 | 2.598 | 585 | 26 |
| 100 | 1.189 | 0.951 | 2.457 | 590 | 26 |
| 125 | 1.201 | 1.034 | 2.521 | 580 | 27 |
| 150 | 1.191 | 1.003 | 2.492 | 580 | 28 |
| 175 | 1.189 | 0.963 | 2.534 | 590 | 27 |
Along the rolling direction, the properties are remarkably uniform. This indicates that the rolling compaction process produces a consistent effect as the roller advances, which is a desirable characteristic for industrial applications.
Influence of Rolling Layer Thickness
Next, I studied the effect of the thickness of each sand layer that is spread before rolling. The rolling reduction was fixed at 2.5 mm, roller diameter at 40 mm, roller surface velocity at 0.2 m/s, and the number of passes was one. The layer thickness was varied from 2.5 mm to 12.5 mm. The results are presented below.
| Layer Thickness (mm) | Bending Strength (MPa) | Tensile Strength (MPa) | Compressive Strength (MPa) | Permeability | Compaction Rate (%) |
|---|---|---|---|---|---|
| 0 (no rolling) | 0.905 | 0.605 | 1.221 | 1620 | 0 |
| 2.5 | 1.401 | 1.128 | 3.710 | 480 | 30.43 |
| 5 | 1.358 | 1.113 | 3.543 | 500 | 30.13 |
| 7.5 | 1.294 | 0.993 | 2.975 | 570 | 23.81 |
| 10 | 1.194 | 0.869 | 1.976 | 650 | 20.00 |
| 12.5 | 1.149 | 0.807 | 1.670 | 700 | 16.67 |
The data clearly indicate that smaller layer thicknesses result in higher strengths and compaction rates, accompanied by a moderate reduction in permeability. When the layer thickness is reduced from 12.5 mm to 2.5 mm, the bending strength increases from 1.149 MPa to 1.401 MPa, and the compaction rate rises from 16.67% to 30.43%. It is interesting to note that the differences between 2.5 mm and 5 mm are relatively small. A layer thickness of 5 mm already yields a bending strength improvement of 50.1% compared with the unrolled specimen. To quantify the relationship between layer thickness and strength, I performed regression analysis on the data (excluding the unrolled specimen). The following cubic equations were derived:
Bending strength:
$$ \sigma_{bending} = 0.0004 l^3 – 0.0096 l^2 + 0.0399 l + 1.3532,\quad R^2 = 0.9965 $$
Tensile strength:
$$ \sigma_{tensile} = 0.0009 l^3 – 0.0212 l^2 + 0.1127 l + 0.965,\quad R^2 = 0.9998 $$
Compressive strength:
$$ \sigma_{compressive} = 0.0058 l^3 – 0.1394 l^2 + 0.7563 l + 2.5828,\quad R^2 = 0.9943 $$
where \(l\) is the layer thickness in mm. Differentiating these equations with respect to \(l\) reveals that the rate of decrease in strength gradually diminishes as the layer thickness increases. Thus, there is an optimal range of layer thickness where a further reduction only yields marginal strength improvement. For practical purposes, a layer thickness of 2.5 mm to 5 mm provides a good balance between strength and productivity.
Influence of Rolling Reduction
The rolling reduction is the amount by which the roller presses down on the sand layer. In this series of experiments, the layer thickness was fixed at 2.5 mm, roller diameter at 40 mm, velocity at 0.2 m/s, and one pass was performed. The rolling reduction was varied from 0.5 mm to 2.5 mm. The results are shown in the table below.
| Rolling Reduction (mm) | Bending Strength (MPa) | Tensile Strength (MPa) | Compressive Strength (MPa) | Permeability | Compaction Rate (%) |
|---|---|---|---|---|---|
| 0 | 0.905 | 0.605 | 1.221 | 1620 | 0 |
| 0.5 | 1.151 | 0.815 | 1.730 | 680 | 16.67 |
| 1.0 | 1.235 | 0.912 | 2.380 | 610 | 26.44 |
| 1.5 | 1.294 | 0.993 | 2.970 | 550 | 28.89 |
| 2.0 | 1.369 | 1.089 | 3.510 | 500 | 30.43 |
| 2.5 | 1.401 | 1.128 | 3.710 | 480 | 31.91 |
The general trend is that increasing the rolling reduction improves strength and compaction rate. However, the improvement rate diminishes as the reduction becomes large. For example, increasing the reduction from 2.0 mm to 2.5 mm only raises the bending strength from 1.369 MPa to 1.401 MPa. If the reduction is too large, some sand may be squeezed out laterally and not fully pressed into the mold, resulting in material waste. The regression equations for strength as functions of rolling reduction \(h\) are given below.
$$ \sigma_{bending} = -0.012 h^3 + 0.0289 h^2 + 0.0399 h + 1.3532,\quad R^2 = 0.9965 $$
$$ \sigma_{tensile} = -0.0273 h^3 + 0.0941 h^2 + 0.0859 h + 0.965,\quad R^2 = 0.9977 $$
$$ \sigma_{compressive} = -0.1867 h^3 + 0.5686 h^2 + 0.731 h + 1.25,\quad R^2 = 0.9995 $$
These equations confirm that the strength continues to increase with larger reductions, but the incremental gains diminish. In practice, the reduction should be chosen such that the roller does not lose contact with the sand and the entire pressed volume remains within the desired layer height.
Influence of Roller Diameter
In this test, the layer thickness was 2.5 mm, rolling reduction was 2.5 mm, velocity was 0.2 m/s, and one pass was used. Roller diameters of 40, 80, 120, 160, and 200 mm were tested. The results are summarized in the following table.
| Roller Diameter (mm) | Bending Strength (MPa) | Tensile Strength (MPa) | Compressive Strength (MPa) | Permeability | Compaction Rate (%) |
|---|---|---|---|---|---|
| 0 (no rolling) | 0.905 | 0.605 | 1.221 | 1620 | 0 |
| 40 | 1.401 | 1.128 | 3.710 | 480 | 30.43 |
| 80 | 1.385 | 1.033 | 3.820 | 475 | 28.09 |
| 120 | 1.412 | 1.045 | 3.920 | 480 | 29.82 |
| 160 | 1.420 | 1.110 | 3.610 | 475 | 29.36 |
| 200 | 1.381 | 1.091 | 3.620 | 480 | 29.05 |
The roller diameter has virtually no influence on the properties of the sand mold. All the strength values and permeability values remain within a narrow band. This surprising result suggests that the specific curvature of the roller is not a critical factor in the compaction of sand layers. In a real 3d sand printing machine, a small-diameter roller can be used to save space, without sacrificing performance.
Influence of Roller Surface Velocity
The linear velocity at the roller surface was varied from 0.1 m/s to 0.5 m/s. The layer thickness was 2.5 mm, reduction was 2.5 mm, roller diameter was 40 mm, and one pass was used. The results are listed below.
| Roller Velocity (m/s) | Bending Strength (MPa) | Tensile Strength (MPa) | Compressive Strength (MPa) | Permeability | Compaction Rate (%) |
|---|---|---|---|---|---|
| 0 | 0.905 | 0.605 | 1.221 | 1620 | 0 |
| 0.1 | 1.436 | 1.133 | 3.890 | 470 | 31.77 |
| 0.2 | 1.401 | 1.128 | 3.710 | 500 | 30.43 |
| 0.3 | 1.265 | 1.082 | 3.050 | 550 | 28.89 |
| 0.4 | 1.112 | 0.864 | 1.950 | 790 | 15.79 |
| 0.5 | 1.013 | 0.855 | 1.850 | 800 | 13.51 |
It is clear that lower velocities produce better compaction. At 0.1 m/s and 0.2 m/s, the strengths are similar. However, when the velocity exceeds 0.3 m/s, the properties deteriorate sharply. At high speeds, the roller begins to act like a scraper, simply pushing the sand ahead instead of pressing it into the layer. Therefore, the rolling velocity must be kept below a critical value to ensure effective compaction. A velocity of 0.2 m/s appears to be the best compromise between performance and productivity.
Influence of the Number of Rolling Passes
Finally, I tested the effect of performing multiple rolling passes on the same layer. The layer thickness was 2.5 mm, reduction was 2.5 mm, roller diameter was 40 mm, and velocity was 0.2 m/s. The number of passes was varied from zero to five. The results are shown below.
| Number of Passes | Bending Strength (MPa) | Tensile Strength (MPa) | Compressive Strength (MPa) | Permeability | Compaction Rate (%) |
|---|---|---|---|---|---|
| 0 | 0.905 | 0.605 | 1.221 | 1620 | 0 |
| 1 | 1.294 | 0.993 | 2.971 | 550 | 28.89 |
| 2 | 1.407 | 1.123 | 3.551 | 510 | 31.62 |
| 3 | 1.502 | 1.132 | 3.840 | 480 | 32.35 |
| 4 | 1.499 | 1.129 | 3.842 | 480 | 32.63 |
| 5 | 1.481 | 1.130 | 3.815 | 480 | 32.63 |
Increasing the number of passes improves the strength up to three passes. Beyond three passes, there is no significant benefit; the properties reach a plateau. This means that the sand layer reaches a near-maximum density after only three passes. Additional passes would only waste time and energy. Therefore, two to three passes are recommended for achieving a high density without sacrificing cycle time.
Rolling Compaction Results on 3D Printing Sand
After the successful demonstration on conventional foundry sand, I evaluated the rolling compaction process specifically for sand used in 3d sand printing. This sand is characterized by a much finer particle size (100/200 mesh) and a higher binder demand. The general test conditions were adapted: the layer thickness was set to 1 mm, the rolling reduction to 1 mm, the roller diameter to 10 mm, and the velocity to 0.2 m/s as the baseline. The results are presented below.
Effect of Layer Thickness for 3D Printing Sand
The layer thickness was varied from 1 mm to 5 mm, while the rolling reduction was fixed at 1 mm, roller diameter at 10 mm, velocity at 0.2 m/s, and one pass was used. The results are listed below.
| Layer Thickness (mm) | Bending Strength (MPa) | Tensile Strength (MPa) | Compressive Strength (MPa) | Permeability | Compaction Rate (%) |
|---|---|---|---|---|---|
| 0 | 1.512 | 1.288 | 4.801 | 320 | 0 |
| 1 | 2.542 | 2.051 | 7.261 | 150 | 30.36 |
| 2 | 2.391 | 2.004 | 7.091 | 165 | 25.00 |
| 3 | 2.247 | 1.845 | 6.832 | 185 | 23.83 |
| 4 | 2.021 | 1.605 | 6.531 | 210 | 20.08 |
| 5 | 1.924 | 1.425 | 6.041 | 240 | 16.67 |
Similar to the conventional sand, thinner layers yield higher strengths. At a layer thickness of 1 mm, the bending strength reaches 2.542 MPa compared with 1.512 MPa for the unrolled sample, which is a 68% improvement. The compaction rate is 30.36%. Regression equations for the strengths as functions of layer thickness \(l\) are shown below.
$$ \sigma_{bending} = 0.0102 l^3 – 0.1201 l^2 + 0.278 l + 2.381,\quad R^2 = 0.99 $$
$$ \sigma_{tensile} = 0.0143 l^3 – 0.1538 l^2 + 0.3219 l + 1.867,\quad R^2 = 0.9994 $$
$$ \sigma_{compressive} = -0.0083 l^3 + 0.0263 l^2 – 0.2044 l + 7.4502,\quad R^2 = 0.9994 $$
Effect of Rolling Reduction for 3D Printing Sand
Here, the layer thickness was 1 mm, roller diameter was 10 mm, velocity was 0.2 m/s, and one pass was used. The rolling reduction was varied from 0.2 mm to 1.0 mm. The results are presented below.
| Rolling Reduction (mm) | Bending Strength (MPa) | Tensile Strength (MPa) | Compressive Strength (MPa) | Permeability | Compaction Rate (%) |
|---|---|---|---|---|---|
| 0 | 1.512 | 1.288 | 4.801 | 320 | 0 |
| 0.2 | 1.956 | 1.435 | 6.055 | 245 | 16.67 |
| 0.4 | 2.308 | 1.905 | 6.908 | 180 | 24.71 |
| 0.6 | 2.432 | 2.005 | 7.124 | 160 | 27.10 |
| 0.8 | 2.531 | 2.048 | 7.201 | 155 | 29.73 |
| 1.0 | 2.542 | 2.051 | 7.261 | 150 | 30.36 |
Again, larger reductions improve strength and compaction. The improvements from 0.8 mm to 1.0 mm are quite small, suggesting that the maximum practical compaction has been reached. The fitted equations for the strength as functions of rolling reduction \(h\) are:
$$ \sigma_{bending} = 0.0117 h^3 – 0.1555 h^2 + 0.7178 h + 1.3532,\quad R^2 = 0.9957 $$
$$ \sigma_{tensile} = 0.0275 h^3 – 0.3183 h^2 + 1.2112 h + 0.5188,\quad R^2 = 0.9954 $$
$$ \sigma_{compressive} = 0.0517 h^3 – 0.5882 h^2 + 2.2291 h + 4.3678,\quad R^2 = 0.9979 $$
Effect of Roller Diameter for 3D Printing Sand
Roller diameters from 10 mm to 50 mm were tested with a layer thickness of 1 mm, reduction of 1 mm, velocity of 0.2 m/s, and one pass. The results are given in the following table.
| Roller Diameter (mm) | Bending Strength (MPa) | Tensile Strength (MPa) | Compressive Strength (MPa) | Permeability | Compaction Rate (%) |
|---|---|---|---|---|---|
| 0 | 1.512 | 1.288 | 4.801 | 320 | 0 |
| 10 | 2.542 | 2.051 | 7.261 | 150 | 30.36 |
| 20 | 2.539 | 2.048 | 7.271 | 155 | 29.22 |
| 30 | 2.534 | 2.054 | 7.254 | 150 | 28.96 |
| 40 | 2.551 | 2.061 | 7.251 | 155 | 30.48 |
| 50 | 2.549 | 2.043 | 7.769 | 145 | 31.34 |
As with conventional sand, the roller diameter shows almost no effect on the resulting properties. This demonstrates that the compaction mechanism is governed mainly by the reduction and the velocity, not by the radius of the roller. Therefore, designers of 3d sand printing equipment have great freedom in choosing the roller size.
Effect of Roller Velocity for 3D Printing Sand
In this experiment, the layer thickness was 1 mm, reduction was 1 mm, roller diameter was 10 mm, and one pass was used. The velocity was varied from 0.1 to 0.5 m/s. The results are shown below.
| Roller Velocity (m/s) | Bending Strength (MPa) | Tensile Strength (MPa) | Compressive Strength (MPa) | Permeability | Compaction Rate (%) |
|---|---|---|---|---|---|
| 0 | 1.512 | 1.288 | 4.801 | 320 | 0 |
| 0.1 | 2.601 | 2.094 | 7.322 | 140 | 31.82 |
| 0.2 | 2.542 | 2.051 | 7.261 | 150 | 30.36 |
| 0.3 | 2.452 | 1.931 | 7.105 | 155 | 29.22 |
| 0.4 | 2.351 | 1.821 | 6.954 | 165 | 28.44 |
| 0.5 | 1.902 | 1.511 | 6.151 | 245 | 15.22 |
For the fine 3d sand printing sand, the critical velocity is higher than for conventional sand. The properties remain acceptable up to 0.4 m/s, while a sudden degradation occurs between 0.4 and 0.5 m/s. This indicates that fine sand can tolerate higher rolling speeds, which is beneficial for the cycle time of 3d sand printing equipment.
Effect of Number of Passes for 3D Printing Sand
Finally, the number of rolling passes was varied from one to five. The layer thickness was 1 mm, reduction was 1 mm, roller diameter was 10 mm, and velocity was 0.2 m/s. The results are as follows.
| Number of Passes | Bending Strength (MPa) | Tensile Strength (MPa) | Compressive Strength (MPa) | Permeability | Compaction Rate (%) |
|---|---|---|---|---|---|
| 0 | 1.512 | 1.288 | 4.801 | 320 | 0 |
| 1 | 2.542 | 2.051 | 7.261 | 150 | 30.36 |
| 2 | 2.561 | 2.088 | 7.353 | 140 | 31.58 |
| 3 | 2.601 | 2.113 | 7.435 | 135 | 32.53 |
| 4 | 2.612 | 2.131 | 7.458 | 135 | 32.76 |
| 5 | 2.602 | 2.128 | 7.452 | 135 | 32.76 |
Just like conventional sand, the strength increases marginally with additional passes, but the changes are almost negligible after the first pass. For the fine sand, a single pass already provides most of the beneficial compaction. Additional passes only slightly improve the density. Thus, in practice, a single pass is adequate for 3d sand printing to maintain high productivity.
Comparative Analysis of Conventional and 3D Printing Sands
Comparing the results from the conventional foundry sand with those from the 3d sand printing sand reveals several similarities and differences. First, the effects of process parameters follow the same general trends: smaller layer thickness, larger rolling reduction, lower velocity, and more passes all improve the compaction and strength. The roller diameter has no significant effect in either case. Second, the relative improvement due to rolling compaction is lower for the fine 3d sand printing sand. For example, the conventional sand showed strength improvements of 100% or more, while the 3d sand printing sand typically improved by only 30% to 50%. This is because the fine sand is already quite densely packed under the natural spreading process, leaving fewer voids to be eliminated by rolling. Third, the critical velocity for effective rolling is higher for the fine sand. The conventional sand suffered a severe loss of compaction when the velocity exceeded 0.2 m/s, while the 3d sand printing sand retained good compaction up to 0.4 m/s. This suggests that fine-grained sand is less sensitive to high-speed rolling, making it more compatible with rapid layer deposition cycles.
Another interesting observation is related to the compaction rate. The compaction rate is defined as the ratio of the vertical reduction to the original layer thickness. For conventional sand, a compaction rate of about 30% is achieved with a rolling reduction of 2.5 mm on a 2.5 mm layer. For 3d sand printing sand, a similar compaction rate of around 30% is obtained with a reduction of 1 mm on a 1 mm layer. In both cases, the maximum compaction rate is approximately 30%, which implies that the rolling process can compress the sand layer to roughly 70% of its original volume. Beyond this point, the sand particles are already in close contact, and further compression is not possible without causing deformation or damage.
I also compared the effect of rolling on the ratio of reduction to layer thickness. For the conventional sand, the strength continued to increase even up to a ratio of 1 (i.e., reduction equals layer thickness). For the fine sand, the strength reached a plateau at a ratio of about 0.8 to 1.0. This indicates that the fine sand becomes fully compacted at a lower reduction ratio due to its smaller particle size and better packing ability.
Validation of Rolling Compaction in an SLS Printer
To further verify the applicability of rolling compaction to an actual 3d sand printing system, I conducted a validation test on a selective laser sintering (SLS) machine. In this test, the layer thickness was 2 mm, and a rolling reduction of 0.03 mm was applied. The SLS process used resin-coated sand. After printing, the sand mold was baked at 232 ± 5 °C for 2 minutes, and then the tensile strength was measured after 72 hours. The results showed that the unrolled sample had a tensile strength of 6.0 MPa, while the rolled sample reached 6.3 MPa, representing a 5% improvement. Although this improvement is modest, it confirms that rolling compaction can be integrated into 3d sand printing to increase density and strength. The smaller improvement compared to the previous experiments is expected because the resin-coated sand used in SLS already has a high initial strength that is less dependent on particle packing density. This validation demonstrates the concept that rolling compaction is indeed feasible in 3d sand printing.
Spatial Meshing Method for 3D Printing Sand Molds
The second major contribution of this work is the development of a spatial meshing method for 3d sand printing. Traditional 3d sand printing produces a uniformly dense solid mold with identical properties throughout its entire volume. This is often inefficient because the core of the mold does not need to be as strong as the surface that comes into direct contact with the molten metal. In fact, the interior of a sand mold merely serves to support the surface layer and to vent gases. Therefore, I proposed to design the interior of the sand mold as a three-dimensional grid of empty cavities. The outer surface of the mold remains solid to provide the required strength and surface finish. The inner region is partitioned into a lattice of cells, where only the lattice skeleton is printed with binder, while the cavities are filled with loose, unbinded sand. This approach reduces the amount of binder consumed, improves the permeability of the mold, and decreases the gas evolution during casting. It also improves the collapsibility of the mold after casting, which is beneficial for cleaning and recycling.
In the spatial meshing design, the solid outer layer is analogous to the face sand of a conventional mold, while the cellular interior acts as the backing sand. Because 3d sand printing is a digital process, the spatial meshing can be directly incorporated into the CAD model. In practice, the printer prints the skeleton by depositing binder only on the designated walls of the cells. The cavities remain filled with loose sand, which is not hardened. The loose sand provides some support and also serves as a pathway for gas escape due to its high permeability. The critical parameters of the spatial meshing include the shape of the cells, the size of the cells, the thickness of the skeleton walls (i.e., the distance between adjacent cell cavities), and the arrangement of the cells in space. I systematically studied these parameters and measured their influence on the tensile strength, bending strength, compressive strength, permeability, and binder reduction of the final sand mold.
In all the experiments, a solid reference specimen was printed without any meshing, yielding a tensile strength of 1.616 MPa, a bending strength of 1.823 MPa, a compressive strength of 5.802 MPa, and a permeability of 62. These values serve as the baseline for comparison.
Influence of Cell Shape
I first compared cubic cells and spherical cells. Both types were designed with an equivalent characteristic size of 4 mm (for the cube, the side length was 4 mm; for the sphere, the diameter was 4 mm). The skeleton wall thickness between the cells was 1 mm. The test specimens were printed and tested after 72 hours. The results are shown in the table below.
| Cell Shape | Tensile Strength (MPa) | Bending Strength (MPa) | Compressive Strength (MPa) | Permeability | Binder Reduction (%) |
|---|---|---|---|---|---|
| Cubic (4 mm) | 1.124 | 1.305 | 4.921 | 160 | 29.6 |
| Spherical (4 mm) | 1.174 | 1.353 | 5.089 | 160 | 50.3 |
| Solid | 1.616 | 1.823 | 5.802 | 62 | – |
The spherical cell design yields slightly higher strength values and exactly the same permeability as the cubic cell design, but the binder reduction is significantly larger: 50.3% versus 29.6%. This means that for the same mechanical performance, the spherical cells save almost half of the binder. The reason is that a sphere has a lower surface area per unit volume compared to a cube with the same characteristic dimension, so the total length of the printed skeleton is smaller, resulting in less binder being applied. Thus, spherical cells are more advantageous than cubic cells.
Influence of Cell Size
For this series, cubic cells with side lengths of 2, 3, 4, 5, and 6 mm were used. The skeleton thickness between the cells was kept constant at 1 mm. The results are shown below.
| Cell Size (mm) | Bending Strength (MPa) | Tensile Strength (MPa) | Compressive Strength (MPa) | Permeability | Binder Reduction (%) |
|---|---|---|---|---|---|
| 2 | 1.395 | 1.234 | 4.832 | 150 | 29.6 |
| 3 | 1.248 | 0.971 | 4.451 | 170 | 42.2 |
| 4 | 0.998 | 0.623 | 3.512 | 190 | 51.2 |
| 5 | 0.281 | 0.164 | 1.132 | 250 | 57.9 |
| 6 | 0.258 | 0.118 | 0.912 | 230 | 63.0 |
As the cell size increases, the strength generally decreases and the permeability increases, because the volume fraction of the skeleton is reduced. However, there is a dramatic drop in strength when the cell size changes from 4 mm to 5 mm. At 5 mm and 6 mm, the strength becomes very low and may not be sufficient even for the backing sand. This indicates that the critical ratio between the cell size and the skeleton thickness is around 4:1. Beyond this ratio, the skeleton walls become too slender and buckle under load. Therefore, the practical cell size should not exceed 4 mm when the skeleton thickness is 1 mm.
Influence of Skeleton Thickness
In this experiment, cubic cells with a side length of 3 mm were used, and the skeleton thickness (i.e., the distance between the cavity boundaries) was varied from 1 mm to 3 mm. The results are presented below.
| Skeleton Thickness (mm) | Bending Strength (MPa) | Tensile Strength (MPa) | Compressive Strength (MPa) | Permeability | Binder Reduction (%) |
|---|---|---|---|---|---|
| 1 | 1.248 | 0.971 | 4.451 | 170 | 42.2 |
| 1.5 | 1.401 | 1.239 | 4.901 | 145 | 29.6 |
| 2 | 1.516 | 1.356 | 5.205 | 130 | 21.6 |
| 2.5 | 1.554 | 1.389 | 5.326 | 120 | 16.2 |
| 3 | 1.589 | 1.402 | 5.402 | 110 | 12.5 |
Increasing the skeleton thickness substantially improves the strength but also reduces the permeability and binder savings. A thickness of 1 mm still provides a compressive strength of 4.451 MPa, which is sufficient for backing sand. The permeability of 170 is about 174% higher than the solid mold. Since the goal is to minimize binder and maximize permeability, a skeleton thickness of 1 mm is preferred in most cases.
Influence of Cell Arrangement
For this study, spherical cells with a diameter of 3 mm were used, with a minimum skeleton thickness of 1 mm. The cells were arranged in four common lattice structures: simple cubic (SC), body-centered cubic (BCC), hexagonal close-packed (HCP), and face-centered cubic (FCC). The results are shown below.
| Arrangement | Bending Strength (MPa) | Tensile Strength (MPa) | Compressive Strength (MPa) | Permeability | Binder Reduction (%) |
|---|---|---|---|---|---|
| Simple Cubic | 1.652 | 1.413 | 5.589 | 135 | 16.6 |
| Body-Centered Cubic | 1.498 | 1.301 | 5.358 | 135 | 21.5 |
| Hexagonal Close-Packed | 1.285 | 1.194 | 5.135 | 150 | 23.4 |
| Face-Centered Cubic | 1.304 | 1.205 | 5.055 | 145 | 23.4 |
The simple cubic arrangement provides the highest strength because it has more vertical support rods. However, it also has the lowest binder reduction among the close-packed arrangements. The HCP and FCC arrangements offer a better balance between strength, permeability, and binder saving. They are analogous to the most efficient packing of spheres in nature, leading to a lower skeleton volume and higher porosity. For a backing sand application, the HCP arrangement is recommended because it combines excellent permeability with a reasonable strength and a binder reduction of 23.4%.
Influence of Gradient Meshing
In real castings, the surface of the mold experiences the highest thermal and mechanical loads, while the core mainly serves as a gas path. Therefore, I designed a gradient mesh where the cell size increases from the outer surface toward the center. Specifically, cube cells with an outer diameter (circumscribed sphere) starting at 4 mm at the center and decreasing gradually to 1.5 mm near the surface were used. The actual printed specimens had a gradient mesh that transitioned from a fine mesh near the outer shell to a coarse mesh in the center. The results are given below.
| Specimen Type | Tensile Strength (MPa) | Bending Strength (MPa) | Compressive Strength (MPa) | Permeability | Binder Reduction (%) |
|---|---|---|---|---|---|
| Gradient Mesh (0-4 mm) | 1.178 | 1.314 | 5.121 | 165 | 42.2 |
| Uniform 2 mm Cube | 1.234 | 1.395 | 4.832 | 150 | 29.6 |
| Solid | 1.616 | 1.823 | 5.802 | 62 | – |
The gradient mesh achieves a slightly higher permeability than the uniform 2 mm cube, while using only about 80% of the binder. The mechanical strength is comparable. The gradient design provides a smooth transition of properties from the dense surface to the porous interior, which mimics the dual-layer face/back sand structure of conventional molds. This is particularly useful for improving the collapsibility and gas removal in thick-wall castings.
Topological Skeleton Structures
To further enhance the permeability, I designed a topological skeleton structure that creates continuous, interconnected channels throughout the sand mold. The skeleton consists of rectangular bars with a 3 mm × 3 mm cross-section, arranged in a three-dimensional lattice with a spacing of 3 mm between the bars. The outer shell had a solid thickness of 5 mm. The test results are shown below.
| Specimen Type | Tensile Strength (MPa) | Bending Strength (MPa) | Compressive Strength (MPa) | Permeability | Binder Reduction (%) |
|---|---|---|---|---|---|
| Topological Skeleton | 1.101 | 0.926 | 4.114 | 160 | 50.0 |
| 3 mm Cube with 3 mm gap | 1.402 | 1.589 | 5.402 | 110 | 12.5 |
| Solid | 1.616 | 1.823 | 5.802 | 62 | – |
Compared to the uniform cube mesh with a gap of 3 mm, the topological skeleton exhibits a 45.5% higher permeability, while its strength is about 30% lower. This is because the topological skeleton has fewer vertical columns and larger open channels. The strength of 4.114 MPa in compression is still adequate for a backing sand, and the permeability of 160 represents a 158% improvement over the solid mold. The topological approach allows the gas to flow freely along the connected channels, which is very beneficial for preventing gas porosity defects in castings. Further improvements can be achieved through topology optimization algorithms, which seek to determine the optimal distribution of material within a design domain under given constraints. For example, using the variable density method, the optimization problem can be formulated as:
$$ \min_{\rho} \; C(\rho) = \mathbf{U}^T \mathbf{K} \mathbf{U} = \sum_{e=1}^{N} (\rho_e)^p \, \mathbf{u}_e^T \mathbf{k}_0 \mathbf{u}_e $$
$$ \text{subject to } \mathbf{K} \mathbf{U} = \mathbf{F}, \quad v(\rho) = \sum_{e=1}^{N} \rho_e v_e \le V^*, \quad 0 < \rho_{\min} \le \rho_e \le 1 $$
where \(\rho_e\) is the pseudo-density of element \(e\), \(p\) is the penalization power, \(\mathbf{k}_0\) is the stiffness matrix of a solid element, and \(V^*\) is the volume constraint. By solving this optimization, one can find a skeleton layout that maximizes stiffness while leaving sufficient open channels for permeability.
Conclusions
In this work, I have systematically investigated two novel methods to improve the performance of 3d sand printing molds. The first method is rolling compaction, which was applied to each sand layer during the layer-by-layer construction. The second method is spatial meshing, which redesigns the internal structure of the sand mold to reduce binder consumption and improve gas permeability. The main conclusions can be summarized as follows.
(1) Rolling compaction is a feasible technique for enhancing the density and strength of 3d sand printing molds. It can increase the strength of the sand mold by 10% to 80%, depending on the sand type and process parameters. The feasibility was validated on an SLS printer, where a 5% strength improvement was observed with a small rolling reduction.
(2) The parameters of rolling compaction influence the sand mold properties according to the following rules: smaller layer thickness and larger rolling reduction increase strength and compaction rate, while reducing permeability; lower rolling velocity yields better compaction, but the fine sand used in 3d sand printing can tolerate higher velocities than conventional sand; the roller diameter has no significant effect; and the number of passes has a limited effect, with the first pass providing the most benefit. The optimal parameters for conventional sand were found to be a layer thickness of 2.5 mm, a reduction of 2 mm, a velocity of 0.2 m/s, and one pass. For 3d sand printing sand, a layer thickness of 1 mm and a reduction of 1 mm at a velocity of 0.2 m/s produced the best results.
(3) The spatial meshing method can effectively reduce the binder consumption by 10% to 50%, increase the permeability by more than 100%, and lower the gas evolution. The strength of the meshed mold is reduced by 10% to 50%, but this is acceptable for the backing sand portion of the mold. Spherical cells are superior to cubic cells because they offer the same strength and permeability with substantially less binder.
(4) The cell size and skeleton thickness must be carefully balanced. For a skeleton thickness of 1 mm, the maximum practical cell size is about 4 mm. Larger cells lead to a sudden loss of strength. The HCP and FCC arrangements of spherical cells provide an excellent combination of permeability and binder savings. A gradient mesh with smaller cells near the surface and larger cells in the core offers a smooth transition of properties and achieves a 42.2% binder reduction. Topological skeleton structures create continuous gas channels and exhibit the highest permeability improvement, making them ideal for avoiding gas defects.
These two methods can be combined in a single 3d sand printing process: rolling compaction can be applied to the solid outer shell to ensure high surface strength, while the interior is printed with the spatial mesh pattern to reduce weight and binder. This integrated approach promises to make 3d sand printing more efficient, economical, and applicable to a wider range of casting production.