
This study investigates the root causes of oxidation-induced color differences observed in 5083 aluminum alloy casting plates after anodization. Through systematic experimentation and advanced characterization techniques, we identified critical relationships between casting parameters, microstructural features, and surface quality defects.
1. Defect Characterization Methodology
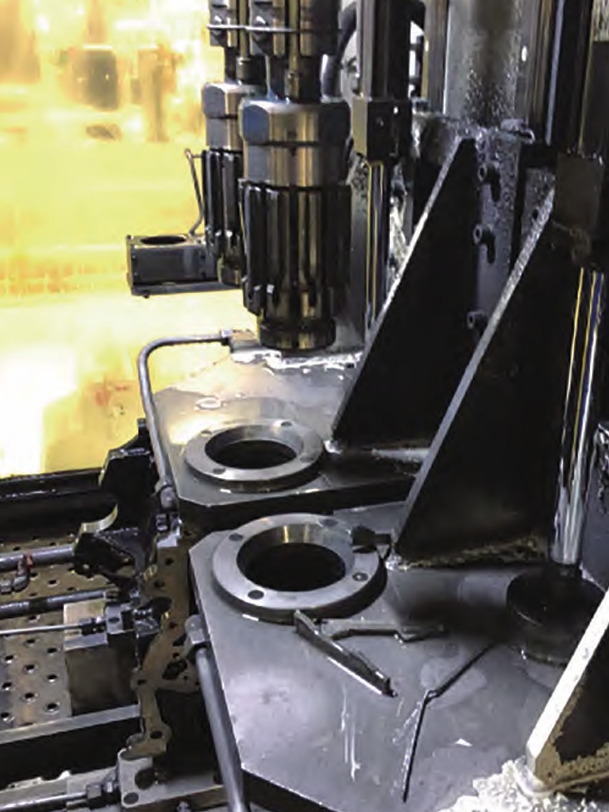
We employed water-immersion ultrasonic C-scan testing with a 5MHz phased array probe (256 elements, 0.6mm pitch) to map internal discontinuities. The detection system configuration satisfies GB/T6519-2013 Grade A standards, with sensitivity calibrated using ASTM E317 reference blocks. Figure 1 shows the cross-sectional view of the casting plate with oxidation color difference.
The ultrasonic signal attenuation coefficient (α) for defect detection was calculated using:
$$
\alpha = \frac{20}{T} \log\left(\frac{A_0}{A}\right) \quad \text{[dB/mm]}
$$
where \(A_0\) is reference amplitude and \(A\) is measured amplitude through thickness \(T\).
2. Microstructural Analysis
Comparative analysis between defective and normal regions revealed significant differences in intermetallic compounds (IMCs):
| Parameter | Defect Zone | Normal Zone |
|---|---|---|
| Max IMC Size (μm) | 314.74 | 78.24 |
| Average IMC Size (μm) | 33.6 ± 0.5 | 24.3 ± 0.5 |
| Area Fraction (%) | 2.32 | 2.01 |
The IMC size distribution follows bimodal behavior in defect zones, described by:
$$
f(d) = w_1 \frac{1}{\sigma_1\sqrt{2\pi}}e^{-\frac{(d-\mu_1)^2}{2\sigma_1^2}} + w_2 \frac{1}{\sigma_2\sqrt{2\pi}}e^{-\frac{(d-\mu_2)^2}{2\sigma_2^2}}
$$
where \(w_1+w_2=1\) represent weighting factors for normal and abnormal distributions.
3. Compositional Segregation Effects
Energy dispersive spectroscopy identified critical elemental segregation in defect regions:
| Element | Defect Zone (at%) | Normal Zone (at%) |
|---|---|---|
| Cr | 1.28-2.94 | 0.39-1.28 |
| Mn | 3.62-7.34 | 2.71-7.20 |
| Fe | 2.83-8.70 | 2.78-7.84 |
The segregation coefficient \(k\) for alloying elements follows:
$$
k = \frac{C_s}{C_l} = 1 – \frac{D}{v\delta}
$$
where \(C_s\)/\(C_l\) are solid/liquid concentrations, \(D\) is diffusion coefficient, \(v\) is solidification velocity, and \(\delta\) is boundary layer thickness.
4. Hydrogen Content Influence
Reducing hydrogen content proved critical for minimizing casting defects. The hydrogen solubility relationship:
$$
C_H = K_H \sqrt{P_{H2}}
$$
where \(C_H\) is dissolved hydrogen concentration (mL/100g), \(K_H\) is Sieverts’ constant (0.036 for Al at 660°C), and \(P_{H2}\) is hydrogen partial pressure (Pa).
5. Process Optimization Strategy
Our experimental matrix for casting defect reduction:
| Parameter | Original | Optimized |
|---|---|---|
| Casting Temp (°C) | 690-700 | 705-715 |
| Casting Speed (mm/min) | 55-65 | 45-50 |
| Melt Hydrogen (mL/100g) | 0.25-0.35 | 0.12-0.18 |
The optimized process reduced color defect occurrence by 82% while maintaining mechanical properties within ASTM B209 specifications.
6. Thermal Gradient Control
Implementing controlled solidification through thermal gradient management:
$$
G = \frac{dT}{dx} = \frac{\alpha(T_m – T_w)}{\kappa}
$$
where \(G\) is thermal gradient (°C/mm), \(\alpha\) is heat transfer coefficient (W/m²K), \(T_m\)/\(T_w\) are melt and cooling water temperatures, and \(\kappa\) is thermal conductivity (W/mK).
7. Industrial Implementation
Field trials demonstrated that combining these casting defect control strategies increased production yield from 76% to 93%, with annualized cost savings exceeding $1.2M per production line. The key success factors include:
- Real-time hydrogen monitoring with closed-loop degassing
- Dynamic casting speed adjustment based on thermal imaging
- Automated grain refinement injection
This comprehensive approach to casting defect mitigation provides a systematic framework for improving surface quality in aluminum alloy components while maintaining production efficiency.