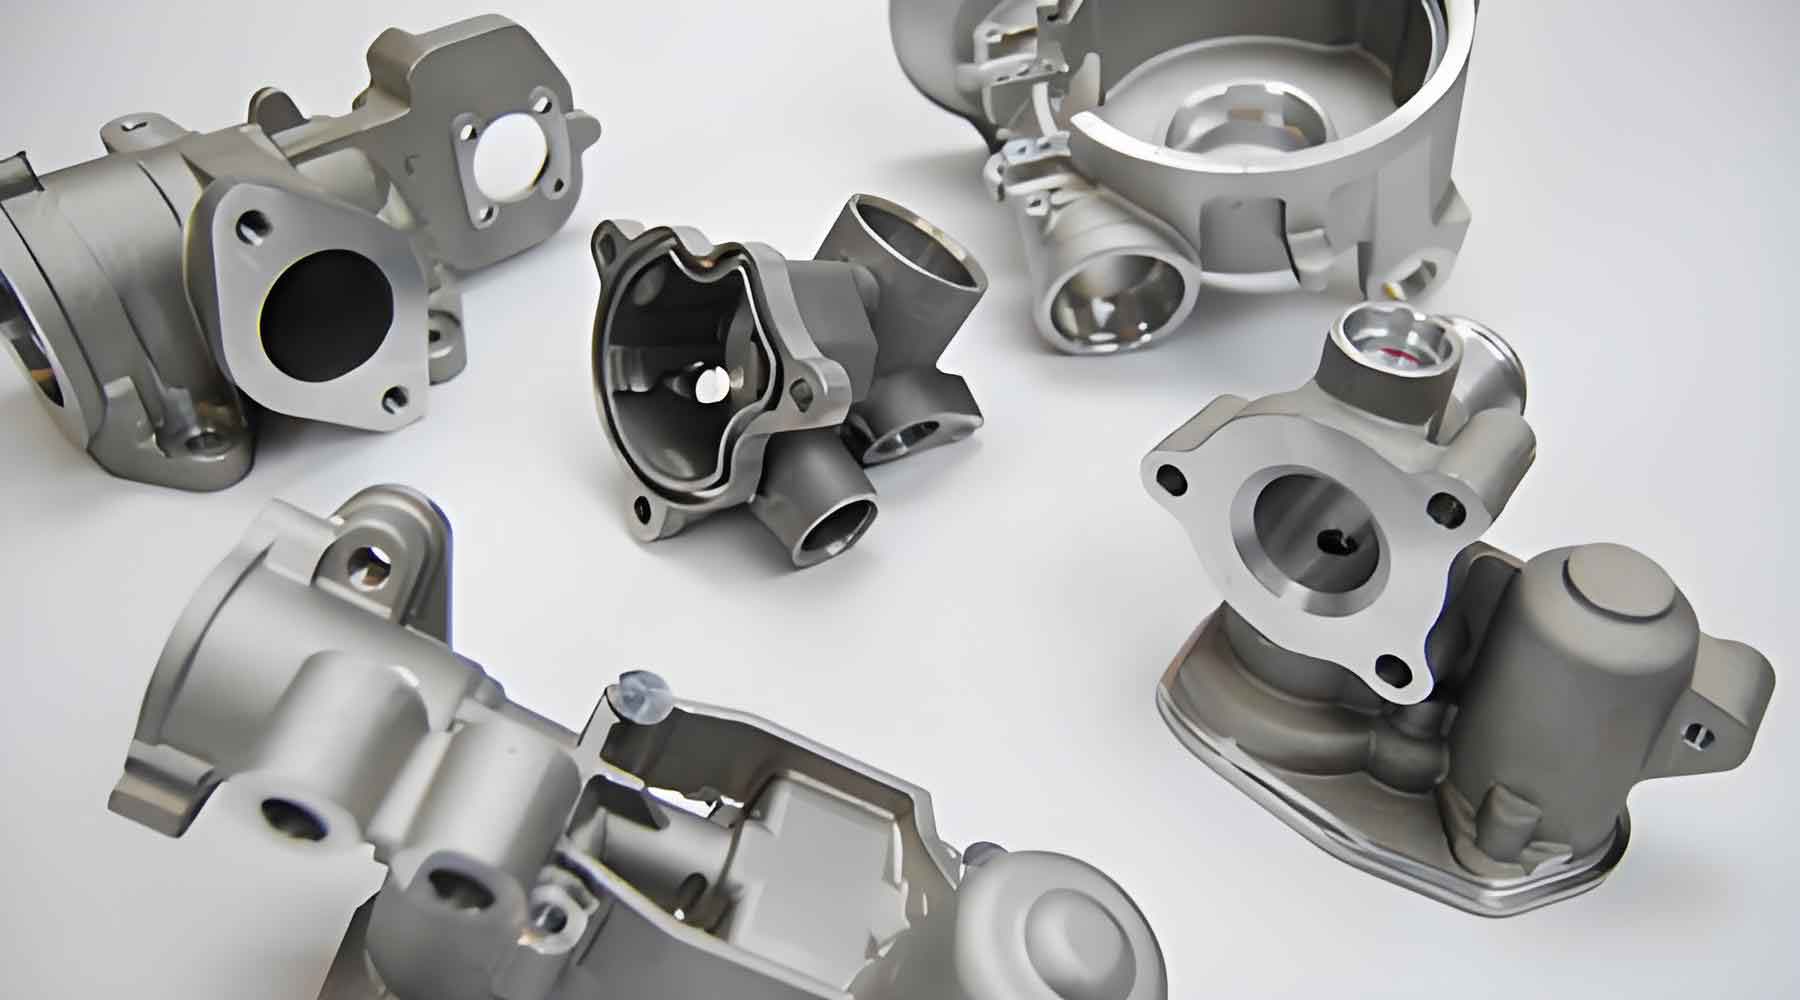
With the rapid advancement of digital manufacturing, 3D printing has revolutionized traditional precision investment casting by enabling direct fabrication of complex geometries, reducing lead times, and lowering prototyping costs. This synergy between additive manufacturing and casting processes unlocks unprecedented design flexibility while maintaining the high-dimensional accuracy (typically ±0.5 mm) inherent to precision investment casting.

1. Technological Convergence
The integration mechanism between 3D printing and precision investment casting follows:
$$ \text{Integration Efficiency} = \frac{T_{traditional} – T_{3D}}{T_{traditional}} \times 100\% $$
Where \( T_{traditional} \) represents conventional pattern-making time, and \( T_{3D} \) denotes 3D printing cycle time. Typical efficiency improvements range from 60% to 85%.
| Material Type | Melting Range (°C) | Ash Content (%) |
|---|---|---|
| Wax-based Patterns | 60-70 | ≤0.02 |
| Photopolymer Resins | 70-90 | ≤0.05 |
| PLA Hybrids | 170-220 | ≤0.1 |
2. Process Implementation
The thermal dynamics of dewaxing 3D-printed patterns follows:
$$ t_d = \frac{\rho V c_p \Delta T}{P\eta} $$
Where:
\( t_d \) = Dewaxing time (min)
\( \rho \) = Pattern density (g/cm³)
\( V \) = Pattern volume (cm³)
\( c_p \) = Specific heat capacity (J/g°C)
\( \Delta T \) = Temperature differential (°C)
\( P \) = Heating power (W)
\( \eta \) = Thermal efficiency coefficient
| Parameter | Traditional | 3D Hybrid |
|---|---|---|
| Pattern Making Time | 5-7 days | 8-12 hrs |
| Surface Roughness (Ra) | 3.2-6.3 μm | 1.6-3.2 μm |
| Minimum Wall Thickness | 1.5 mm | 0.8 mm |
3. Technical Advantages
The cost-benefit equation demonstrates:
$$ C_{savings} = (C_m + C_l) – (C_p + C_{post}) $$
Where:
\( C_m \) = Mold tooling costs
\( C_l \) = Labor costs
\( C_p \) = 3D printing costs
\( C_{post} \) = Post-processing expenses
4. Industrial Applications
Aerospace turbine blade manufacturing reveals:
$$ \text{Dimensional Accuracy} = \frac{\sum_{i=1}^n |D_{actual} – D_{design}|}{nD_{design}} \times 100\% $$
Field measurements show ≤0.3% deviation for 3D-printed precision investment casting patterns.
5. Challenges and Solutions
| Challenge | Solution | Efficacy |
|---|---|---|
| Residue Removal | Ultrasonic Cleaning | 98.7% Efficiency |
| Thermal Deformation | Graded Heating | ΔL ≤ 0.08% |
6. Future Perspectives
The evolution of precision investment casting with 3D printing follows:
$$ \text{Adoption Rate} = \frac{N_{3D}}{N_{total}} \times e^{kt} $$
Where \( k \) represents technological diffusion coefficient (current value 0.15-0.25), predicting 78-92% industrial adoption by 2030.
This technological integration continues to redefine precision investment casting through digital twin-enabled process optimization and AI-driven parameter adjustment, establishing new benchmarks for complex component manufacturing in aerospace, energy, and medical industries.
