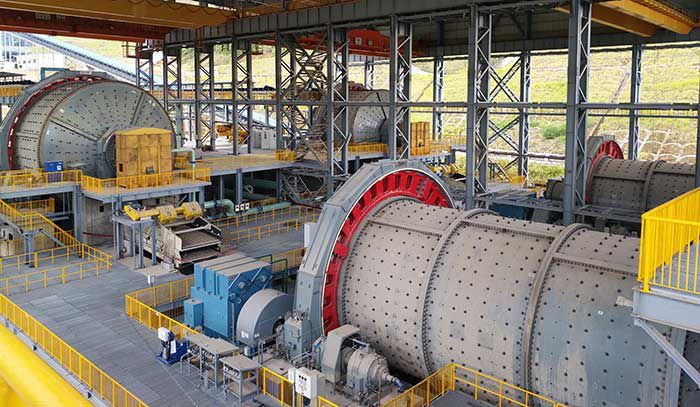
Grinding stands as the core process in mineral beneficiation, where the efficiency of the directly influences the overall technical and economic indicators of a concentrator. Key metrics for evaluating grinding efficiency include product size distribution, uniformity, and the unit throughput capacity of the ball mill. Parameters such as grinding media shape, size ratio, slurry solid-liquid ratio, and material-to-media mass ratio significantly impact grinding performance. Optimizing these parameters scientifically enhances mineral liberation, reduces overgrinding, and improves downstream separation efficiency. Current challenges include low intermediate particle content in coarse grinding products and excessive coarse particles, leading to suboptimal utilization coefficients. This study employs the utilization coefficient of the -0.074 mm fraction as the key metric to optimize grinding parameters using single-factor tests and Response Surface Methodology (RSM).

1. Experimental Materials and Methods
1.1 Raw Materials
Iron ore samples (0–20 mm) from Hebei, China, were crushed via a high-pressure roller mill and wet-screened using a 3 mm sieve. The undersize product served as feed material. XRD analysis identified magnetite as the primary iron mineral and quartz as the main gangue. Particle size distribution (Figure 2) showed significant mass in the 0.02–1.00 mm range, with a high proportion of -0.20 mm particles. Key size parameters were:
$$d_{10} = 0.0148 \text{mm}, \quad d_{50} = 0.137 \text{mm}, \quad d_{90} = 0.716 \text{mm}.$$
The coarse size distribution necessitated further grinding optimization.
| Size Fraction (mm) | Mass Percentage (%) | Cumulative (%) |
|---|---|---|
| +1.00 | 12.4 | 12.4 |
| -1.00 + 0.50 | 18.7 | 31.1 |
| -0.50 + 0.20 | 23.5 | 54.6 |
| -0.20 + 0.074 | 28.3 | 82.9 |
| -0.074 | 17.1 | 100.0 |
1.2 Experimental Design
Grinding tests used a ZQMϕ250×100 intelligent ball mill with steel media (diameters: 15, 17, 20, 25, 30 mm) proportioned by equal mass. The utilization coefficient of -0.074 mm (\(q_{-0.074}\)) was calculated as:
$$
q_{-0.074} = \frac{Q \times (\gamma_2 – \gamma_1)}{V},
$$
where \(Q\) = throughput (t/h), \(\gamma_1\), \(\gamma_2\) = -0.074 mm content in feed and overflow (%), and \(V\) = effective mill volume (m³).
Single-factor tests identified preliminary optimal parameters:
– Medium filling rate (\(C\)): 40%
– Material-to-ball ratio (\(B\)): 0.057
– Slurry concentration (\(A\)): 70%
Yielding \(q_{-0.074} = 1.06 \text{t/(m³·h)}\). To capture parameter interactions, RSM-based Box-Behnken Design (BBD) was employed with three factors and three levels:
| Factor | Symbol | -1 | 0 | +1 |
|---|---|---|---|---|
| Slurry Concentration (%) | A | 65 | 70 | 75 |
| Material-to-Ball Ratio | B | 0.05 | 0.06 | 0.07 |
| Medium Filling Rate (%) | C | 35 | 40 | 45 |
2. Response Surface Methodology Optimization
2.1 Model Development
RSM establishes relationships between multiple variables and responses through statistical and mathematical analysis. Fifteen BBD trials (Table 3) were conducted, and a quadratic regression model for \(q_{-0.074}\) was derived:
$$
\begin{aligned}
Y = 1.09 &- 0.06625A + 0.00375B – 0.04C \\
&- 0.0375AB – 0.07AC + 0.06BC \\
&- 0.23875A^2 – 0.21875B^2 – 0.07125C^2.
\end{aligned}
$$
| Run | A: Slurry (%) | B: Material/Ball | C: Filling (%) | \(q_{-0.074}\) (t/(m³·h)) |
|---|---|---|---|---|
| 1 | 65 (-1) | 0.06 (0) | 35 (-1) | 0.89 |
| 2 | 75 (+1) | 0.06 (0) | 35 (-1) | 0.92 |
| 3 | 65 (-1) | 0.06 (0) | 45 (+1) | 0.85 |
| … | … | … | … | … |
| 15 | 70 (0) | 0.06 (0) | 40 (0) | 1.09 |
2.2 Analysis of Variance (ANOVA)
ANOVA evaluated model significance (Table 4). Key metrics included:
– p-value < 0.01: Highly significant model.
– R² = 0.9977: Excellent fit.
– Adj-R² = 0.9937: High predictability.
– Adequate Precision = 47.7: Strong signal-to-noise ratio.
| Source | Sum of Squares | df | Mean Square | F-value | p-value |
|---|---|---|---|---|---|
| Model | 0.218 | 9 | 0.0242 | 252.8 | <0.0001 |
| A-Slurry | 0.0351 | 1 | 0.0351 | 367.1 | <0.0001 |
| B-M/B Ratio | 0.0001 | 1 | 0.0001 | 1.1 | 0.3125 |
| C-Filling | 0.0128 | 1 | 0.0128 | 133.9 | <0.0001 |
| AB | 0.0056 | 1 | 0.0056 | 58.6 | 0.0001 |
| AC | 0.0196 | 1 | 0.0196 | 204.9 | <0.0001 |
| BC | 0.0144 | 1 | 0.0144 | 150.5 | <0.0001 |
| Residual | 0.0007 | 5 | 0.0001 | – | – |
2.3 Interaction Effects
Response surface plots (Figures 6–8) revealed:
– A × C interaction (slurry × filling rate) was most significant (steepest curvature).
– B × C interaction (material/ball × filling rate) was moderate.
– A × B interaction (slurry × material/ball) was negligible.
Optimal conditions were identified as:
$$
A = 68.97\%, \quad B = 0.0556, \quad C = 37.64\%,
$$
Predicted \(q_{-0.074} = 1.12 \text{t/(m³·h)}\).
2.4 Model Validation
Trials at rounded parameters (A=69%, B=0.056, C=38%) yielded:
$$
q_{-0.074} = 1.14, \quad 1.10, \quad 1.15 \text{t/(m³·h)} \quad (\text{Mean} = 1.13).
$$
Relative error vs. prediction was <3%, confirming model robustness.
3. Conclusion
(1) Single-factor tests optimized the ball mill at \(A = 70\%\), \(B = 0.057\), \(C = 40\%\), achieving \(q_{-0.074} = 1.06 \text{t/(m³·h)}\).
(2) RSM quantified interactions: Factor significance ranked as \(A\) (slurry) > \(AC\) > \(BC\) > \(C\) > \(AB\) > \(B\).
(3) The RSM-optimized ball mill (\(A = 68.97\%\), \(B = 0.0556\), \(C = 37.64\%\)) increased \(q_{-0.074}\) by 5.66% to 1.12 t/(m³·h), validated experimentally.
(4) RSM efficiently captures parameter synergies, enhancing ball mill utilization and downstream beneficiation.
**Keywords**: response surface method, ball mill, grinding process parameters
