
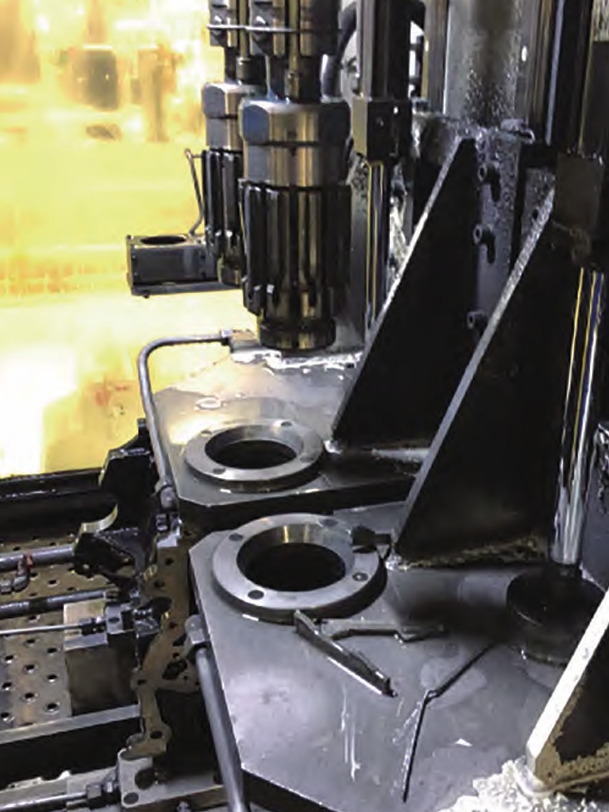
In industrial casting applications, components like pull rod seats present unique challenges due to structural complexity and stringent quality requirements. This article details a systematic approach to resolving persistent casting defects through advanced process optimization and computational modeling.
1. Critical Challenges in Casting Defect Formation
The primary casting defects observed in initial production trials included shrinkage porosity and sand inclusion, particularly in thick-section regions. Key contributing factors were identified through metallurgical analysis:
| Defect Type | Location | Formation Mechanism |
|---|---|---|
| Shrinkage porosity | Junction of flange and rod | Insufficient feeding during solidification |
| Sand inclusion | Upper surface features | Mold erosion during pouring |
| Dimensional distortion | Thin-wall sections | Uneven cooling stresses |
The solidification behavior can be modeled using Chvorinov’s rule:
$$ t = B \left( \frac{V}{A} \right)^n $$
Where:
$t$ = Solidification time
$V$ = Volume of casting section
$A$ = Surface area
$B,n$ = Material constants
2. Process Optimization Strategy
The modified casting process incorporated three key improvements:
| Parameter | Original | Optimized |
|---|---|---|
| Riser design | 2 rectangular risers | 4 tapered elliptical risers |
| Chill placement | 16mm flat chills | Curved conformal chills |
| Gating ratio | 1:1.5:2 | 1:2:1.8 |
The feeding efficiency improvement was calculated using:
$$ \eta = \frac{V_f}{V_c} \times 100\% $$
Where:
$\eta$ = Feeding efficiency
$V_f$ = Feed metal volume
$V_c$ = Casting volume
3. Solidification Simulation and Verification
Numerical simulation using ProCAST software revealed critical improvements in thermal gradients:
$$ \nabla T = \frac{\partial T}{\partial x} + \frac{\partial T}{\partial y} + \frac{\partial T}{\partial z} $$
The Niyama criterion for shrinkage prediction was applied:
$$ Ny = \frac{G}{\sqrt{\dot{T}}} $$
Where:
$G$ = Temperature gradient
$\dot{T}$ = Cooling rate
4. Production Validation Results
Post-optimization inspection data demonstrated significant quality improvement:
| Quality Parameter | Initial Process | Optimized Process |
|---|---|---|
| UT合格率 | 18.7% | 96.2% |
| Dimensional accuracy | ±2.5mm | ±0.8mm |
| Yield rate | 63% | 89% |
The success of this optimization demonstrates that systematic analysis of casting defect formation mechanisms combined with modern simulation tools can effectively resolve complex foundry quality challenges. Future work will focus on implementing machine learning algorithms for real-time process control, further reducing defect rates in high-precision cast components.