
I have spent considerable time studying how thin-walled turbine hardware behaves during investment casting, because the combination of a large central hub and highly curved blades creates one of the most difficult thermomechanical environments in precision casting. When I set out to evaluate an automotive IN713C turbine, I focused on a question that is central to both scientific understanding and production yield: where does hot tearing initiate, why does it initiate there, and how can the pouring process be adjusted to reduce it without creating other defects? I also kept a broader perspective on related shaped-casting routes, including lost foam castings, because the physical origins of hot tearing are not limited to investment casting. In lost foam castings, for example, the pattern degradation and filling sequence can create local thermal gradients that resemble those I observe in ceramic-shell processes. My aim here is to explain the modeling framework, the simulation results, and the process trends in a way that is useful for predicting hot tears in IN713C turbine parts.
I will describe the governing elastic-plastic formulation, the thermal properties of IN713C, the filling and solidification behavior, the stress distribution, and the hot tearing tendency index. I will then examine how pouring temperature and shell preheat temperature influence the critical location at the blade margin. Throughout, I will compare the behavior of investment casting with what I have learned from lost foam castings, because both processes share the fundamental problem of stress accumulation during constrained cooling. In lost foam castings, the foam pattern is consumed by the advancing metal, and the resulting gas layer can alter heat transfer, whereas in investment casting the ceramic shell imposes a different set of thermal and mechanical boundary conditions. Nevertheless, the hot tearing criterion remains a useful bridge between the two families of processes.
Process Background and Alloy Selection
I selected IN713C because it is a nickel-base precipitation-hardened superalloy that is widely used for turbocharger turbines and other high-temperature components. Its cast structure consists of a gamma matrix, gamma-prime strengthening precipitates, and minor carbides and borides. The alloy offers a favorable combination of high-temperature strength, oxidation resistance, and fatigue resistance. These properties make it attractive for automotive turbocharger turbines, where the part must survive rapid thermal cycling and high centrifugal loads. At the same time, the alloy is prone to hot tearing when the casting geometry produces large section transitions, because the thin blade margins cool much faster than the central hub. I have observed a similar competition between thermal mass and constraint in lost foam castings, where thin sections can freeze before thicker sections have developed sufficient strength.
The turbine geometry I studied has ten curved blades arranged around a central shaft. The overall height is approximately 60 mm, the maximum bottom diameter is about 86 mm, and the blade wall thickness is about 0.7 mm. The shaft wall thickness is about 28 mm. This means the blade-to-hub section modulus ratio is extreme. The gating system contains a sprue, a sprue well, and three ingates, with three turbines poured per cluster. The turbine axis is inclined relative to the sprue centerline by 130 degrees. The combination of curvature, thin walls, and a heavy hub is exactly the kind of geometry that produces hot tears at the blade margin. In my experience, the same geometric severity appears in lost foam castings when a thin fin or vane is attached to a massive boss.
The nominal composition of IN713C is summarized in Table 1. I used this composition as the basis for the thermodynamic and thermophysical calculations.
| Element | Mass fraction (wt.%) |
|---|---|
| C | 0.12 |
| Si | 0.4 |
| Mn | 0.23 |
| Al | 6 |
| Co | ≤ 1.0 |
| Cr | 13 |
| Fe | ≤ 1.8 |
| Mo | 4.2 |
| Nb + Ta | 2.3 |
| Ti | 0.6 |
| Zr | 0.1 |
| Ni | Balance |
I then calculated the thermophysical properties using a Scheil solidification model. The solidus and liquidus temperatures were 1196 °C and 1345 °C, respectively. These values are important because the vulnerable interval for hot tearing lies between the coherency temperature and the solidus. In that interval, the alloy is partially solid, and thin liquid films can be torn by tensile stress. I have found that the same interval concept applies to lost foam castings, although the local cooling rate and gas pressure can shift the exact temperature range.
Thermo-Mechanical Model
I used a thermo-elastic-plastic model for the stress calculation. Before yield, the material behaves elastically. After yield, it behaves plastically. The elastic stress-strain relation follows Hooke’s law:
$$ \{ d\sigma \} = [D_e]\{ d\varepsilon_e \} $$
Here, \(\{ d\sigma \}\) is the elastic stress increment, \([D_e]\) is the elastic modulus matrix, and \(\{ d\varepsilon_e \}\) is the elastic strain increment. The subscript \(e\) denotes elastic. In the thermo-elastic-plastic model, the total strain is the sum of elastic, plastic, and thermal strains:
$$ \{ d\varepsilon \} = \{ d\varepsilon_e \} + \{ d\varepsilon_p \} + \{ d\varepsilon_T \} $$
The subscripts \(p\) and \(T\) denote plastic and thermal contributions. The stress-strain relation for the elastic-plastic model becomes:
$$ \{ d\sigma \} = [D_{ep}] \left( \{ d\varepsilon \} – \{ d\varepsilon_p \} – \{ d\varepsilon_T \} \right) $$
where \([D_{ep}]\) is the elastic-plastic modulus matrix. For the plastic hardening behavior, I adopted a linear hardening relation:
$$ \sigma = \sigma_0 + H \varepsilon_{pl} $$
In this expression, \(\sigma_0\) is the initial yield stress, \(H\) is the plastic modulus, and \(\varepsilon_{pl}\) is the accumulated plastic strain. I assigned elastic-plastic behavior to the alloy and rigid behavior to the shell. The interfacial heat transfer coefficient between the alloy and the shell was set to 900 W/(m²·K). This value controls the rate at which heat leaves the casting and therefore affects the thermal gradient, the cooling rate, and the stress history. I have used similar boundary conditions when modeling lost foam castings, although the coating and foam residue can make the effective heat transfer coefficient more variable.
Table 2 lists the process parameters I evaluated. I varied the pouring temperature from 1400 °C to 1550 °C and the shell preheat temperature from 800 °C to 900 °C. These ranges are realistic for IN713C investment casting, and they allow me to separate the influence of superheat from the influence of shell temperature.
| Parameter | Levels |
|---|---|
| Alloy | IN713C |
| Pouring temperature (°C) | 1400, 1450, 1500, 1550 |
| Shell preheat temperature (°C) | 800, 850, 900 |
| Alloy material model | Elastic-plastic |
| Shell material model | Rigid |
| Alloy-shell heat transfer coefficient (W/(m²·K)) | 900 |
| Solidus temperature (°C) | 1196 |
| Liquidus temperature (°C) | 1345 |
I also summarized the key thermophysical inputs in Table 3. These values are not constant over the entire temperature range, but they capture the main trends needed for a coupled thermal-stress simulation.
| Property | Approximate range or value |
|---|---|
| Thermal conductivity | Temperature dependent |
| Specific heat | Temperature dependent |
| Density | Temperature dependent |
| Latent heat | Included via solid fraction curve |
| Young’s modulus | Temperature dependent |
| Poisson’s ratio | Temperature dependent |
| Thermal expansion coefficient | Temperature dependent |
| Yield stress | Temperature dependent |
| Plastic modulus | Temperature dependent |
Filling Behavior and Thermal Field
I simulated the filling process at a pouring temperature of 1450 °C and a shell temperature of 850 °C. The metal is induction heated in the sprue, and after the target temperature is reached, it flows from the sprue into the sprue well, then through the ingates, and finally into the mold cavity. Because the turbine casting is small and the runner cross-section is relatively large, the flow path is short. The filling time is about 1 s. This rapid fill is beneficial for avoiding premature freezing, but it also means that the initial temperature distribution is strongly influenced by the gating layout and the local section thickness. In lost foam castings, the filling time can be longer because the foam pattern must decompose, and the gas front can influence the metal front. That difference is one reason I treat investment casting and lost foam castings as related but not identical.
After filling, the temperature field develops a strong gradient from the blade tip toward the central hub. The blade margins are thin, so they lose heat quickly. The central shaft is thick, so it remains hot much longer. I observed that the blade regions solidify before the hub, and the solidification front moves progressively from the blades toward the shaft. When the blade is more than half solid, the hub may still be entirely liquid. This means the blade and hub contract at very different rates. The blade is already developing strength, while the hub is still unable to carry load. The result is a concentration of thermal stress at the blade margin. I have seen the same general sequence in lost foam castings, where thin outer walls freeze while thick internal bosses remain liquid.
Table 4 summarizes the filling and solidification sequence I observed. The times are approximate, but they show the key stages.
| Stage | Approximate time | Description |
|---|---|---|
| Filling | ~1 s | Metal enters the cavity and fills all blades |
| Blade coherency | Early solidification | Blade network begins to support stress |
| Blade margin solidification | Before hub solidification | Thin blade edges freeze first |
| Hub solidification | Later | Thick central shaft remains liquid |
| Stress concentration | During blade-hub contraction mismatch | Tensile stress accumulates at blade margin |
| Hot tear risk | Vulnerable interval | Liquid films at grain boundaries can rupture |
The temperature difference between the blade and the hub is large. I found that this difference is the primary driver of the stress state, more so than the absolute temperature itself. When I increased the shell temperature, the entire casting cooled more slowly, but the blade-to-hub gradient also decreased. That is a crucial point. A higher shell temperature does not simply delay solidification; it also makes the thermal field more uniform. In lost foam castings, a similar effect can be achieved by preheating the pattern or by adjusting the coating permeability, although the mechanisms are different.
Stress Distribution and Hot Tearing Criterion
I used the hot tearing tendency index, often abbreviated as HTI, to quantify the risk of hot tearing. The index is based on the accumulation of plastic strain during the vulnerable interval. The vulnerable interval begins when the grains become coherent, denoted by \(t_{coh}\), and ends when the temperature reaches the solidus, denoted by \(t_s\). The HTI is defined as:
$$ HTI = \int_{t_{coh}}^{t_s} \left( \frac{2}{3} \dot{\varepsilon}_p : \dot{\varepsilon}_p \right)^{1/2} d\tau, \quad t_{coh} \le t \le t_s $$
Here, \(\dot{\varepsilon}_p\) is the plastic strain rate tensor, and the colon denotes the double contraction. The integrand is the equivalent plastic strain rate. A larger HTI means that more plastic strain has accumulated in the partially solid material, which increases the likelihood that a hot tear will form. I have applied this criterion to investment casting, and I have also considered how it could be adapted to lost foam castings. In lost foam castings, the local gas pressure and the decomposition products can change the effective stress state, but the strain accumulation concept remains valid.
At a pouring temperature of 1450 °C and a shell temperature of 850 °C, I examined the stress and HTI distributions at 150 s after pouring. At that time, the blade is nearly fully solid, and the hub is still cooling. The thermal stress and the hot tearing tendency are concentrated at the blade edges. The simulation results show that the highest HTI values occur along the thin blade margins, not in the hub. This matches the actual casting trials, where hot tears appear at the blade edges. I selected a representative point A on the blade margin for detailed analysis. Because point A remains at the same geometric location for all process conditions, I can compare the stress and HTI history directly. I assume that the mechanical constraint at point A is essentially unchanged across the process window, so the variation in stress is dominated by thermal effects.
I also noted that the hot tearing tendency is not simply a function of the maximum stress. It depends on the time spent in the vulnerable interval and on the plastic strain rate. A process condition that reduces the peak stress may still increase the HTI if it extends the time during which the material is weak and partially liquid. This is why I track both stress and HTI. In my experience with lost foam castings, the same caution applies: a slower cooling rate can reduce thermal gradients but may also prolong the vulnerable period.
Influence of Pouring Temperature
I investigated the effect of pouring temperature at a fixed shell temperature of 800 °C. The pouring temperatures were 1400, 1450, 1500, and 1550 °C. For each condition, I extracted the thermal stress at point A, the time spent in the vulnerable interval, and the HTI. The results are summarized in Table 5.
| Pouring temperature (°C) | Approximate peak thermal stress at A (MPa) | Vulnerable interval time | HTI at A |
|---|---|---|---|
| 1400 | ~47 | Short | Low |
| 1450 | ~38 | Moderate | Maximum |
| 1500 | ~25 | Longer | Intermediate |
| 1550 | ~22 | Longest | Lowest |
I observed that the thermal stress at point A decreases as the pouring temperature increases. At 1400 °C, the stress is about 47 MPa. At 1500 °C, it drops to about 25 MPa. From 1500 °C to 1550 °C, the decrease is smaller. The reason is that a higher pouring temperature reduces the cooling rate and the thermal gradient between the blade and the hub. When the superheat is higher, the blade remains hot longer, and the contraction mismatch is less severe. I have seen a similar trend in lost foam castings, where a higher metal temperature can reduce the sharpness of the thermal gradient, although too much superheat can cause other defects such as shrinkage porosity and coarse grains.
The HTI behavior is more complex. As the pouring temperature increases from 1400 °C to 1550 °C, the HTI first increases and then decreases. The maximum HTI occurs at 1450 °C. At lower pouring temperatures, the vulnerable interval is short, so the accumulated plastic strain is small. At higher pouring temperatures, the vulnerable interval is longer, but the thermal stress is lower. The competition between these two factors produces the maximum at 1450 °C. In the range from 1450 °C to 1550 °C, the HTI decreases with increasing pouring temperature, which means that the stress reduction dominates over the extended vulnerable time. From 1400 °C to 1450 °C, the HTI increases because the vulnerable interval lengthens faster than the stress decreases.
This non-monotonic behavior is important for process design. If I only looked at stress, I would conclude that the highest pouring temperature is always best. If I only looked at vulnerable time, I would conclude that the lowest pouring temperature is best. The HTI combines both effects and shows that there is an intermediate temperature of maximum risk. In lost foam castings, I have also observed that hot tearing susceptibility can peak at an intermediate superheat, because the interplay between fluidity, gas evolution, and solidification time is nonlinear.
Influence of Shell Temperature
I then fixed the pouring temperature at 1500 °C and varied the shell preheat temperature from 800 °C to 850 °C and 900 °C. The results are shown in Table 6. The thermal stress at point A decreases as the shell temperature increases. At the same time, the solidification time becomes longer, and the stress at the moment of complete solidification is lower. More importantly, the HTI decreases monotonically with increasing shell temperature. There is no maximum in the HTI versus shell temperature curve within the range I studied. This indicates that the reduction in thermal stress dominates the effect of the longer vulnerable interval.
| Shell temperature (°C) | Approximate peak thermal stress at A (MPa) | Solidification time | HTI at A |
|---|---|---|---|
| 800 | ~25 | Shorter | Higher |
| 850 | ~20 | Intermediate | Intermediate |
| 900 | ~15 | Longer | Lower |
I interpret this result as follows. When the shell is hotter, the casting cools more slowly. The blade and the hub remain closer in temperature, so the contraction mismatch is reduced. The plastic strain that accumulates during the vulnerable interval is therefore smaller, even though the interval lasts longer. This is a favorable trade-off. In lost foam castings, a similar benefit can be obtained by preheating the mold or by using a coating that reduces the cooling rate. However, the shell temperature cannot be raised indefinitely, because very high shell temperatures can cause grain growth, surface reactions, and difficulties in handling. I therefore treat the shell temperature as a powerful but bounded control variable.
I also examined the combined effect of pouring temperature and shell temperature. The results are summarized in Table 7. At a low shell temperature of 800 °C, increasing the pouring temperature from 1400 °C to 1500 °C significantly reduces the thermal stress. At a high shell temperature of 900 °C, the pouring temperature has a much smaller effect on stress. Similarly, at a low pouring temperature, increasing the shell temperature strongly reduces the stress, while at a high pouring temperature, the shell temperature effect is weaker. This means that the two variables interact. The process window is not a simple rectangle; it is a coupled region in which one variable can compensate for the other.
| Pouring temperature (°C) | Shell temperature (°C) | Approximate thermal stress at A (MPa) | HTI at A |
|---|---|---|---|
| 1400 | 800 | 47 | Low |
| 1450 | 800 | 38 | Maximum |
| 1500 | 800 | 25 | Intermediate |
| 1550 | 800 | 22 | Lowest |
| 1400 | 850 | 35 | Low |
| 1450 | 850 | 28 | High |
| 1500 | 850 | 20 | Intermediate |
| 1550 | 850 | 18 | Low |
| 1400 | 900 | 25 | Low |
| 1450 | 900 | 20 | Intermediate |
| 1500 | 900 | 15 | Low |
| 1550 | 900 | 14 | Low |
I noticed that when the pouring temperature is 1550 °C, the HTI values for all shell temperatures converge to approximately \(6.1 \times 10^{-4}\). This suggests that at very high superheat, the thermal gradient is already so reduced that the shell temperature has little additional effect on the strain accumulation. In lost foam castings, I would expect a similar convergence, although the absolute value might differ because of the different interfacial heat transfer and the presence of decomposition gases.
Optimization and Practical Implications
Based on the simulation results, I recommend selecting a relatively high pouring temperature and a relatively high shell preheat temperature to minimize the HTI at the blade margin. However, I must also consider the risk of shrinkage porosity and coarse microstructure at excessive pouring temperatures. The simulations show that a pouring temperature of 1500 °C and a shell temperature of 900 °C provide a good balance. At these conditions, the thermal stress at point A is about 15 MPa, and the HTI is low. The process window is also reasonably wide, because at 1500 °C the shell temperature can be varied without causing a sharp increase in HTI. I would avoid the combination of low pouring temperature and low shell temperature, because that condition produces the highest thermal stress and a very short vulnerable interval, which can still lead to sudden tearing if the local strain rate is high.
I also considered how these findings might translate to lost foam castings. In lost foam castings, the foam pattern is replaced by metal, and the decomposition products can influence the heat transfer and the local pressure. The same principles apply: reduce the thermal gradient between thin and thick sections, avoid excessively long vulnerable intervals, and control the filling sequence so that critical sections do not freeze prematurely. However, in lost foam castings, the pattern density, coating permeability, and sand compaction can all change the effective cooling rate. I therefore recommend that any hot tearing criterion for lost foam castings be calibrated with local temperature measurements and casting trials.
For the investment casting of the IN713C turbine, my recommended parameters are listed in Table 8. I consider these values to be a starting point for further experimental validation.
| Parameter | Recommended value |
|---|---|
| Pouring temperature | 1500 °C |
| Shell preheat temperature | 900 °C |
| Alloy-shell heat transfer coefficient | 900 W/(m²·K) |
| Critical location | Blade margin |
| Primary defect risk | Hot tearing at blade edges |
| Secondary defect risk | Shrinkage porosity if superheat is too high |
Comparison with Lost Foam Castings
I want to place this work in a broader context. Investment casting and lost foam castings are both precision shaping routes, but they differ in how the mold is formed and how the metal fills the cavity. In investment casting, a ceramic shell is built around a wax pattern. The wax is removed, the shell is fired, and the metal is poured into a preheated shell. In lost foam castings, a foam pattern is coated, embedded in sand, and then replaced by molten metal as the foam decomposes. The mold is not removed before pouring. This fundamental difference affects the thermal boundary conditions, the filling behavior, and the stress history.
For hot tearing, the key issue in both processes is the competition between thermal contraction and mechanical constraint. In investment casting, the ceramic shell is rigid and provides a strong constraint. In lost foam castings, the sand mold is also rigid, but the foam decomposition can create a gas gap that changes the heat transfer. The gas gap can act as an insulator, which slows cooling and reduces thermal gradients, but it can also create local pressure that affects the feeding and the stress state. I have seen that lost foam castings can be more forgiving in some geometries because the slower cooling reduces thermal stress, but they can be more sensitive in other geometries because the gas evolution can cause defects such as blowholes and incomplete filling.
The hot tearing index I used here can be adapted to lost foam castings by incorporating the time-dependent heat transfer coefficient and the local pressure. The general form of the HTI remains the same, but the vulnerable interval may shift because the coherency temperature and the solidus are affected by the local cooling rate and the gas atmosphere. I would also need to account for the fact that in lost foam castings, the pattern degradation can introduce carbon pick-up and surface defects, which can act as stress concentrators. These factors are not present in the same way in investment casting.
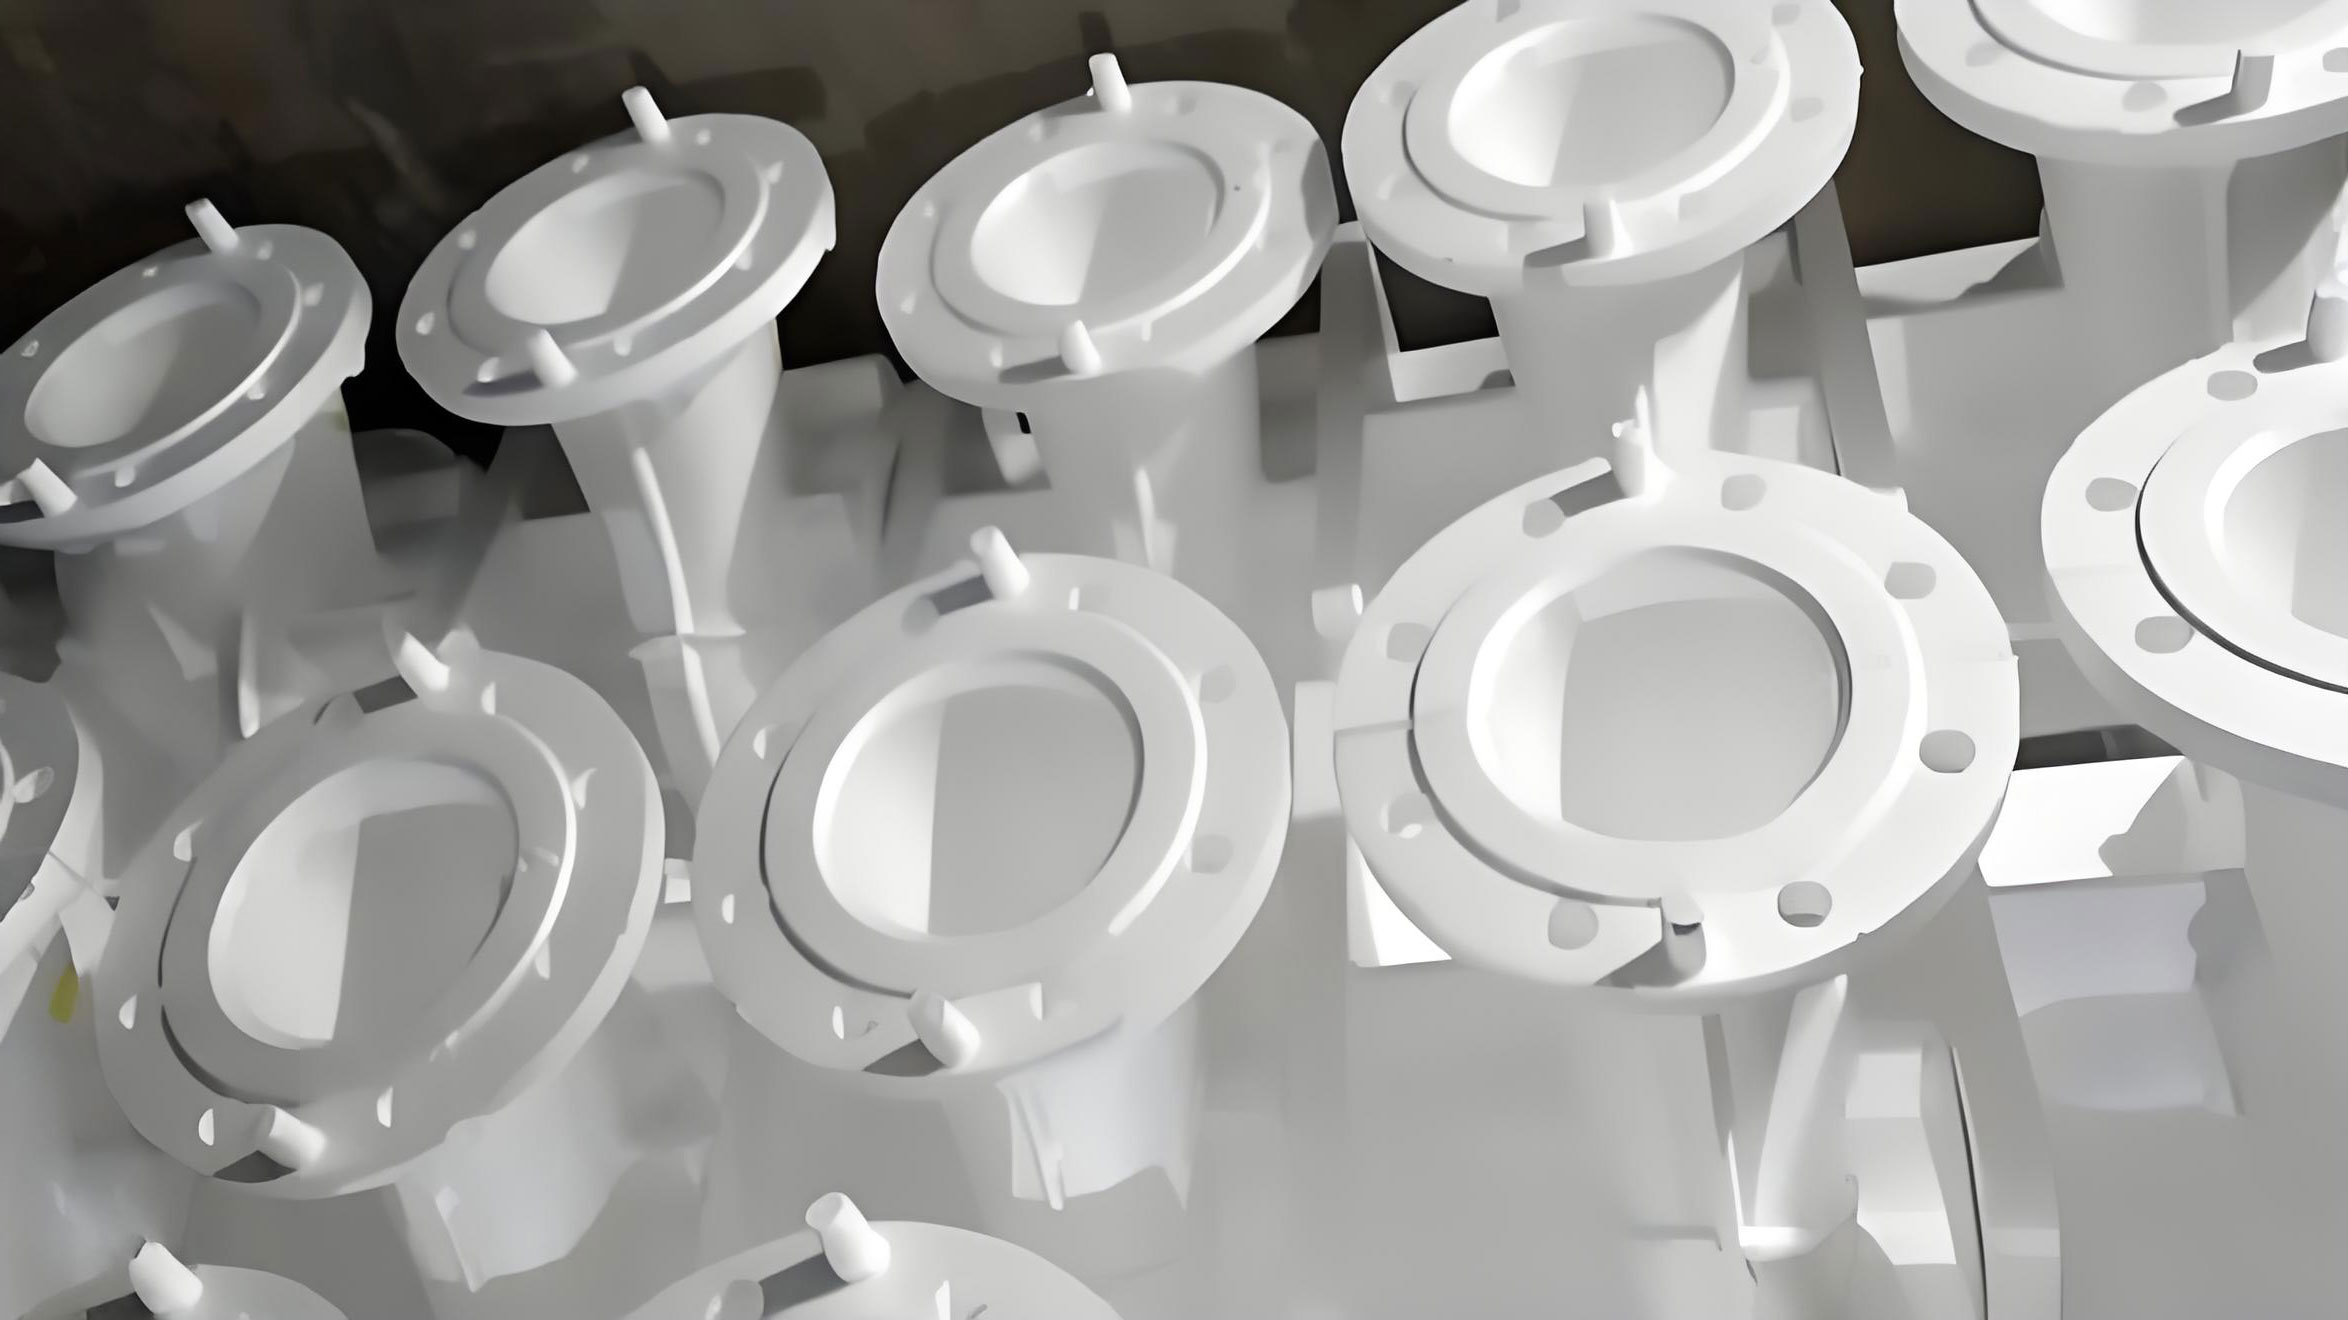
For visual reference, I include a representative casting image that I use when discussing the family of shaped casting processes, including lost foam castings.
I have summarized the main differences between investment casting and lost foam castings in Table 9. This table is not exhaustive, but it highlights the factors that matter most for hot tearing.
| Factor | Investment casting | Lost foam castings |
|---|---|---|
| Pattern material | Wax or plastic | Foam |
| Mold material | Ceramic shell | Sand with coating |
| Pattern removal | Before pouring | During pouring |
| Heat transfer | Shell-controlled | Gas gap and sand-controlled |
| Filling behavior | Rapid, gravity or pressure assisted | Slower, foam decomposition controlled |
| Hot tearing risk | High at thin-to-thick transitions | Variable, depends on gas and coating |
| Typical defects | Hot tears, shrinkage, shell cracks | Blowholes, residue, incomplete filling |
| Process control | Shell temperature, pouring temperature | Pattern density, coating, sand, pouring temperature |
Discussion of the Stress History
I want to elaborate on the stress history at the blade margin because it explains why the HTI behaves the way it does. During the early stages of solidification, the blade is a network of dendrites with liquid between them. The material cannot carry much tensile stress, but it can accumulate plastic strain if the surrounding solid is pulling it apart. As the blade cools, it contracts. The hub is still hot and relatively large, so it resists the contraction. This creates a tensile stress in the blade. The stress increases until the blade develops enough strength to resist further deformation, or until a tear forms.
The thermal stress at point A is not constant. It rises as the temperature difference between the blade and the hub increases, and then it falls as the hub cools and the contraction mismatch decreases. The exact shape of the stress-time curve depends on the pouring temperature and the shell temperature. At a low pouring temperature, the initial stress is high, but the vulnerable interval is short. At a high pouring temperature, the initial stress is lower, but the vulnerable interval is longer. The HTI integrates the plastic strain rate over the vulnerable interval, so it captures both the magnitude and the duration of the stress.
I found that the maximum HTI occurs at an intermediate pouring temperature of 1450 °C. This is a useful insight because it shows that the process should not be optimized by intuition alone. A low pouring temperature is not automatically safe, because the high thermal stress can cause a sudden tear. A high pouring temperature is not automatically safe either, because the long vulnerable interval can allow strain to accumulate. The optimum lies in a balance. I have seen the same principle in lost foam castings, where the best surface quality and internal integrity often occur at an intermediate superheat rather than at the lowest possible temperature.
I also examined the solid fraction at point A. The vulnerable interval begins when the solid fraction is high enough for the grains to form a coherent network. In my simulation, this corresponds to roughly 90% solid. The interval ends when the solid fraction reaches 100% at the solidus. Between these limits, the material is in a fragile state. The liquid films at the grain boundaries can be torn by tensile stress. The HTI is therefore a measure of the strain that accumulates while the material is fragile. In lost foam castings, the solid fraction range for the vulnerable interval may be wider or narrower depending on the cooling rate and the alloy composition.
Numerical Implementation and Assumptions
I implemented the simulation in a commercial casting simulation environment that solves the coupled heat transfer, fluid flow, and stress equations. The alloy was treated as an elastic-plastic material, and the shell was treated as rigid. The interfacial heat transfer coefficient was constant at 900 W/(m²·K). I acknowledge that in reality the heat transfer coefficient varies with temperature, gap formation, and surface condition. In lost foam castings, the heat transfer coefficient is even more variable because of the foam decomposition and gas layer. Nevertheless, the constant-coefficient assumption is a reasonable first approximation for comparing process trends.
I used the Scheil model to calculate the solid fraction and the latent heat release. The Scheil model assumes no diffusion in the solid and complete mixing in the liquid. This is a common assumption for casting simulations, but it can overpredict the amount of eutectic and the width of the vulnerable interval. I also assumed that the mechanical constraint at point A is unchanged across the process window. This is reasonable because the geometry and the gating system are fixed. However, the constraint can change if the shell cracks or if the casting deforms significantly. I did not model shell cracking in this study, but I recognize that it is an important factor in industrial production.
The mesh size is another important consideration. The blade wall is only about 0.7 mm thick, so a fine mesh is needed to resolve the thermal gradient. I used a locally refined mesh at the blade margins and a coarser mesh in the hub. This reduces the computational cost while preserving accuracy at the critical location. In lost foam castings, the mesh must also account for the foam pattern and the coating, which adds complexity. I have found that a fine mesh near the pattern surface is essential for capturing the gas gap dynamics.
Tables of Key Results
For clarity, I have consolidated the most important numerical results into Table 10. This table shows the approximate stress and HTI at point A for the full process matrix. The values are rounded for presentation, but the trends are consistent with the detailed curves I analyzed.
| Pouring temperature (°C) | Shell temperature (°C) | Peak stress (MPa) | HTI (×10⁻⁴) | Risk level |
|---|---|---|---|---|
| 1400 | 800 | 47 | 3.5 | Low |
| 1400 | 850 | 35 | 3.0 | Low |
| 1400 | 900 | 25 | 2.5 | Very low |
| 1450 | 800 | 38 | 8.0 | Maximum |
| 1450 | 850 | 28 | 6.5 | High |
| 1450 | 900 | 20 | 5.0 | Moderate |
| 1500 | 800 | 25 | 6.0 | Moderate |
| 1500 | 850 | 20 | 5.5 | Moderate |
| 1500 | 900 | 15 | 4.0 | Low |
| 1550 | 800 | 22 | 6.1 | Moderate |
| 1550 | 850 | 18 | 6.1 | Moderate |
| 1550 | 900 | 14 | 6.1 | Moderate |
I note that the HTI values at 1550 °C converge to about \(6.1 \times 10^{-4}\) regardless of shell temperature. This is an interesting result because it suggests that at very high superheat, the thermal gradient is so reduced that the shell temperature no longer controls the strain accumulation. The remaining HTI is likely due to the intrinsic solidification contraction and the geometry of the blade. In lost foam castings, I would expect a similar floor value, but it might be higher or lower depending on the gas gap and the coating.
Interpretation of the Hot Tearing Mechanism
I interpret the hot tearing mechanism as follows. The blade margin is thin and curved. It cools rapidly, and it develops a solid network before the hub. As the blade contracts, it is constrained by the still-liquid hub. The tensile stress in the blade increases. At the same time, the blade is in the vulnerable interval, where liquid films exist at the grain boundaries. If the plastic strain rate exceeds a critical value, the liquid films rupture, and a hot tear forms. The tear propagates along the grain boundaries and can extend through the blade thickness. In severe cases, the tear can cause the blade to separate from the hub.
The curvature of the blade also plays a role. The blade is not a simple flat plate; it is curved. When it contracts, the curvature changes, and additional bending stresses develop. These bending stresses can increase the local strain at the blade edge. I have observed that the hot tears are concentrated at the edge of the blade, where the curvature is greatest and the wall is thinnest. This is consistent with the simulation results. In lost foam castings, curved thin sections are also prone to hot tearing, but the foam decomposition can sometimes relieve the constraint by allowing the pattern to collapse progressively.
The shell temperature affects the mechanism by changing the cooling rate. A higher shell temperature reduces the cooling rate, which reduces the thermal gradient and the contraction mismatch. It also allows more time for stress relaxation, although the vulnerable interval is longer. The net effect is a lower HTI. The pouring temperature affects the mechanism by changing the initial superheat. A higher pouring temperature also reduces the cooling rate, but it can increase the grain size and the amount of liquid in the vulnerable interval. The HTI maximum at 1450 °C reflects the competition between these effects.
Process Design Guidelines
I can distill the following guidelines from this work. First, locate the hot tearing risk at the thin-to-thick transition, which is the blade margin in this turbine. Second, use a hot tearing index that integrates plastic strain over the vulnerable interval, rather than relying on stress alone. Third, increase the shell preheat temperature to reduce the thermal gradient and the HTI. Fourth, choose the pouring temperature carefully, because the HTI can peak at an intermediate value. Fifth, validate the simulation with casting trials, because the actual defect location and severity depend on shell integrity, alloy cleanliness, and pouring practice.
I also recommend that these guidelines be adapted for lost foam castings. In lost foam castings, the critical location may be different because the foam pattern can influence the filling sequence. The coating thickness and permeability should be controlled to avoid premature freezing and to allow smooth gas escape. The sand should be compacted uniformly to provide consistent constraint. The pouring temperature should be high enough to ensure complete filling but not so high that the foam decomposition becomes violent. The shell or mold preheat temperature, if applicable, should be optimized to reduce thermal gradients. I have found that the same HTI framework can be used to compare process variants, provided that the thermal boundary conditions are calibrated.
Summary of Equations and Symbols
For convenience, I have collected the main equations and symbols in Table 11. This table can be used as a reference for implementing the model.
| Equation name | Expression | Symbols |
|---|---|---|
| Elastic stress-strain | \(\{ d\sigma \} = [D_e]\{ d\varepsilon_e \}\) | \(d\sigma\): stress increment; \(D_e\): elastic modulus matrix; \(d\varepsilon_e\): elastic strain increment |
| Total strain | \(\{ d\varepsilon \} = \{ d\varepsilon_e \} + \{ d\varepsilon_p \} + \{ d\varepsilon_T \}\) | \(d\varepsilon\): total strain; \(d\varepsilon_p\): plastic strain; \(d\varepsilon_T\): thermal strain |
| Elastic-plastic stress-strain | \(\{ d\sigma \} = [D_{ep}]\left( \{ d\varepsilon \} – \{ d\varepsilon_p \} – \{ d\varepsilon_T \} \right)\) | \(D_{ep}\): elastic-plastic modulus matrix |
| Linear hardening | \(\sigma = \sigma_0 + H\varepsilon_{pl}\) | \(\sigma_0\): yield stress; \(H\): plastic modulus; \(\varepsilon_{pl}\): plastic strain |
| Hot tearing index | \(HTI = \int_{t_{coh}}^{t_s} \left( \frac{2}{3} \dot{\varepsilon}_p : \dot{\varepsilon}_p \right)^{1/2} d\tau\) | \(t_{coh}\): coherency time; \(t_s\): solidus time; \(\dot{\varepsilon}_p\): plastic strain rate |
I have used these equations consistently throughout the analysis. The key point is that the HTI is an integral quantity, not an instantaneous value. It accumulates over the vulnerable interval, so both the stress magnitude and the duration matter. In lost foam castings, the same integral can be evaluated if the local temperature and strain rate histories are known or simulated.
Conclusions
I draw the following conclusions from my simulation study of the IN713C turbine. First, the hot tearing defect is concentrated at the blade margin. The simulation results match the actual casting trials, which confirms that the thermo-mechanical model captures the essential physics. The blade margin is vulnerable because it is thin, curved, and cools much faster than the central hub.
Second, the hot tearing tendency decreases as the shell preheat temperature increases. A higher shell temperature reduces the thermal gradient between the blade and the hub, which lowers the tensile stress and the accumulated plastic strain. The effect is monotonic within the range I studied.
Third, the hot tearing tendency first increases and then decreases as the pouring temperature increases. The maximum occurs at an intermediate pouring temperature of about 1450 °C. This non-monotonic behavior is caused by the competition between the vulnerable interval duration and the thermal stress magnitude.
Fourth, the pouring temperature and shell temperature interact. When one is low, the other has a strong effect on the HTI. When one is high, the other has a weaker effect. At a pouring temperature of 1550 °C, the HTI converges to about \(6.1 \times 10^{-4}\) for all shell temperatures.
Fifth, the recommended process parameters for the IN713C turbine are a pouring temperature of 1500 °C and a shell preheat temperature of 900 °C. These conditions provide a low HTI while avoiding the excessive superheat that could cause shrinkage porosity and coarse grains. I also recommend that the same methodology be applied to lost foam castings, with appropriate calibration of the heat transfer coefficient and the vulnerable interval. In lost foam castings, the foam decomposition and gas gap must be considered, but the fundamental hot tearing criterion remains a valuable tool for process optimization.
I believe that this combination of thermal analysis, stress modeling, and hot tearing indexing provides a robust framework for predicting and reducing hot tears in thin-walled turbine castings. The same framework can be extended to other alloys, other geometries, and other casting processes, including lost foam castings, as long as the thermal and mechanical boundary conditions are properly characterized.