
In the manufacturing of precision machine tools, the stability and performance of the base components are paramount. As a foundational element, machine tool castings, such as beds, columns, saddles, and worktables, constitute over 80% of the machine’s total weight. Their properties—including dimensional stability, wear resistance, vibration damping, and stiffness—directly influence the overall accuracy and longevity of the machine tool. Historically, machine tool castings have been predominantly produced from gray iron, with ductile iron used in limited applications for specific models. The pursuit of high-performance machine tool castings demands a delicate balance: achieving high tensile and compressive strength, high elastic modulus (stiffness), low residual stress to prevent distortion, excellent wear resistance, and superior damping capacity. These requirements often conflict, as high strength typically necessitates a low carbon equivalent (CE) to promote austenite growth and dendrite refinement, while low stress and good castability favor a high CE. Thus, the central challenge in producing high-quality machine tool castings lies in attaining high strength and stiffness at an elevated CE, a problem that requires precise metallurgical control and process optimization.
The production of machine tool castings involves complex interactions between chemistry, melting practices, and solidification behavior. Initially, our approach for HT300-grade castings focused on maintaining a low CE (3.60%–3.70%) to ensure high strength through microstructure refinement. However, this led to issues such as cracking, shrinkage porosity, and hardness inconsistencies, affecting the machinability and reliability of the castings. This article details our journey in refining the production process for HT300 machine tool castings, emphasizing how adjustments in carbon equivalent and microalloying with elements like copper and tin can resolve these defects while maintaining or enhancing mechanical properties. We will explore the original process, identify key problems, describe the optimized methodology, and present validation data, all from a first-person perspective as practitioners in the field.
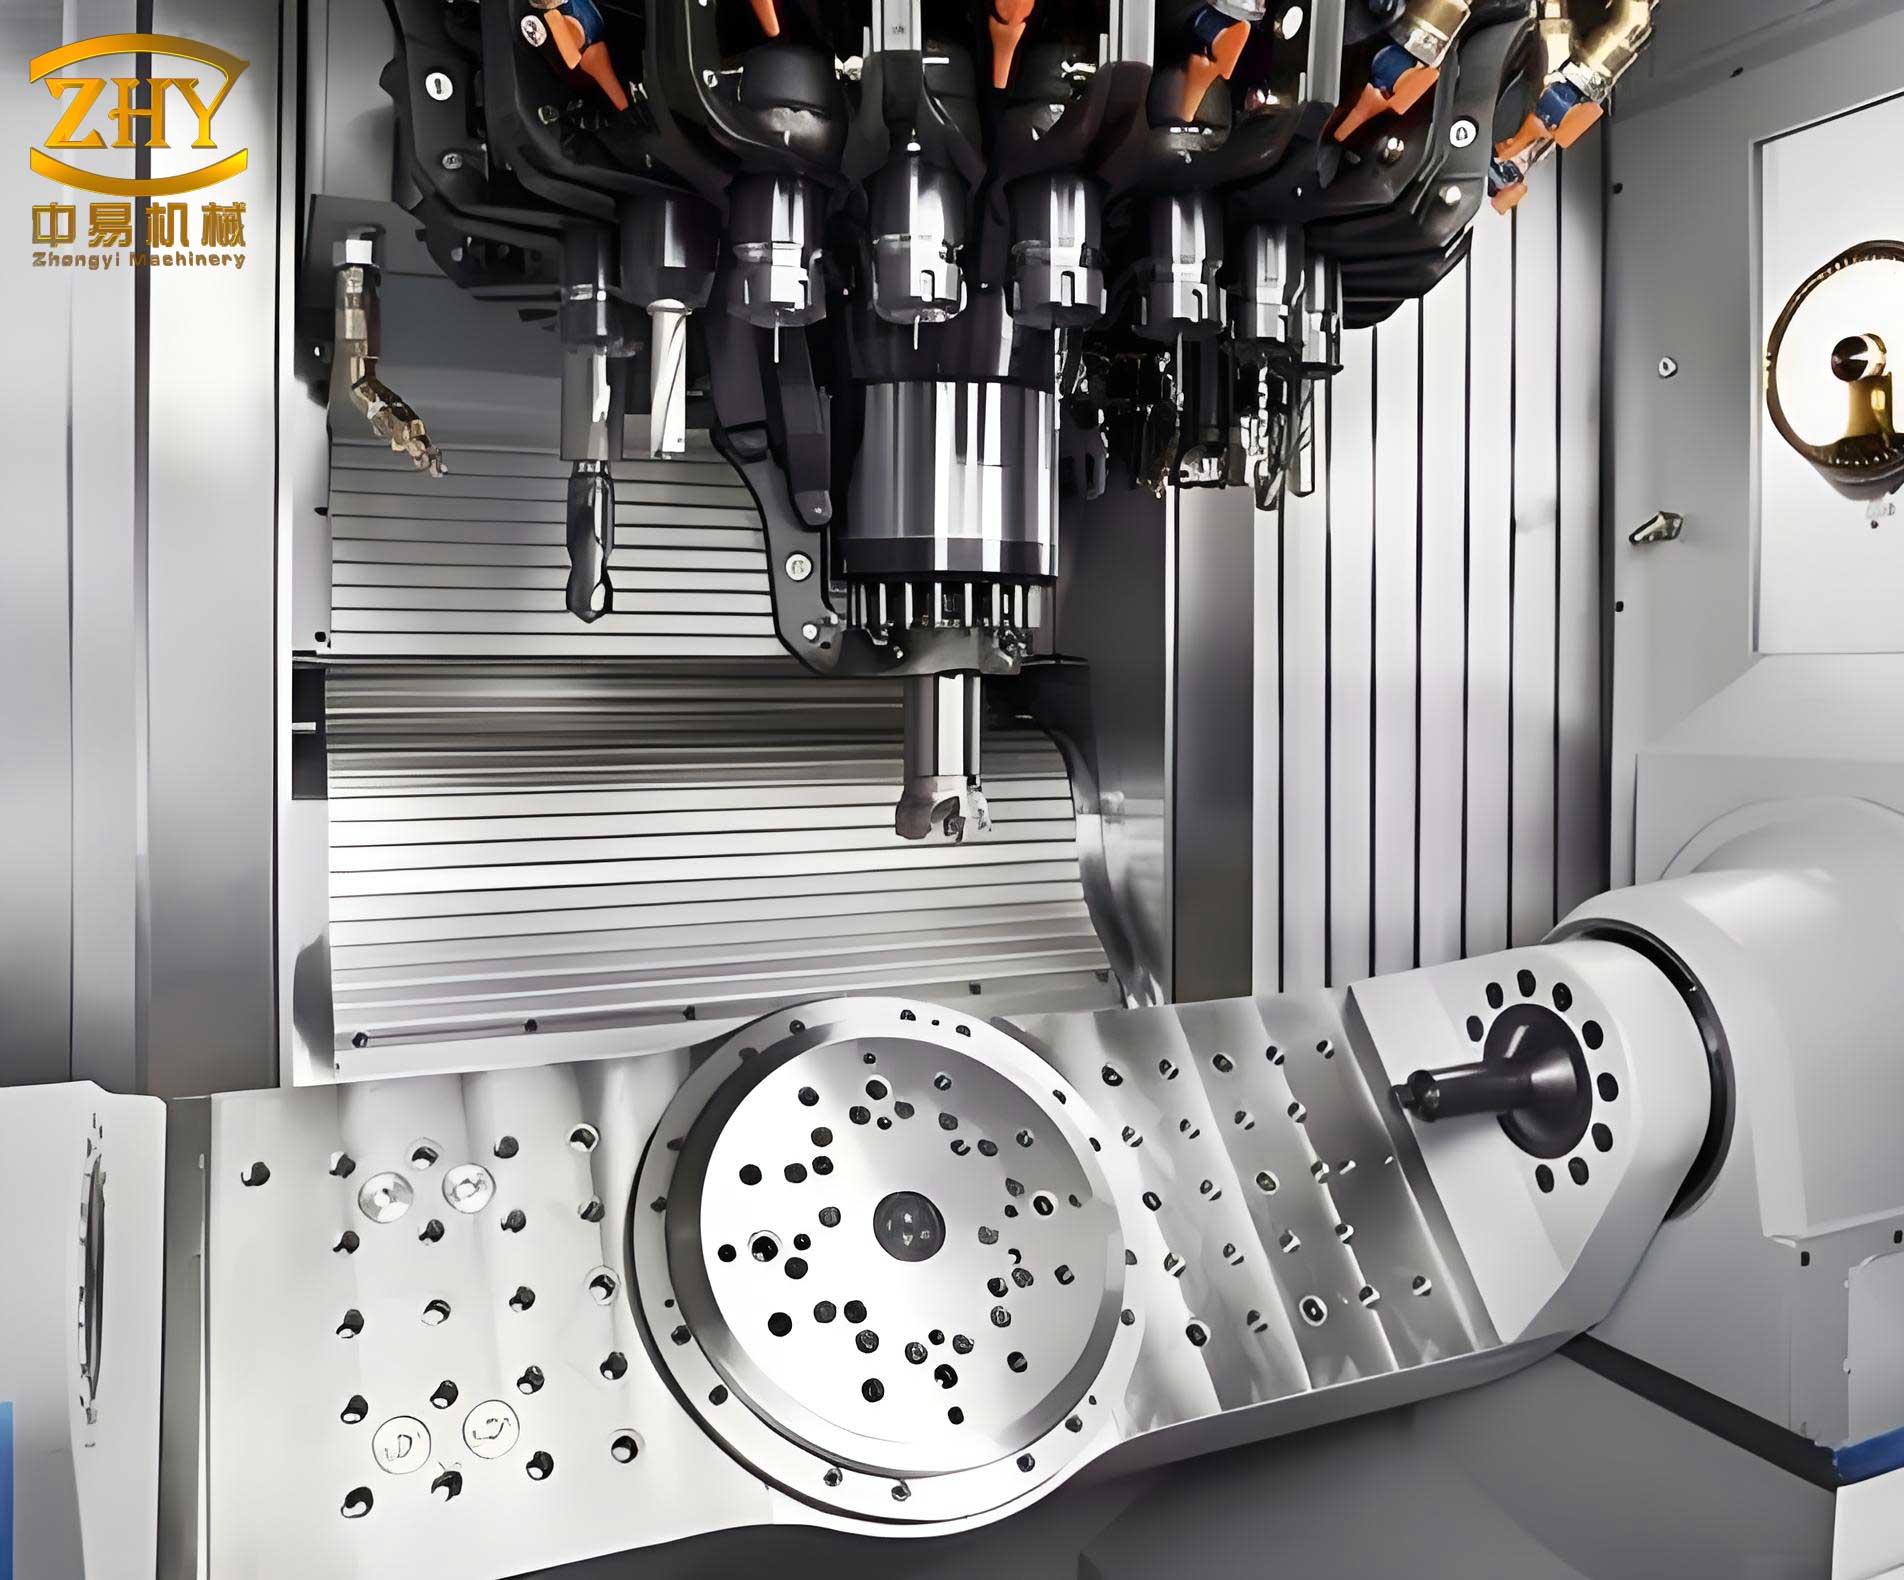
In the original production process for HT300 machine tool castings, the chemical composition was tightly controlled to meet strength requirements. The carbon equivalent, a critical parameter influencing graphite formation and matrix structure, was kept low to enhance strength. The composition targets are summarized in Table 1, which reflects our initial specifications for the iron melt.
| Element/Parameter | Target Range | Typical Average |
|---|---|---|
| Carbon Equivalent (CE) | 3.60–3.70 | 3.635 |
| Carbon (C) | 3.00–3.10 | 3.077 |
| Silicon (Si) | 1.60–1.70 | 1.652 |
| Manganese (Mn) | 0.80–1.00 | 0.90 |
| Phosphorus (P) | < 0.05 | 0.03 |
| Sulfur (S) | 0.06–0.10 | 0.08 |
| Antimony (Sb) | 0.02–0.03 | 0.025 |
| Tin (Sn) | 0.02–0.03 | 0.025 |
The carbon equivalent is calculated using a standard formula that accounts for the graphite-forming tendencies of silicon and phosphorus relative to carbon. For gray iron, a common expression is:
$$CE = C + \frac{1}{3}(Si + P)$$
In our practice, we used direct measurement via carbon-silicon analyzers and spectroscopy, but this formula underpins the theoretical basis for CE control. A low CE, as initially targeted, promotes a larger austenite growth interval, leading to finer dendrites and increased strength through microstructure refinement. However, it also increases the risk of shrinkage and stress due to reduced graphite precipitation during solidification.
Melting was conducted in a 2-ton medium-frequency induction furnace, employing a synthetic cast iron approach to minimize the genetic effects of pig iron. Charge materials consisted of 60–70% high-quality carbon steel scrap, 20–30% returns of the same grade, and only 10% Q10 pig iron. To adjust chemistry, we used silicon carbide (90% purity, 2–9 mm grain size) at 1.0–1.5% for silicon and carbon addition, along with medium-temperature graphite-based carburizers (1.5–2.0% addition) with low sulfur (≤0.25%) and nitrogen (≤1000 ppm) content. These materials were added in batches with the charge. After reaching 1450°C, the melt was sampled for analysis and adjusted to target chemistry. It was then heated to 1480–1500°C, held for 3–5 minutes for homogenization, and tapped for inoculation.
Inoculation is crucial for graphite nucleation and avoiding chill in machine tool castings. We used a dual-inoculation process with a long-lasting silicon-calcium-barium inoculant. The primary inoculation was performed during tapping at 0.4% addition (3–8 mm grain size), using a funnel for stream addition. Secondary inoculation was done during pouring at 0.05–0.1% addition (0.2–0.7 mm grain size), again via stream inoculation. Barium enhances graphite nucleation potency and resists fade, ensuring a uniform Type A graphite distribution and minimizing white iron formation. This practice aimed to achieve consistent microstructure and mechanical properties across the machine tool casting sections.
The performance of the original process was assessed through statistical analysis of 100 sets of data from a specific bed casting. The CE averaged 3.635%, carbon 3.077%, and silicon 1.652%, as shown in control charts (Figure 2 analogs, but here we describe trends). Tensile strength from separately cast test bars exceeded 300 MPa, averaging 364 MPa with a maximum of 400 MPa. Metallographic examination revealed over 90% Type A graphite and over 98% pearlite, with graphite lengths at grade 3–4. These results met the basic HT300 specifications, indicating adequate strength and microstructure in controlled test conditions.
However, several critical defects emerged in actual machine tool castings, undermining their usability. First, bed castings exhibited high linear shrinkage rates, measured at 1.4%, compared to the typical 1.0–1.2% for gray iron. This excessive shrinkage led to cracking in internal ribbing, particularly near guideway sections where thickness variations caused differential solidification stresses. Cracks appeared after rough grinding, affecting about 10% of castings, as shown in illustrative examples (though not referenced by figure numbers). Second, worktable castings displayed shrinkage porosity in T-slot bottoms, a defect unacceptable for machining surfaces. Analysis via scanning electron microscopy (SEM) confirmed shrinkage cavities with minimal oxides, ruling out gas porosity. Third, hardness non-uniformity was evident: edges and lugs showed hard spots causing tool chipping and drill breakage during machining, while thicker sections remained softer. This inconsistency stemmed from the low CE, which increased shrinkage tendency and promoted carbides in thin sections, degrading machinability.
These issues highlighted the limitations of a low-CE approach for machine tool castings. While strength was achieved, the trade-offs in stress, shrinkage, and hardness uniformity were unacceptable. We recognized that a higher CE could reduce shrinkage and stress, but it might lower strength. To compensate, microalloying with elements like copper and tin was proposed. Copper refines pearlite, improves graphite morphology, and reduces section sensitivity, while tin strongly promotes pearlite formation. Their combined effect allows for high CE without sacrificing strength. Thus, we optimized the process by raising CE to 3.75–3.85% and adding controlled amounts of Cu and Sn, with the constraint that Cu + 10Sn ≤ 0.8% to avoid embrittlement. The revised composition is detailed in Table 2.
| Element/Parameter | Target Range | Typical Average |
|---|---|---|
| Carbon Equivalent (CE) | 3.75–3.85 | 3.768 |
| Carbon (C) | 3.15–3.25 | 3.189 |
| Silicon (Si) | 1.65–1.75 | 1.711 |
| Manganese (Mn) | 0.80–0.90 | 0.85 |
| Phosphorus (P) | < 0.05 | 0.03 |
| Sulfur (S) | 0.06–0.10 | 0.08 |
| Copper (Cu) | 0.40–0.50 | 0.45 |
| Tin (Sn) | 0.02–0.03 | 0.025 |
To further enhance melt purity and microstructure refinement, we increased the superheating temperature to 1500–1520°C, holding for 5 minutes before tapping. This practice reduces inheritance effects from charge materials and improves graphite nucleation. The inoculation process remained unchanged, as it already provided effective nucleation. The relationship between CE and properties can be modeled empirically. For instance, tensile strength (σ) often inversely correlates with CE, but with microalloying, the trend shifts. A simplified model for optimized machine tool castings might be:
$$\sigma = \sigma_0 – k \cdot CE + \alpha \cdot Cu + \beta \cdot Sn$$
where σ₀ is a base strength, k is a coefficient for CE effect, and α and β are strengthening coefficients for copper and tin. In our case, the addition of 0.45% Cu and 0.025% Sn compensates for the strength loss from raising CE by approximately 0.13%, allowing us to maintain σ above 300 MPa.
Validation of the optimized process involved statistical analysis of 100 sets of data from the same bed casting model. The average CE increased to 3.768%, carbon to 3.189%, and silicon to 1.711%, indicating successful adjustment. Tensile strength averaged 341 MPa, within the 300–350 MPa target range for optimal stress balance. Elastic modulus, a key indicator of stiffness for machine tool castings, was measured on 70 samples, averaging 126.64 GPa with a range of 110–150 GPa. Hardness uniformity improved significantly: on 20 consecutive bed castings, hardness ranged from 180 to 200 HBW, averaging 188.85 HBW, which meets machining requirements without local hard spots. Metallography showed nearly 100% pearlite with Type A graphite at grade 4, confirming refined microstructure. Most importantly, cracking defects were eliminated, linear shrinkage reduced to 1.2–1.3%, and T-slot shrinkage porosity disappeared, as verified by customer feedback.
The improvement in machine tool casting quality stems from synergistic effects of higher CE and microalloying. Higher CE reduces shrinkage propensity by increasing graphitization, which compensates for solidification contraction. The volumetric change during solidification of gray iron can be approximated by:
$$\Delta V \propto -f_g \cdot \rho_g + f_a \cdot \rho_a$$
where f_g and f_a are volume fractions of graphite and austenite, and ρ_g and ρ_a are their densities. More graphite (favored by higher CE) reduces overall shrinkage. Copper and tin enhance pearlite fineness and uniformity, raising strength and hardness without inducing carbides. Copper also improves thermal conductivity, reducing thermal gradients and stress. For machine tool castings, residual stress (σ_res) is critical; it can be estimated from cooling rates and phase transformations. Our optimization lowered σ_res by promoting more uniform cooling and graphite expansion, as evidenced by reduced distortion.
In conclusion, the production of high-quality HT300 machine tool castings requires a holistic approach that balances carbon equivalent, alloying, and process parameters. By increasing CE to 3.75–3.85% and incorporating copper and tin microalloying, we achieved a superior combination of strength, stiffness, low stress, and defect-free castings. This optimized process enhances the performance and reliability of machine tool castings, critical for precision manufacturing. Future work may focus on further refining the silicon-to-carbon ratio, exploring real-time process control, and quantifying residual stresses through advanced techniques. The lessons learned underscore the importance of adaptive metallurgy in meeting the evolving demands of machine tool casting applications.
Throughout this discussion, the term “machine tool casting” has been emphasized to highlight its centrality in manufacturing. From beds to worktables, each machine tool casting serves as a backbone, and our process improvements directly contribute to the durability and accuracy of the final product. The integration of microalloying with process adjustments represents a significant advancement in the field, offering a blueprint for producing high-performance machine tool castings that meet stringent industrial standards.