
The manufacturing of high-integrity, thin-walled, and geometrically complex components is a persistent challenge in the foundry industry. Among various casting techniques, Low-Pressure Die Casting (LPDC) has emerged as a superior method for producing premium-quality aluminum alloy castings. The process involves forcing molten metal from a sealed furnace into a die cavity located above it by applying a controlled gas pressure, typically in the range of 20-100 kPa. This method offers significant advantages over gravity die casting and high-pressure die casting, including smoother mold filling, reduced turbulence and air entrapment, superior metallurgical quality due to directional solidification from the farthest point back to the pressurized feed source, and higher yield as elaborate gating and risering systems are often unnecessary. These characteristics make LPDC particularly suitable for safety-critical and structurally demanding shell castings used in automotive, aerospace, and military applications. However, the successful production of defect-free shell castings hinges on precise control over process parameters such as filling pressure profile, die temperature, and cooling conditions. Traditional trial-and-error methods for process development are costly and time-consuming.
This article presents a comprehensive study on the optimization of the LPDC process for a specific aluminum alloy shell casting utilizing finite element method (FEM) based numerical simulation. The objective is to systematically analyze the filling and solidification stages, predict potential casting defects, and propose effective optimization strategies to enhance casting quality. The workflow integrates computer-aided design, advanced meshing techniques, transient thermo-fluid dynamics simulation, and data-driven process refinement, providing a virtual prototyping platform for shell castings.
1. Mathematical Modeling of the LPDC Process
The physical phenomena during LPDC are governed by the principles of fluid dynamics and heat transfer, encompassing the flow of molten metal, heat exchange with the die and cores, phase change, and the potential formation of defects. Accurate numerical simulation requires solving coupled equations describing these processes.
1.1 Governing Equations
The flow of the incompressible molten metal is described by the Navier-Stokes equations, modified to account for the phase change and the associated porosity formation. The continuity and momentum equations in a fixed Eulerian framework are:
$$ \nabla \cdot \vec{u} = 0 $$
$$ \rho \left( \frac{\partial \vec{u}}{\partial t} + (\vec{u} \cdot \nabla) \vec{u} \right) = -\nabla p + \nabla \cdot (\mu \nabla \vec{u}) + \rho \vec{g} + \vec{S}_m $$
Here, $\vec{u}$ is the velocity vector, $p$ is the pressure, $\rho$ is the density, $\mu$ is the dynamic viscosity, $\vec{g}$ is the gravitational acceleration vector, and $\vec{S}_m$ represents momentum sources, such as the Darcy term used in the porous media approach for the mushy zone during solidification, often expressed as:
$$ \vec{S}_m = – \frac{(1-\beta)^2}{(\beta^3 + \epsilon)} A_{mush} \vec{u} $$
where $\beta$ is the liquid fraction, $\epsilon$ is a small constant to prevent division by zero, and $A_{mush}$ is the mushy zone constant, a large number that drastically reduces velocity in solidified regions.
The energy equation, which includes the latent heat of fusion, is solved to obtain the temperature field:
$$ \rho c_p \left( \frac{\partial T}{\partial t} + \vec{u} \cdot \nabla T \right) = \nabla \cdot (k \nabla T) + \dot{Q}_L $$
where $T$ is temperature, $c_p$ is the specific heat, $k$ is the thermal conductivity, and $\dot{Q}_L$ is the latent heat source term, given by $\rho L \frac{\partial f_s}{\partial t}$, with $L$ being the latent heat and $f_s$ the solid fraction. The relationship between solid fraction and temperature is critical and is typically modeled using a linear or Scheil-type approximation based on the alloy’s solidification range.
The evolution of air/gas entrapment and shrinkage porosity is often predicted using criteria functions. The widely used Niyama criterion, $G/\sqrt{\dot{T}}$, where $G$ is the temperature gradient and $\dot{T}$ is the cooling rate, is calculated post-solidification to identify regions prone to microporosity. For macro-shrinkage prediction, a mass conservation-based approach tracking the feeding flow and the inability of liquid to compensate for volumetric shrinkage is employed.
1.2 Initial and Boundary Conditions
Accurate simulation requires precise definition of initial and boundary conditions. For the LPDC of shell castings, these include:
Pressure Boundary Condition: The key driver for mold filling. A time-pressure curve is applied at the inlet (bottom of the stalk tube). This curve is divided into stages:
- Ramping/Pre-pressurization: A slow initial pressure rise to bring the metal to the gate without turbulence.
- Filling Stage: A controlled pressure increase to fill the cavity at a desired velocity (typically 0.2-0.5 m/s for aluminum).
- Intensification/Pressure Hold: A final pressure increase and hold to feed shrinkage during solidification.
- Pressure Release: Pressure is released after complete solidification.
The pressure required, $p$, can be estimated hydrostatically: $p = H \rho g K$, where $H$ is the total metal height from the bath surface to the top of the casting, $\rho$ is the metal density, $g$ is gravity, and $K$ is a factor (1.0-1.5) accounting for system resistance.
Thermal Boundary Conditions: Heat transfer at the metal-die and metal-core interfaces is modeled using a heat transfer coefficient (HTC): $q = h_{int} (T_{cast} – T_{die})$. The HTC value is complex, varying with contact pressure, air gap formation, and surface coatings. Typical values are:
- Metal/Permanent Die (good contact): 1000 – 3000 W/m²·K
- Metal/Sand Core: 500 – 800 W/m²·K
Radiation and convection to the environment are also considered for the exterior surfaces of the die.
Initial Conditions: The molten metal temperature (pouring temperature), and the initial temperatures of the die and cores (pre-heat temperatures) must be specified. A uniform temperature is a common assumption for the initial die state.
2. Case Study: Aluminum Alloy Shell Casting
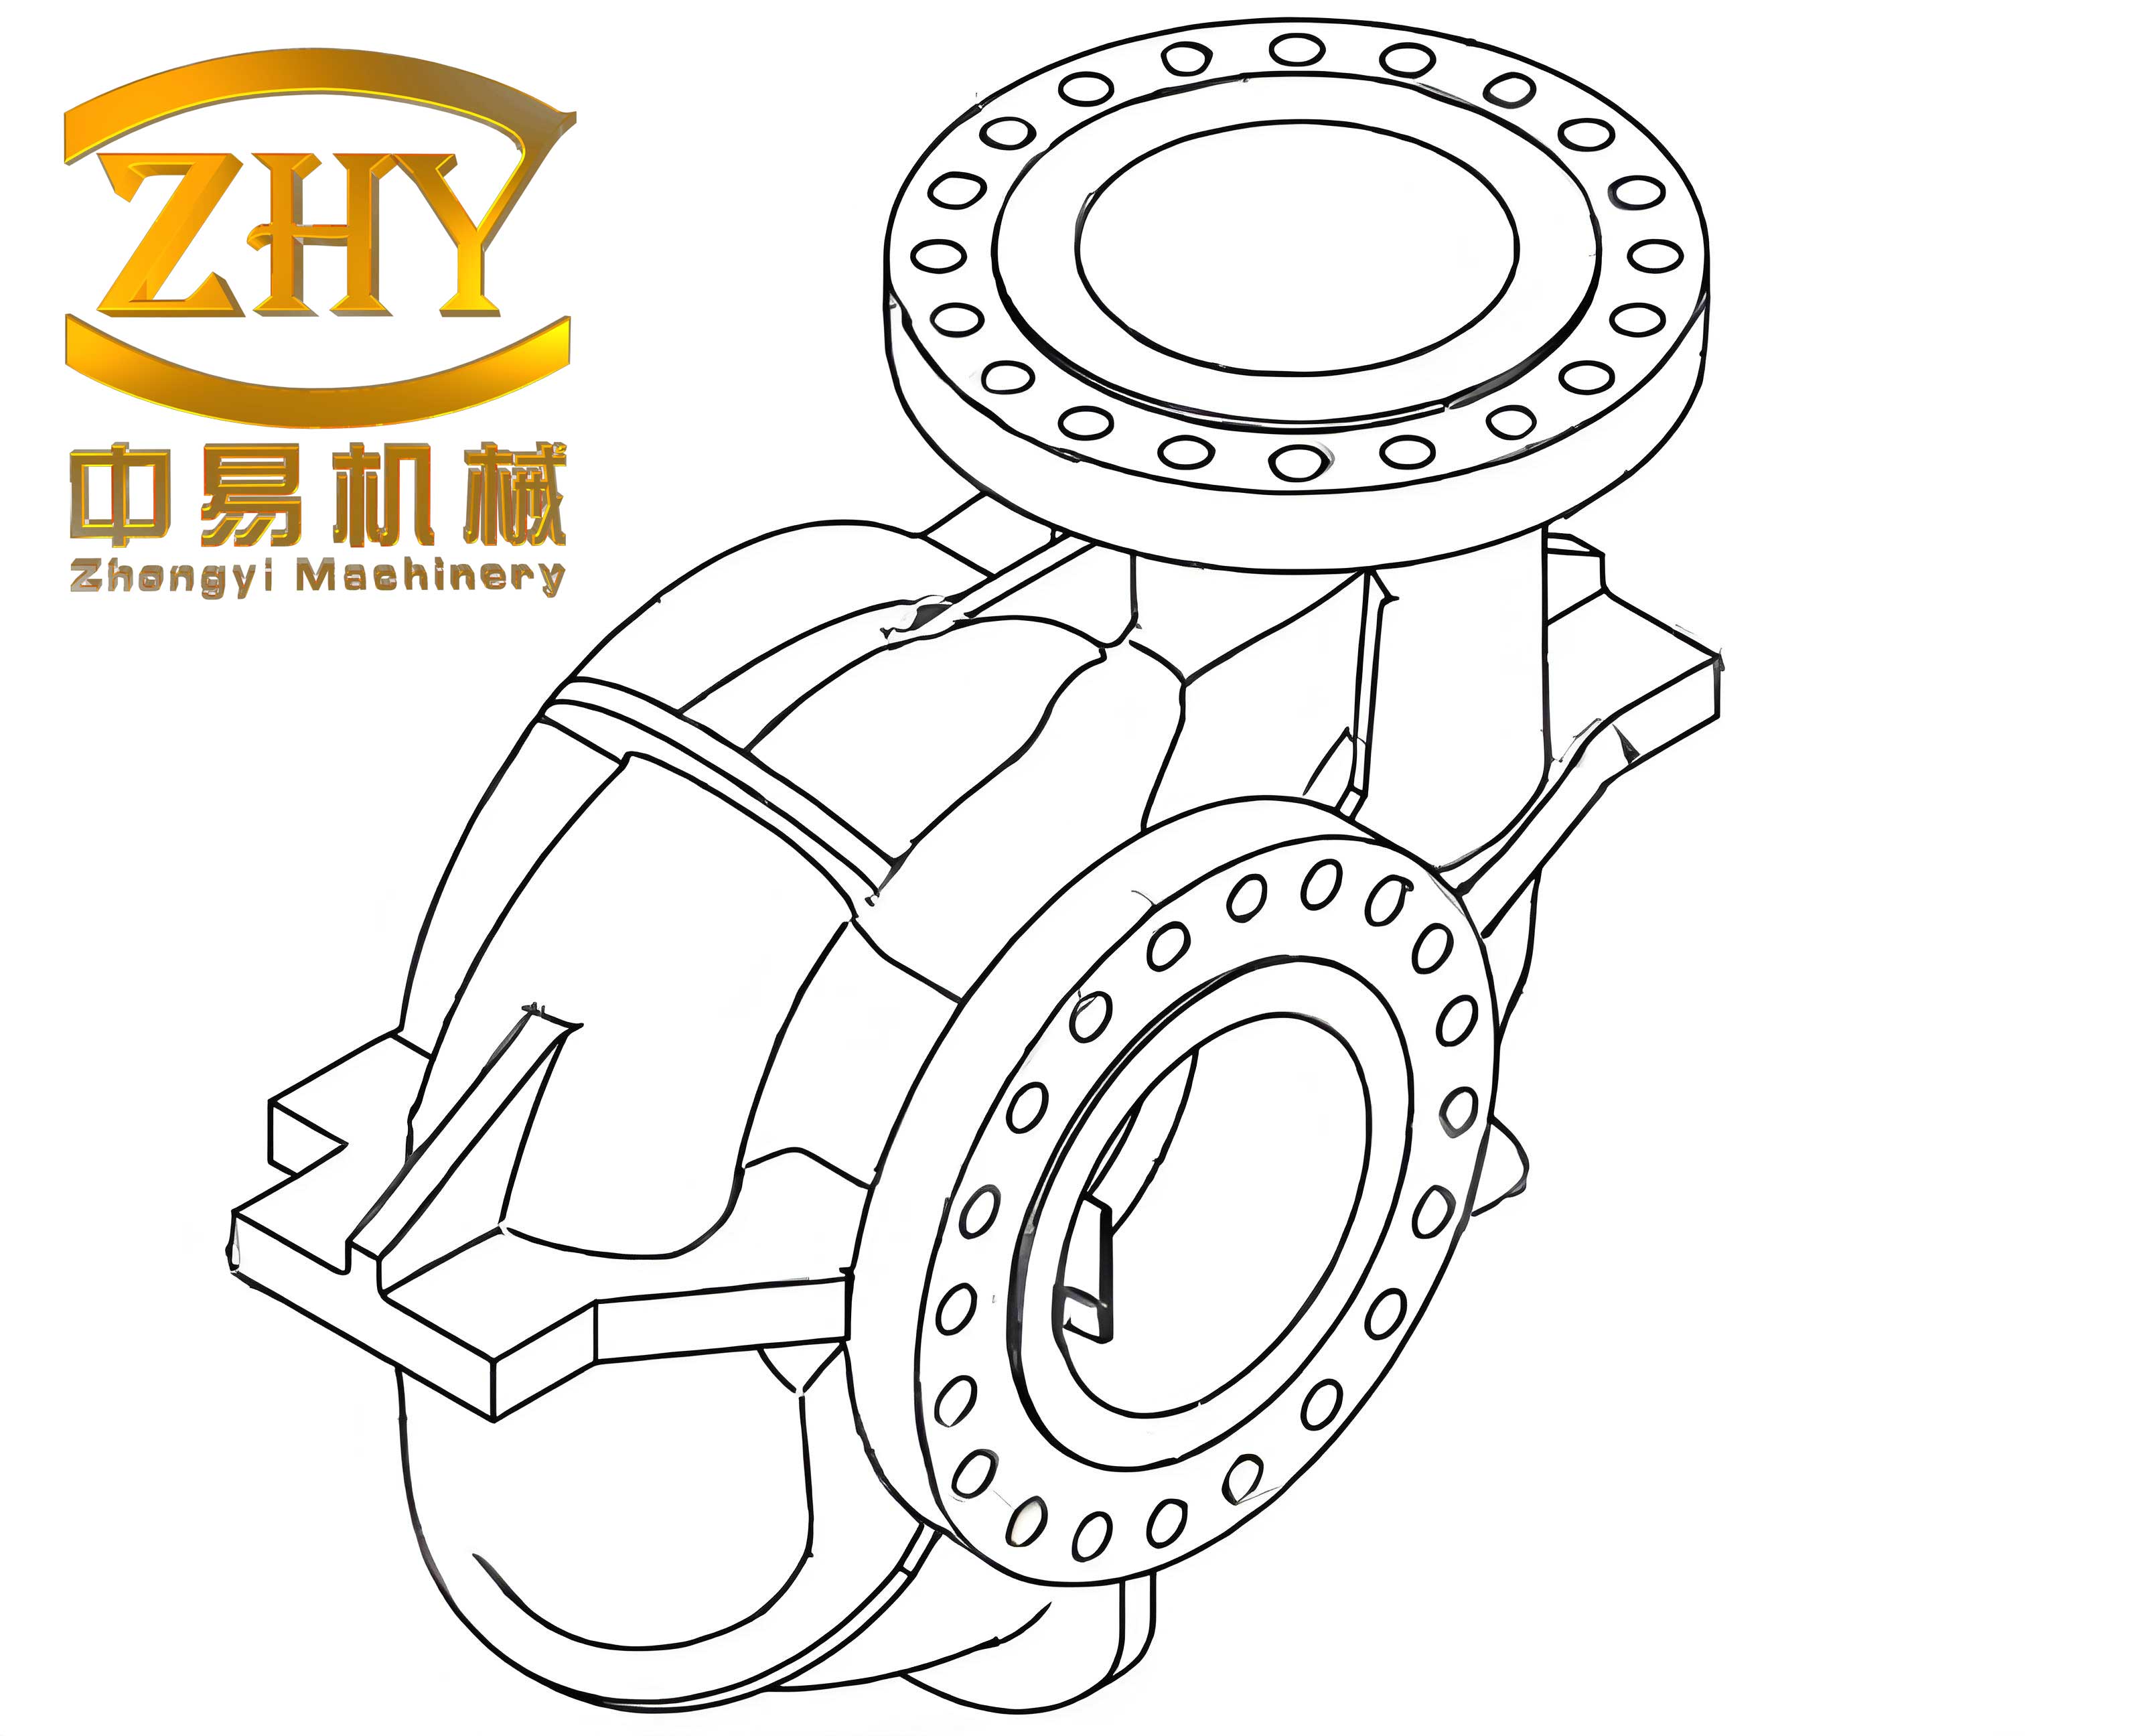
The subject of this optimization study is a structural aluminum alloy shell casting made from a common casting alloy like A356 (Al-Si7Mg) or ZL106 (Al-Si7Mg). These shell castings are characterized by their complex geometry, varying wall thickness, and the presence of internal features requiring sand cores.
2.1 Geometric Features and Process Design
The shell casting is a 3D complex part with an approximate height of 145 mm. The wall thickness is non-uniform, featuring thin sections of around 4-5 mm and thicker bosses or rib intersections up to 15-20 mm, which act as natural hot spots. A vertical gating system with a central sprue located at the bottom of the casting is chosen. This bottom-filling design promotes smooth, non-turbulent filling and establishes a favorable thermal gradient for directional solidification towards the feeder (the sprue itself). The gating system is designed to minimize surface area and heat loss. A sand core is used to form the internal cavity of the shell casting. The die is made of tool steel (e.g., H13), and the core is made of resin-bonded sand.
2.2 Numerical Model Setup
A 3D CAD model of the assembly—casting, gating, die, and core—is created. A conformal finite element mesh is generated, with finer elements (e.g., 2-4 mm edge length) in the casting and gating areas to accurately resolve fluid flow and thermal gradients, and coarser elements (e.g., 10-20 mm) in the die blocks to reduce computational cost. The total element count can range from 1 to 5 million for such a shell casting assembly. Material properties (density, specific heat, conductivity, viscosity as a function of temperature, solidification path) for the alloy, die steel, and sand are assigned from integrated databases.
The initial conditions and boundary conditions are applied as described in Section 1.2. The critical pressure-time curve is defined based on theoretical calculation and engineering experience. For comparative analysis, three different filling times (and thus pressure ramp rates) are often simulated to assess their impact on filling turbulence and final quality.
| Stage | Pressure (kPa) | Time – Profile 1 (s) | Time – Profile 2 (s) | Time – Profile 3 (s) |
|---|---|---|---|---|
| Ramp to Fill Start | ~3-5 | 2.0 | 1.5 | 1.0 |
| Filling | ~15-25 (final) | 4.0 | 3.0 | 2.0 |
| Intensification/Hold | ~30-50 | 60.0 | 60.0 | 60.0 |
| Release | 0 | 5.0 | 5.0 | 5.0 |
3. Simulation Results and Defect Prediction
3.1 Filling Pattern Analysis
The simulation of the filling stage provides a visual and quantitative assessment of the melt front advancement. For a well-designed LPDC process for shell castings, the metal should rise steadily and uniformly from the bottom gate, maintaining a relatively flat front. This minimizes turbulence, vortex formation, and subsequent air entrapment or oxide film folding. The simulation outputs, such as velocity vectors and temperature distribution during filling, are analyzed. High-velocity zones, particularly at gate entries or sudden section changes, can be identified. An ideal fill pattern shows a gradual temperature drop from the gate to the melt front without severe chilling.
3.2 Solidification Sequence and Shrinkage Prediction
The post-filling solidification analysis is paramount for predicting shrinkage porosity, the most common defect in dense shell castings. The software tracks the evolution of the solid fraction over time. A desirable “directional solidification” pattern is where the sections farthest from the gate (or hot spots) solidify first, and the gate/sprue area remains liquid longest, acting as a thermal and mass feeder. The solidification path is visualized using isosurfaces of solid fraction (e.g., 0.3, 0.7, 1.0).
Areas that solidify last, isolated from a feeding source, are flagged as potential shrinkage zones. The software often provides a quantitative metric for shrinkage porosity volume, calculated based on the inability to feed volumetric contraction ($\Delta V/V \approx \alpha \Delta T_{solidification}$). For aluminum alloys, the volumetric shrinkage is approximately 6-7%. A cross-sectional view through predicted defect locations, often correlated with low values of the Niyama criterion ($G/\sqrt{\dot{T}}$), reveals the size and location of macro- and micro-shrinkage within the thick sections of the shell casting.
The results for the three pressure profiles from Table 1 might be summarized as follows:
| Profile | Filling Behavior | Predicted Shrinkage Porosity Volume (%) | Main Defect Location |
|---|---|---|---|
| 1 (Slow Fill) | Very smooth, but high heat loss to die | ~0.8% | Upper thick boss |
| 2 (Medium Fill) | Smooth, balanced heat loss | ~0.5% | Upper thick boss, junction |
| 3 (Fast Fill) | Slight surface turbulence, minimal heat loss | ~1.2% | Multiple isolated hot spots |
Profile 2 offers the best compromise, leading to the lowest predicted defect volume for this specific shell casting geometry.
4. Process Optimization and Discussion
Based on the defect prediction from the initial simulation (e.g., using Profile 2), targeted optimization strategies are devised and evaluated virtually. The goal for shell castings is to eliminate isolated liquid pockets and enhance directional solidification towards the pressurized feeder.
4.1 Optimization Strategy: Localized Cooling (Chills)
A highly effective method to eliminate hot spots in permanent mold casting is the application of chills. Chills are inserts of high thermal conductivity material (e.g., copper, aluminum bronze) placed in the die at strategic locations. They extract heat rapidly from specific regions of the casting, accelerating solidification and effectively “shifting” the thermal center.
In the context of the studied shell casting, the simulation identified a critical hot spot at a thick boss located away from the main feeding path. Two potential chill locations were evaluated virtually:
- Location A (External Chill): A copper chill insert embedded in the steel die wall adjacent to the external surface of the hot spot boss.
- Location B (Internal/Core Chill): A copper chill embedded within the sand core, contacting the internal surface of the hot spot boss.
The thermal properties of the chill (high conductivity, ~400 W/m·K for copper) and its interfacial contact with the casting/die are modeled with appropriate HTCs.
4.2 Evaluation of Optimized Designs
New simulations are run with the modified die/core assemblies including the chills. The solidification sequence is analyzed and compared with the baseline. The effectiveness is measured by the reduction or elimination of the predicted shrinkage volume in the target area and the overall improvement in directional solidification.
| Configuration | Solidification Sequence Change | Predicted Shrinkage at Hot Spot | Overall Porosity Reduction |
|---|---|---|---|
| Baseline (No Chill) | Hot spot solidifies last, isolated. | Major macro-porosity predicted. | Baseline (0.5%) |
| With External Chill (A) | Solidification front from chill advances, but still leaves isolated liquid deeper in section. | Reduced, but micro-porosity band predicted. | ~0.3% |
| With Internal Core Chill (B) | Chill extracts heat from the core, solidifying the boss interior first. Creates a clear path for feeding from the gate. | Defect eliminated. | ~0.1% (only in other minor areas) |
The results clearly indicate that the internal core chill (Location B) is vastly superior for this particular geometry. The external chill (A) cools the outer surface but may create a “skin” that traps liquid inside, leading to a microporous region. The core chill, however, places the highest cooling power at the thermal center of the problem area, effectively inverting the solidification gradient to start from the inside and feed from the outside/gate. This demonstrates that the optimal solution is not always intuitive and depends heavily on the specific geometry and thermal mass distribution of the shell casting.
4.3 Additional Optimization Considerations
Beyond chills, other parameters can be optimized in sequence or in tandem:
- Die Temperature Control: Simulating with different initial die temperatures or active die heating/cooling channels can balance the solidification rate.
- Gating Design Modifications: Adjusting the size, location, or number of gates to better feed problematic areas.
- Alloy Modification: While not a process parameter per se, simulating with different alloy properties (e.g., a different Si content affecting the solidification range) can predict its impact on feeding requirements.
- Intensification Pressure Profile: Optimizing the timing and magnitude of the pressure increase during the hold stage can improve feeding efficiency, especially for complex, thin-walled shell castings where feeding paths are long and narrow.
5. Conclusion
The integration of numerical simulation into the development cycle of Low-Pressure Die Casting processes for aluminum alloy shell castings represents a paradigm shift in foundry engineering. This study has demonstrated a systematic approach: from the establishment of accurate mathematical models and boundary conditions, through the detailed simulation of filling and solidification for a complex shell casting, to the data-driven identification of defects and the virtual testing of optimization strategies. The case study highlighted that an internal core chill was the most effective solution to eliminate a critical shrinkage defect, a conclusion that might have been missed or required multiple physical trials to discover. By enabling the prediction and elimination of defects in the virtual environment, numerical simulation significantly reduces development time, material waste, and cost, while ensuring the production of high-reliability shell castings. The methodology is universally applicable, providing a powerful tool for the continuous improvement and innovation in the manufacturing of sophisticated metal components.