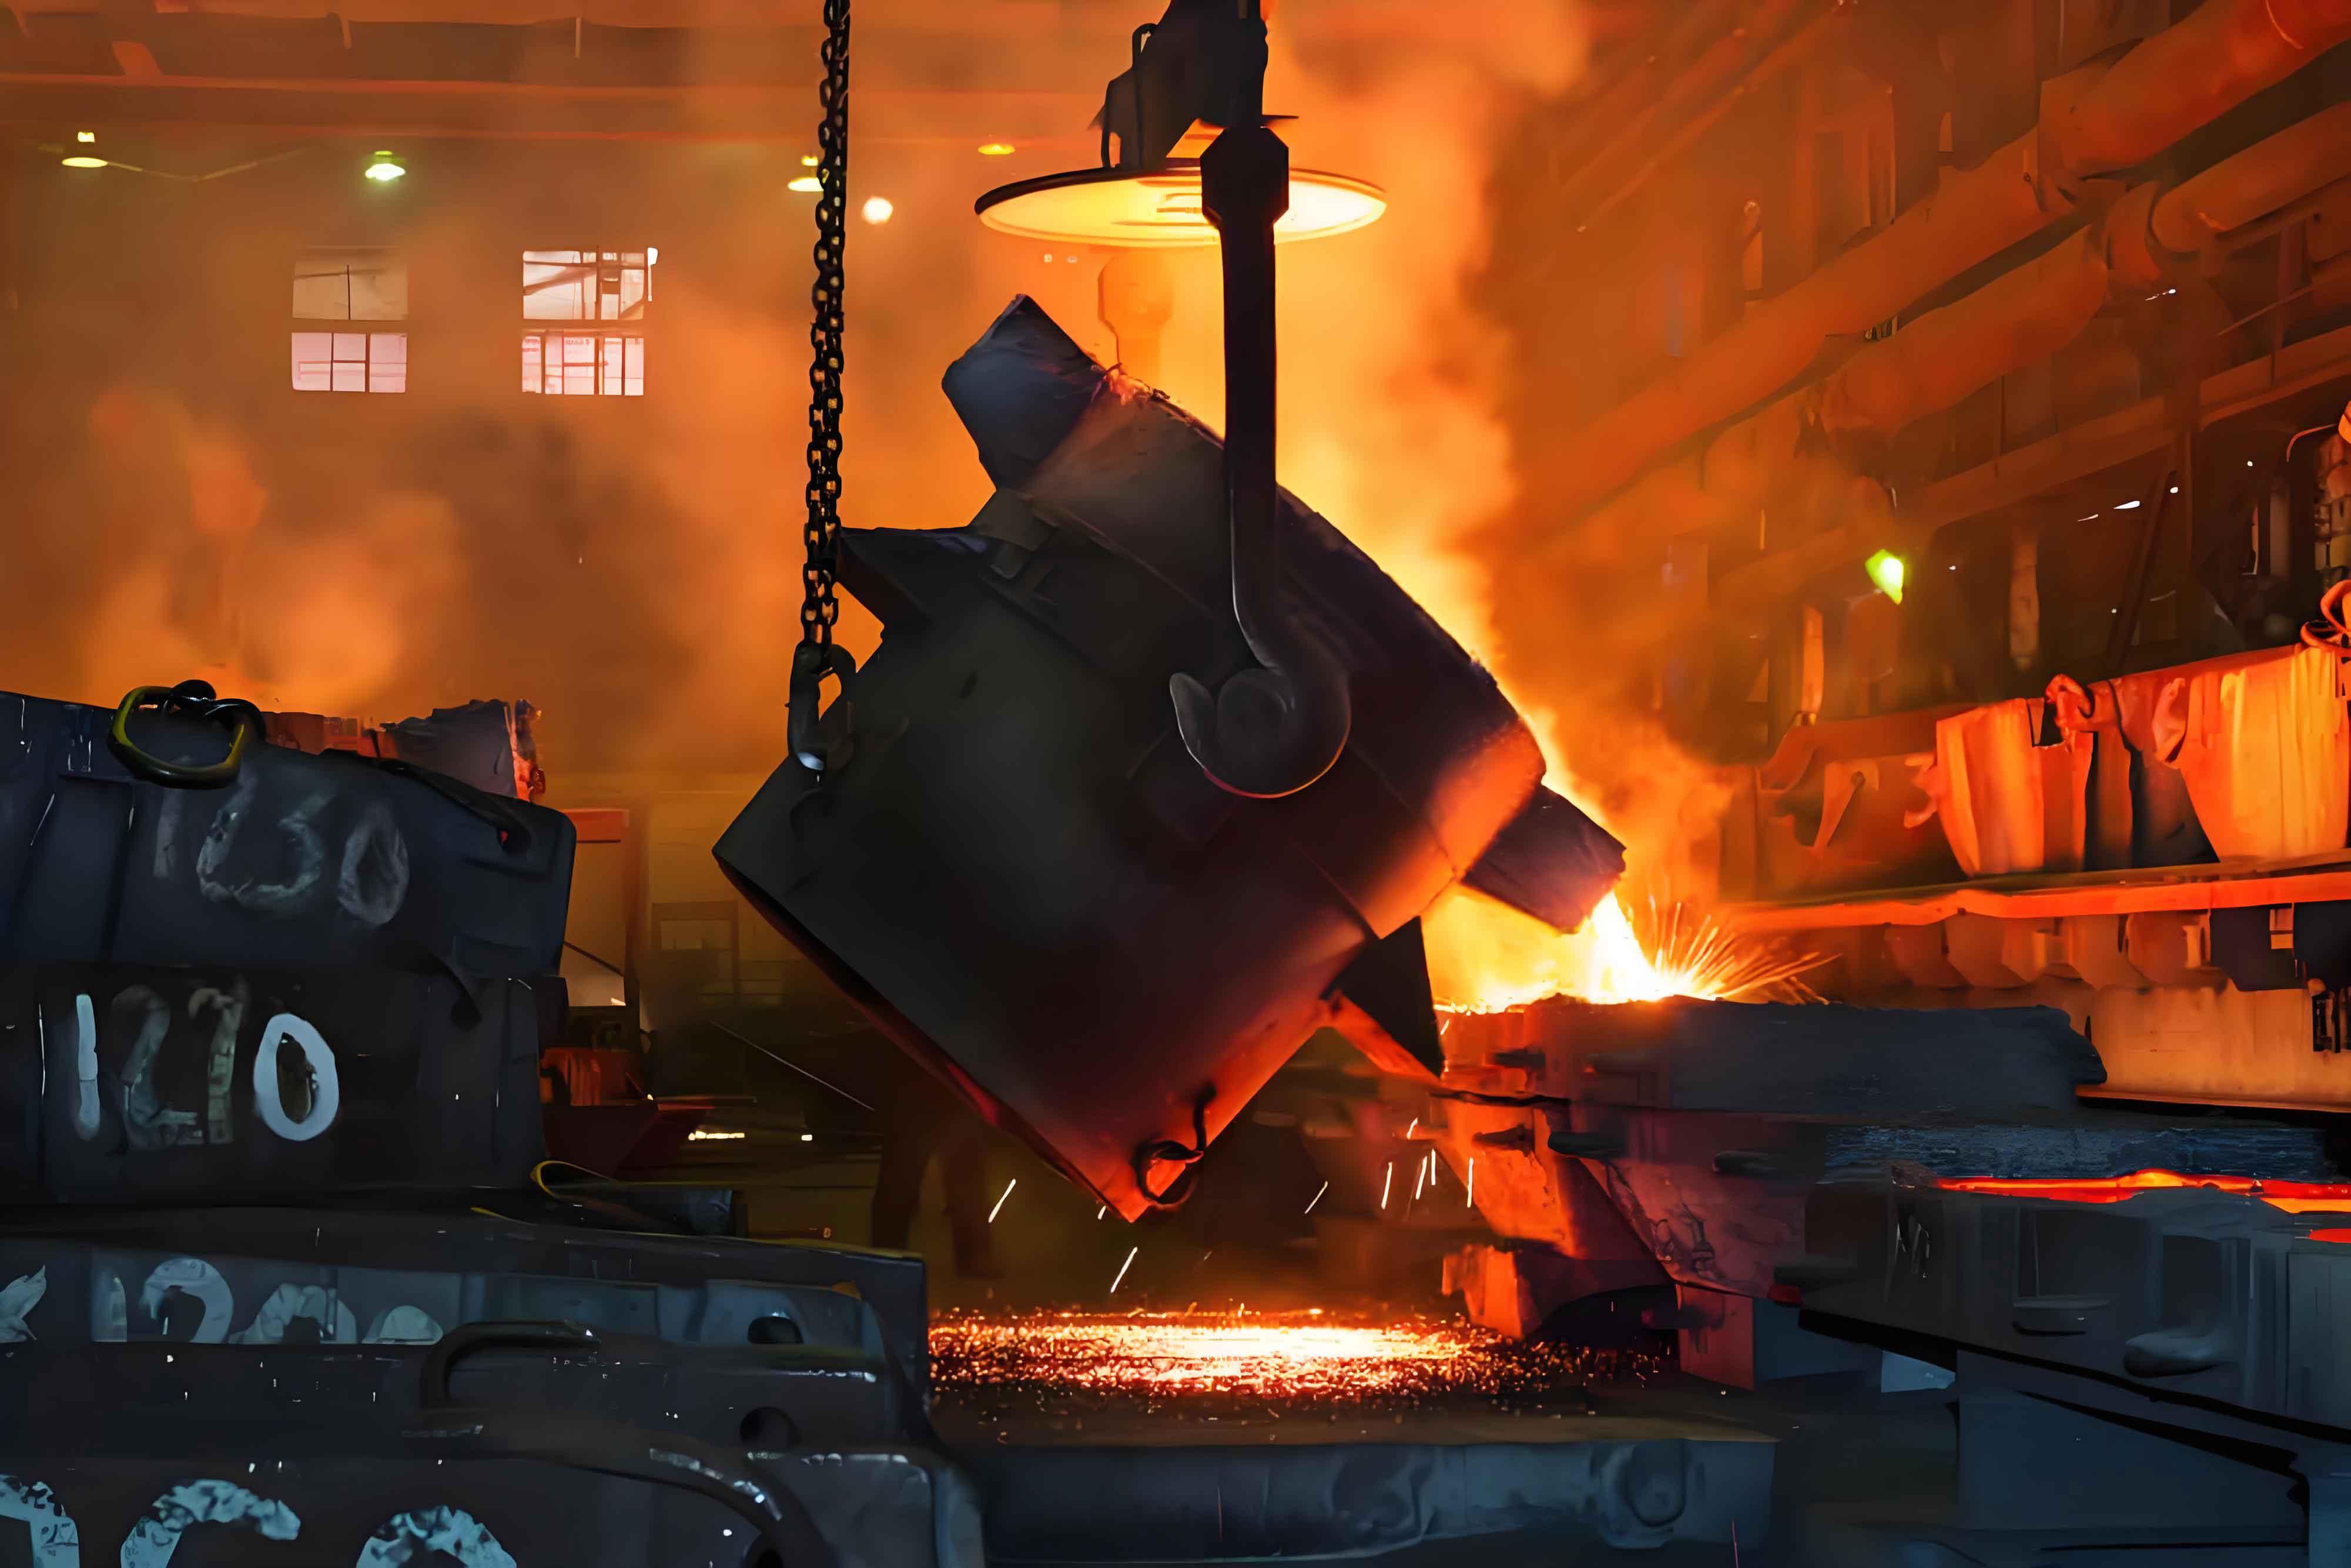
This study systematically investigates the filling behavior of grey cast iron in expendable pattern casting (EPC) through orthogonal experiments and single-factor tests. A self-developed 64-channel data acquisition system was employed to record metal front progression using electrical contact sensors and thermocouples.
1. Orthogonal Experimental Analysis
The L18(37) orthogonal array evaluated seven critical parameters:
| Factor | Level 1 | Level 2 |
|---|---|---|
| Vacuum (kPa) | 0 | -25 |
| Pattern Density (g/cm³) | 0.018 | 0.028 |
| Coating Permeability | 0.8 | 1.6 |
| Pouring Temperature (°C) | 1350 | 1420 |
| Metal Head (mm) | 150 | 300 |
| Ingate Area (mm²) | 60 | 120 |
| Wall Thickness (mm) | 6 | 12 |
The regression equation for filling velocity (V, mm/s) was derived as:
$$ V = 0.86X_1 – 15.32X_2 + 0.0023X_3 + 0.017X_4 + 0.12X_5 + 0.004X_6 – 0.25X_7 $$
Where variables represent normalized parameter values. Factor significance order was determined as: Vacuum > Pattern Density > Pouring Temperature > Metal Head > Wall Thickness > Coating Permeability > Ingate Area.
2. Single-Factor Experimental Results
2.1 Vacuum Influence
| Vacuum (kPa) | Filling Time (s) | Velocity (mm/s) |
|---|---|---|
| 0 | 8.2 | 24.4 |
| -15 | 5.6 | 35.7 |
| -25 | 4.1 | 48.8 |
| -40 | 3.8 | 52.6 |
Vacuum demonstrated linear correlation with filling velocity (R²=0.98) within -25kPa to -40kPa range. Excessive vacuum (>-40kPa) caused metal penetration defects.
2.2 Pattern Density Effects
$$ \frac{dV}{d\rho} = -0.87\ \mathrm{mm·s^{-1}·(g/cm^3)^{-1}} $$
For grey cast iron, the optimal pattern density range was 0.018-0.024 g/cm³. Higher densities increased pyrolysis products and backpressure:
$$ P_{back} = 1.34\rho^{1.2}T^{0.6}\ \mathrm{(kPa)} $$
Where ρ=pattern density (g/cm³), T=pouring temperature (°C).
2.3 Pouring Temperature Paradox
The velocity-temperature relationship exhibited non-monotonic behavior:
| Temperature (°C) | Velocity (mm/s) |
|---|---|
| 1320 | 31.2 |
| 1380 | 42.5 |
| 1420 | 47.8 |
| 1450 | 43.1 |
| 1480 | 40.3 |
Peak velocity occurred at 1420°C due to competing mechanisms:
$$ Q_{decomp} = \alpha A(T_m – T_p)^4\Delta t $$
$$ Q_{cooling} = h_cA(T_m – T_e)\Delta t $$
Where α=radiation coefficient, hc=convection coefficient, Tm=metal temp, Tp=pattern temp, Te=environment temp.
2.4 Coating Permeability Impact
| Permeability (cm⁴/g·min) | Velocity (mm/s) |
|---|---|
| 0.8 | 28.4 |
| 1.2 | 34.7 |
| 1.6 | 39.2 |
The velocity enhancement factor β for coatings follows:
$$ \beta = 0.68K^{0.33} $$
Where K=coating permeability (cm⁴/g·min).
3. Flow Front Characteristics
Grey cast iron exhibited radial flow patterns regardless of gating design. The front progression followed:
$$ r(t) = \sqrt{\frac{2P_{eff}t}{\mu \ln(R/r_0)}} $$
Where r=front radius, Peff=effective pressure, μ=dynamic viscosity, R=casting radius.
4. Process Optimization Guidelines
- Maintain vacuum between -25kPa to -35kPa
- Control pattern density ≤0.024 g/cm³
- Optimize pouring temperature at 1400-1420°C
- Use coatings with permeability ≥1.2 cm⁴/g·min
- Employ side gating with velocity modifier:
$$ V_{side} = 1.27V_{bottom} $$
This comprehensive study establishes fundamental relationships between process parameters and filling behavior of grey cast iron in EPC, providing quantitative guidance for industrial applications.
