
Three-way valve bodies sit at the junctions of high-pressure piping in aerospace, marine, gas transmission, water conservancy and new-energy systems, where they split, merge, throttle or shut off flow. Because a leak or a fracture at a port propagates through the whole circuit, the casting must combine pressure tightness, dimensional accuracy at the machined ports and sufficient ductility to survive assembly torque. Austenitic stainless steel is the usual material choice for corrosive or high-temperature service, and investment casting is the usual route to the complex internal cavity, since the lost-wax process delivers a near-net-shape part with a smooth bore and a high material utilization compared with forging followed by extensive machining.
Two failure modes dominate production of these parts. The first is shrinkage: a tee body has a thin inclined bore meeting thick hexagonal port bosses, so the thin section freezes before the heavy section has been fed, isolating a liquid pocket that later solidifies as porosity. The second is distortion, which appears as ovality of the machined ports when the wall thickness around a boss is not symmetric and contraction therefore proceeds at different rates on either side. For the component discussed here — a 2.42 kg SCS16 body with a maximum wall of 24.96 mm and a minimum wall of 4 mm — plant records before process optimization showed porosity in roughly 70% of the production lot and port ovality outside the 0.5 mm (port A) and 0.4 mm (port B) limits in about 80% of it. Trial-and-error correction on the shop floor is slow and expensive for such a part, because each iteration consumes a wax injection, a shell build, a burnout cycle and a melt.
Numerical simulation changes the economics of that iteration. Filling, solidification and stress can be solved on a finite-element mesh before any tooling is cut, and the predicted porosity field can be tested against a criterion rather than against a scrapped casting. The prediction used here is the Niyama criterion, which compares the local temperature gradient G with the cooling rate R at the end of solidification:
$$N=\frac{G}{\sqrt{R}}$$
Where N falls below a critical value, feeding through the dendrite network is interrupted and microporosity forms. The criterion is an indicator of tendency rather than a measurement, but it localizes the last-fed region well enough to guide gating changes.
Material: SCS16 austenitic stainless steel
SCS16 is a molybdenum-bearing austenitic stainless steel of the 316 family, with a fully face-centred-cubic matrix. Chromium provides the passive oxide film responsible for corrosion resistance, nickel stabilizes the austenite, and molybdenum improves resistance to pitting in chloride-containing media. The face-centred-cubic structure supplies twelve slip systems, which gives the alloy its high ductility and formability but also its pronounced work-hardening tendency during machining of the ports. Its specified chemistry is given in Table 1.
| C | Si | Mn | P | S | Cr | Ni | Mo | Fe |
|---|---|---|---|---|---|---|---|---|
| ≤0.03 | ≤1.5 | ≤2.0 | ≤0.04 | ≤0.04 | 17–20 | 12–16 | 2–3 | balance |
The thermophysical data used in the simulation were taken from the material database of the ProCAST package and checked against handbook values for the grade. Three features of that data matter for the casting. First, the solid fraction falls steeply above about 1400 °C, which places the liquidus in the range expected for a 316-type alloy and sets the minimum superheat needed for a 4 mm wall. Second, the thermal conductivity rises with temperature, drops sharply near 1350 °C and then recovers; the discontinuity coincides with the solid-state transformation in which the lattice arrangement changes and phonon scattering increases. Third, the Newtonian viscosity falls continuously between 1200 °C and 2000 °C, so the alloy fills more readily when poured hot, at the cost of greater liquid shrinkage. Young’s modulus is essentially constant to about 400 °C and then decreases, which means the solid shell is stiff during the early part of solidification and progressively less able to accommodate thermal strain later.
Casting geometry and baseline process
The body measures 150 × 130 × 70 mm, with a maximum outside diameter of 78 mm at the connecting bosses. Two side ports carry hexagonal flats, so the wall thickness around each port circumference is not uniform; the upper region is thick, while the upper half of the inclined bore is thin. A baseline process was defined using the foundry’s standard sprue-cup feeding-capacity method: one sprue cup, a horizontal runner, a排气-free arrangement of ingates and a排气筋 (vent rib) connecting cup and runner to release gas and prevent cold shuts. The baseline parameters are listed in Table 2.
| Pouring temperature | Shell firing temperature | Filling time | Shell thickness | Shell material |
|---|---|---|---|---|
| 1640 °C | 1100 °C | 4 s | 6 mm | Mullite |
The mesh was generated in the ProCAST Mesh module after repairing surface connectivity in the SolidWorks solid: 4 mm elements on the sprue cup and runners, 2 mm on the castings, giving 195,858 surface elements and 45,906 volume elements, with a six-layer shell. Interfacial heat transfer was set to 500 W/(m²·K) between metal and shell and 10 W/(m²·K) between shell and air, values taken from published measurements and shop practice. Gravity was applied at 9.8 m/s², the casting and gating were defined as SCS16 alloy, the shell as refractory mullite, and the pouring region as a 12 mm radius at the cup with a 4 s fill.
Solidification mechanism revealed by the baseline simulation
Filling of the baseline design was uneventful: the metal entered the cup, passed through the runner and filled the three castings on the tree progressively between 1.06 s and 3.43 s, with no entrapment or misrun. The defects originated entirely in solidification. The thin upper half of the inclined bore froze first and closed the feeding path from the heavy upper section, leaving the lower end of the bore as an isolated liquid region that could only be partly fed from the lower end of the right-hand boss. The side ports froze unevenly for a different reason — the wall thickness around the hexagonal flats varies, so contraction on the thin side is completed while the thick side is still liquid, generating thermal stress rather than a feeding problem.
Predicted effective stress followed that pattern: 386 MPa on average at the left port, 379 MPa at the right port, and 541 MPa at the inclined bore, with the highest values at the thin-to-thick transitions and at the lower end of the inclined bore. The corresponding defect predictions were a shrinkage pore volume of 1.95 cm³, concentrated at the inclined bore, and an average deformation of 0.325 mm at the three connecting ports, decreasing from the rim inward. Both predictions matched the defects seen on production castings, which is the necessary condition for using the model as a design tool.
Redesigning the gating system
Sizing followed the foundry’s equivalent hot-spot method. The equivalent hot-spot diameter of the ingate is
$$D_g=kD_c$$
with Dc the equivalent hot-spot diameter of the casting section, obtained by reducing the rectangular section of the port boss to an equivalent cylinder (15 mm here), and k a weight factor read from the standard chart (0.82 for this casting mass). The result, Dg = 12.3 mm, sets the primary ingate; a secondary ingate of 3.5 mm equivalent diameter was added for local feeding. The sprue and runner followed Ds ≥ (1.1–1.2)Dg and Dk ≥ (1.15–1.25)Dg, giving 13.5–14.8 mm and 14.1–15.4 mm respectively, rounded to standard tooling: a cup of 78 mm top diameter, 49 mm bottom diameter and 85 mm height, and a runner 175 mm long, 45 mm wide and 29 mm high.
The first redesign added a second ingate at the upper end of the right-hand boss, where it could feed the lower end of the inclined bore without sitting on a non-machined surface, and introduced a straight sprue to buffer the stream and promote bottom-up filling. Simulation of this configuration showed filling still smooth and stress reduced at two of the three locations — 315 MPa at the outer port (−20.3%) and 491 MPa at the inclined bore (−9.2%), with the inner port slightly up at 392 MPa (+3.4%) — while pore volume fell to 1.59 cm³ (−18.5%) and port deformation to 0.211 mm (−35%). The solidification sequence, however, exposed the weakness of the new ingate: it froze in the first 15–25% of solidification, before the hot spot it was meant to feed, so the isolated liquid region at the lower end of the inclined bore survived and the pore volume remained high. The ingate was therefore relocated to the lower end of the right-hand boss to shorten the feeding path. That change lengthens the sprue and lowers casting yield, an accepted trade-off because porosity, not metal utilization, was the limiting defect.
Parameter optimization with an orthogonal array and grey relational analysis
Gating fixes where metal can flow; the thermal schedule fixes how long it stays fluid. Three parameters were varied at three levels each: pouring temperature A (1610, 1640, 1670 °C), shell firing temperature B (1000, 1050, 1100 °C) and filling time C (4, 6, 8 s). A standard L9 orthogonal array was simulated on the relocated-ingate design, with pore volume and port deformation as the two quality objectives. The array and the responses are given in Table 3.
| Run | A: pouring temperature (°C) | B: shell temperature (°C) | C: filling time (s) | Pore volume (cm³) | Deformation (mm) | Grey relational grade | Rank |
|---|---|---|---|---|---|---|---|
| 1 | 1610 | 1000 | 4 | 0.0934 | 0.313 | 0.3660 | 8 |
| 2 | 1610 | 1050 | 6 | 0.0577 | 0.239 | 0.9208 | 1 |
| 3 | 1610 | 1100 | 8 | 0.0446 | 0.304 | 0.5644 | 3 |
| 4 | 1640 | 1000 | 6 | 0.0744 | 0.320 | 0.3823 | 6 |
| 5 | 1640 | 1050 | 8 | 0.0714 | 0.312 | 0.4115 | 4 |
| 6 | 1640 | 1100 | 4 | 0.0918 | 0.313 | 0.3697 | 7 |
| 7 | 1670 | 1000 | 8 | 0.0711 | 0.249 | 0.3849 | 5 |
| 8 | 1670 | 1050 | 4 | 0.1076 | 0.322 | 0.3333 | 9 |
| 9 | 1670 | 1100 | 6 | 0.0561 | 0.247 | 0.8088 | 2 |
Because the two objectives differ in magnitude and direction, they were first normalized by range transformation, then weighted objectively by the entropy method so that no operator judgement entered the weighting. For a decision matrix of m runs and n objectives, with pij the share of run i in the total of objective j, the entropy and weight are
$$e_j=-k\sum_{i=1}^{m}p_{ij}\ln p_{ij},\qquad k=\frac{1}{\ln m},\qquad w_j=\frac{1-e_j}{\sum_{j=1}^{n}\left(1-e_j\right)}$$
This assigned weights of 0.2873 to pore volume and 0.7127 to deformation, reflecting the wider relative spread of the deformation data across the nine runs. Grey relational coefficients were then computed against the ideal normalized value for each objective, with a distinguishing coefficient of 0.5, and combined into a single grade:
$$\xi_i(k)=\frac{\min_i\left|y_0(k)-y_i(k)\right|+\rho\max_i\left|y_0(k)-y_i(k)\right|}{\left|y_0(k)-y_i(k)\right|+\rho\max_i\left|y_0(k)-y_i(k)\right|},\qquad G_i=\sum_{k=1}^{n}w_k\,\xi_i(k)$$
Grades ranged from 0.3333 to 0.9208, and run 2 ranked first. Mean-grade range analysis gave RA = 0.2293, RB = 0.2033 and RC = 0.3476, so the significance order is shell firing temperature < pouring temperature < filling time: filling time dominates, and the two temperatures act almost equivalently. The optimum is A1B2C2 — 1610 °C pouring, 1050 °C shell, 6 s fill — which is a lower superheat and a slower fill than the baseline 1640 °C and 4 s.
The trend has a physical reading. Lowering the pouring temperature reduces the gap between pouring and liquidus temperature, so liquid shrinkage and the volume that must be fed both fall; increasing the filling time slows the entry of metal, keeps the thermal gradient between thick and thin sections smaller and gives the feeder more time to act. The penalty of an excessively high superheat is visible in runs 6 and 8, where pore volume rose above 0.09 cm³, and the penalty of an excessively slow fill appears in run 3, where pore volume reached its minimum (0.0446 cm³) but deformation did not improve correspondingly.
Predicted performance of the final design
Re-simulating the relocated-ingate design at 1610 °C, 1050 °C shell and 6 s gave bottom-up filling with the metal entering the castings before the runner, quiescent flow without turbulence or spatter, and a clean sequential solidification: castings first, then runner and ingates, then the cup. Pore volume fell to 0.0566 cm³, a 97% reduction against the baseline, and average port deformation to 0.24 mm, a 27% reduction. Effective stress dropped to 286 MPa at the left port (−25.9%), 329 MPa at the right port (−13.2%) and 392 MPa at the inclined bore (−27.5%). Table 4 summarizes the three design states.
| Indicator | Baseline | Gating redesign only | Final design |
|---|---|---|---|
| Shrinkage pore volume (cm³) | 1.95 | 1.59 | 0.0566 |
| Average port deformation (mm) | 0.325 | 0.211 | 0.240 |
| Effective stress, left/outer port (MPa) | 386 | 315 | 286 |
| Effective stress, right/inner port (MPa) | 379 | 392 | 329 |
| Effective stress, inclined bore (MPa) | 541 | 491 | 392 |
The gating-only and final columns are not a like-for-like comparison, since the first was run at 1640 °C and 4 s and the second at 1610 °C and 6 s; the slightly higher deformation of the final design relative to the gating-only case reflects that difference in thermal schedule, while the pore volume, the dominant mass-feeding defect, is an order of magnitude lower. A small residual porosity remained in the prediction near the upper ingate, attributed to insufficient feeding capacity there. On the shop floor this was countered by sprinkling an exothermic covering agent on the sprue cup and wrapping the cup and runner in insulating blanket before firing, which sustains a temperature gradient favourable to feeding.
Production validation
Tooling was machined in aluminium for light handling and wear resistance, split at the mid-plane of the body so that wax flows symmetrically through the cavity; a core rod inserted into the lower die forms the internal passage, and the closed cavity is injected through the wax nozzle.
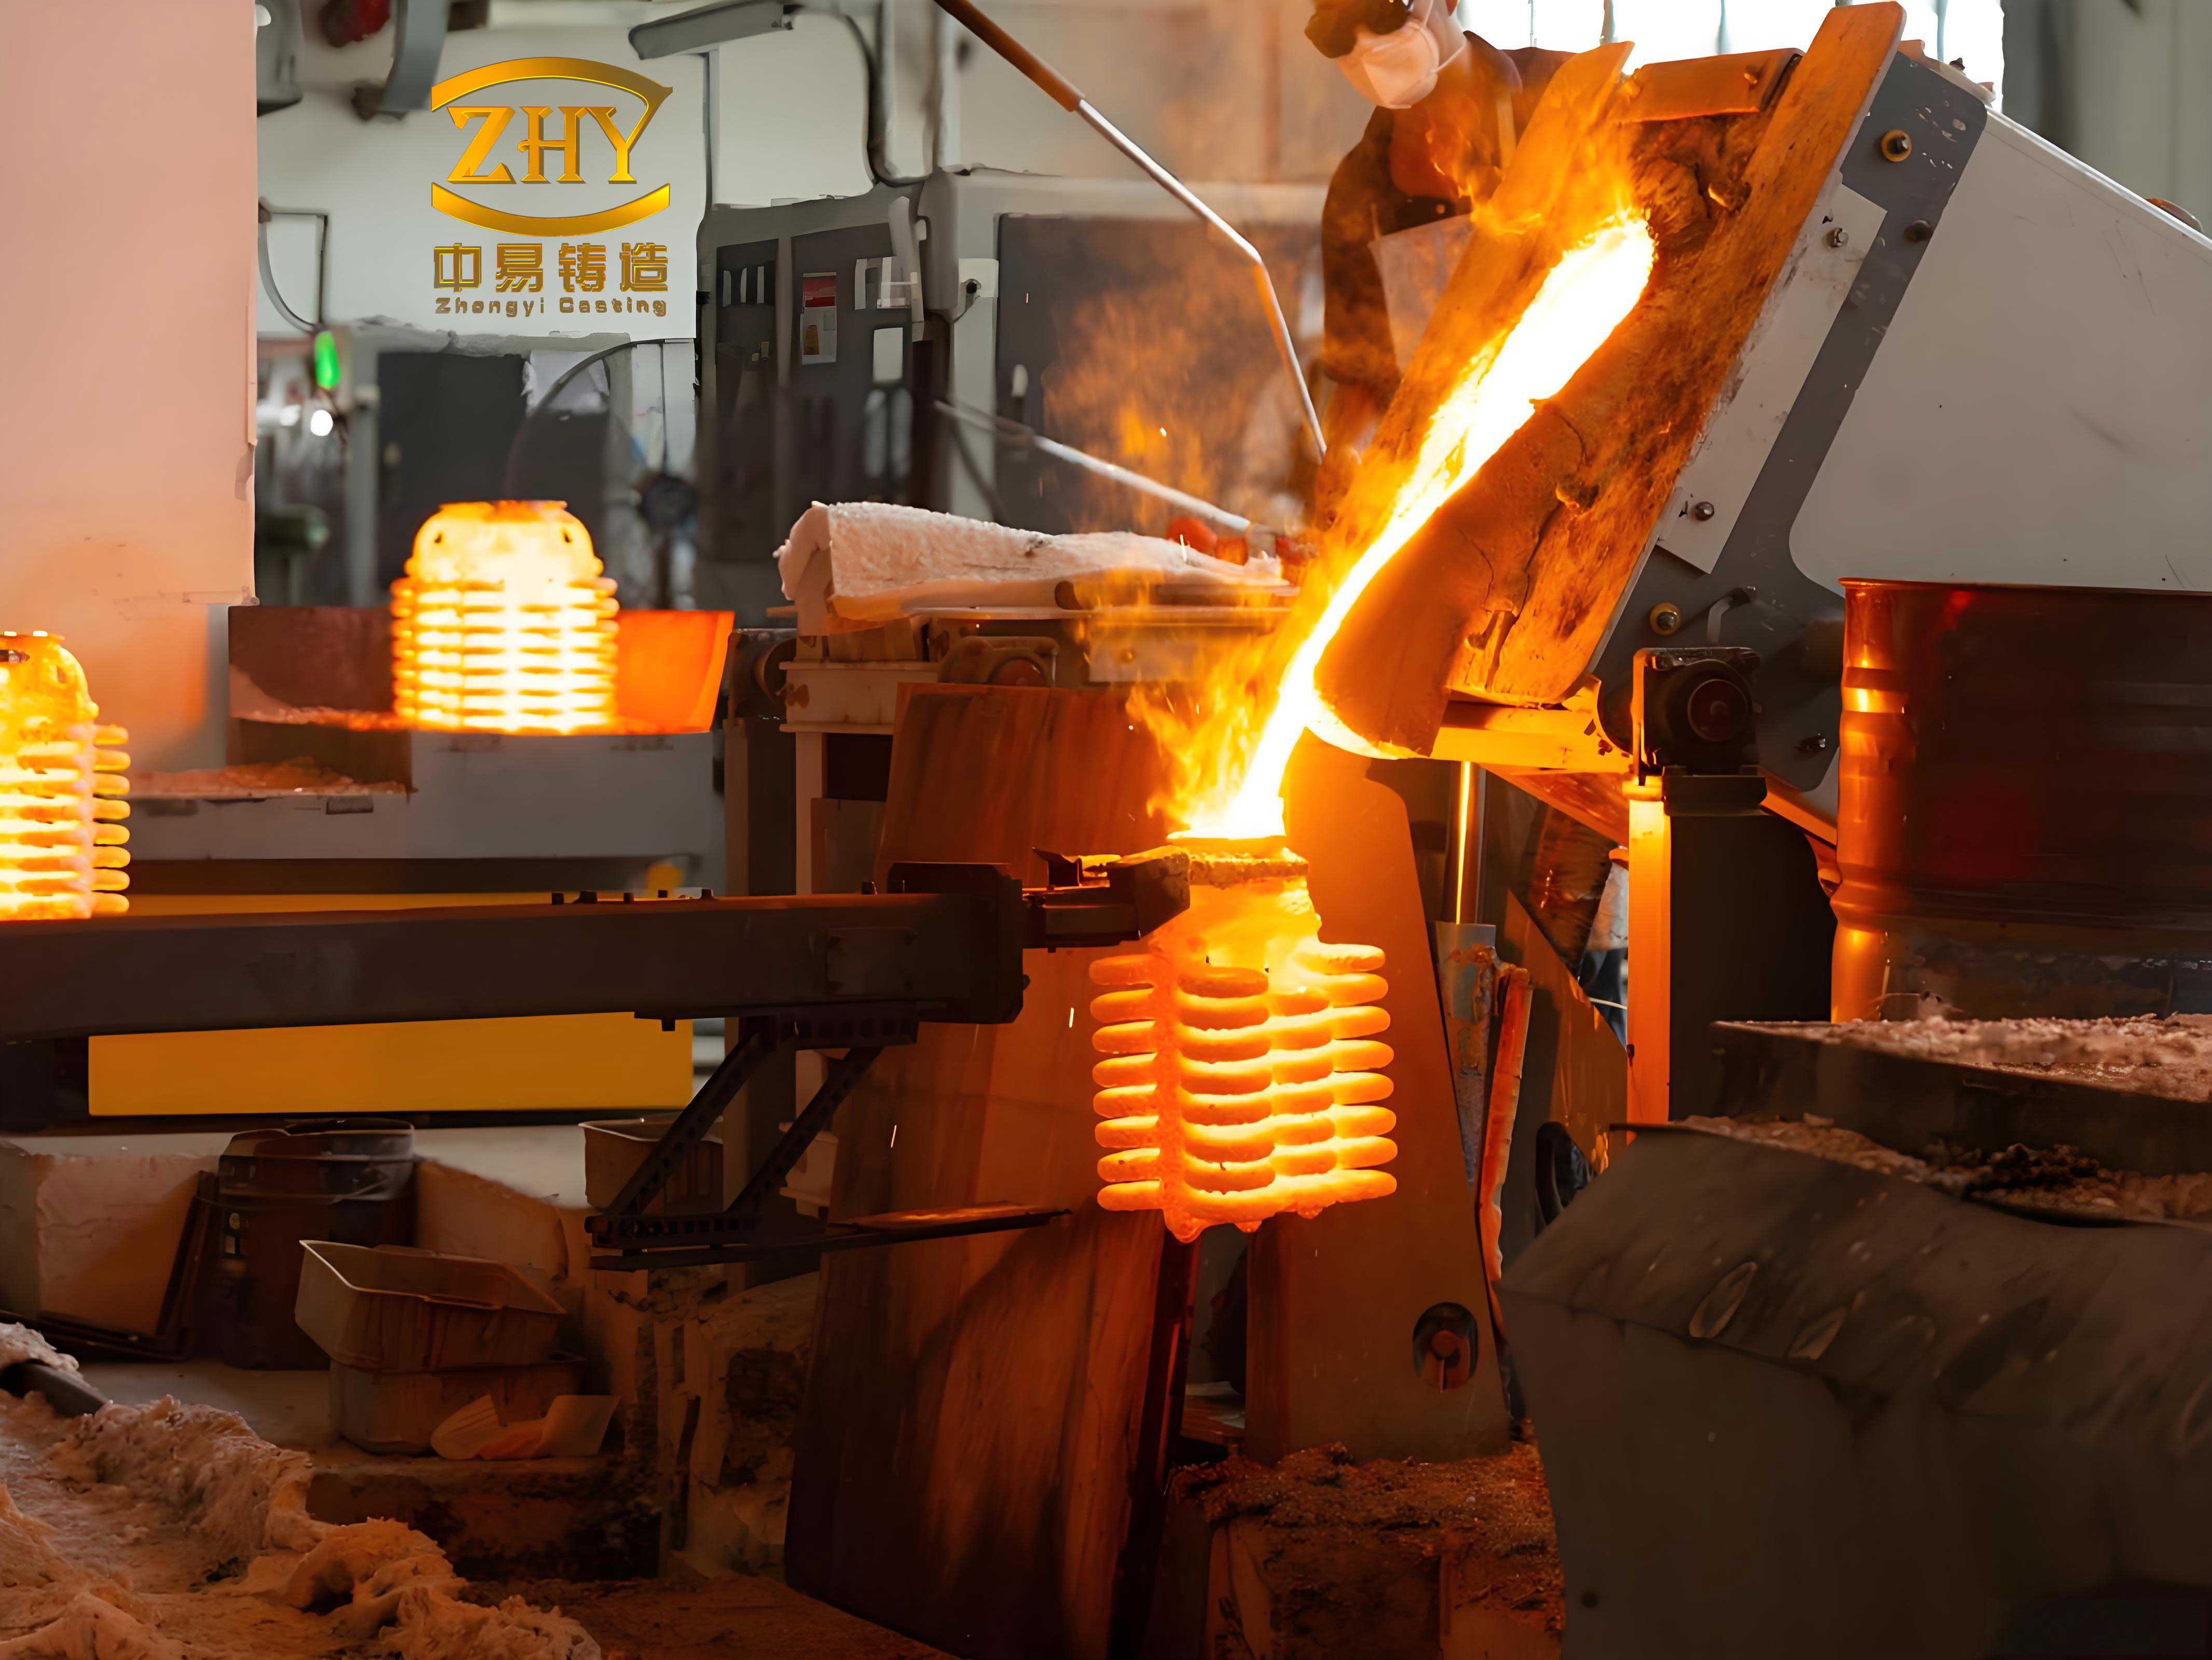
The shell was built in four layers over a silica-sol binder, with a zircon face coat, a corundum second layer, and mullite for the third and sealing layers. The face slurry was held at a powder-to-liquid ratio of 3.2–4:1 and a viscosity of 37–50 s, with viscosity decreasing layer by layer to develop a graded pore structure and adequate permeability. Zircon was chosen for the face because it is not wetted by the melt, strips cleanly and does not react with the steel; its irregular blocky particles pack tightly and reproduce the die surface. Corundum in the second layer bonds both to the face and to the backup layers, and its low expansion buffers thermal shock. Mullite in the backup layers provides the strength and permeability needed at temperature. The binder was silica sol (29–31% SiO2, pH 9–10, 12–16 nm colloidal particles) rather than water glass, because water glass shells crack and distort during dewaxing of complex parts. Shells were fired at 1050 °C for 30 min. The alloy was melted in a medium-frequency induction furnace, superheated to 1640 °C so that the stream arrives at 1610 °C, and poured in 6 s; the shell was then moved to a separate rack to avoid mutual heat interference during cooling.
Ten castings were produced, at a single weight of 2.42 kg and a tree weight of 10.8 kg; the reported casting yield was 44.8%. Visual inspection after acid pickling found smooth, well-defined surfaces with no oil staining, rust, oxidation scale, depression, swelling or sand inclusion, and complete legible markings. Dimensional verification on a coordinate measuring machine covered the nine features listed in Table 5, all falling inside the drawing tolerances of ±0.25 mm (0–25 mm), ±0.5 mm (25–50 mm), ±0.8 mm (50–100 mm) and ±1% above 100 mm; port A ovality was within 0.5 mm and port B within 0.4 mm.
| Feature | Drawing size | Measured | Result |
|---|---|---|---|
| 1 | Φ78 | 77.8 | Pass |
| 2 | 70 | 70.2 | Pass |
| 3 | Φ55 | 55.3 | Pass |
| 4 | 84.8 | 84.5 | Pass |
| 5 | 6.25 | 6.22 | Pass |
| 6 | 1 | 0.96 | Pass |
| 7 | 21.2 | 21.4 | Pass |
| 8 | Φ61 | 61.3 | Pass |
| 9 | Φ57.3 | 57.1 | Pass |
Internal quality was checked by industrial computed tomography (GE Phoenix v|tome|x M 400, 80 kV, 0.1 mA, 5 µm focal spot, source–object distance 100 mm, 500 ms integration, evaluated to GB/T 19293-2023). Baseline castings showed fine scattered dark regions at the Y-junction extending toward the outer diameter, the radiographic signature of lower-density shrinkage; after optimization the same views showed no irregular or circular dark areas anywhere in the casting, so the porosity predicted to disappear had in fact disappeared.
Mechanical properties, hardness and microstructure
Tensile bars were cast on the same tree, machined to GB 6397-86 (R16) geometry and tested at room temperature at 1 mm/min, with at least three specimens per condition. The optimized process raised every strength measure well above the drawing requirement (Table 6).
| Property | Before optimization | After optimization | Change | Requirement |
|---|---|---|---|---|
| Yield strength, Rp0.2 (MPa) | 196.7 | 280.8 | +42% | ≥175 |
| Tensile strength (MPa) | 452.4 | 563.1 | +24% | ≥390 |
| Elongation (%) | 49.5 | 55.5 | +12% | ≥33 |
The stress–strain curves for the optimized condition lie above the baseline throughout, so strength and ductility improved together rather than trading off. The metallurgical reason is grain refinement: the lower superheat raises the effective undercooling at nucleation, and the longer filling time allows more complete feeding and more uniform heat extraction, so the dendrite network is finer and the casting is denser. A finer dendritic structure shortens the slip distance and raises the stress needed for plastic flow while leaving the austenite free to accommodate strain.
Microhardness was measured with a digital tester at 750 N load and 10 s dwell, ten indents per region on polished sections, with the highest and lowest values discarded. Five regions (A–E) were compared with certified reference blocks, whose readings matched within 4%. Regions B and C, which fill and solidify most uniformly, were hardest in both conditions; regions D and E, which suffered insufficient feeding before optimization, were softer. The differences are small (Table 7) and the overall average rose only marginally, consistent with the modest change in solidification rate away from the porosity.
| Region | Before optimization | After optimization | Change |
|---|---|---|---|
| B | 169.9 | 173.0 | +1.8% |
| C | 172.0 | 171.0 | −0.6% |
| D | 158.0 | 164.0 | +3.8% |
| E | 159.7 | 165.0 | +3.3% |
Metallography (etched in 4 g CuSO4 + 20 mL HCl + 20 mL water, imaged optically and in a TESCAN VEGA3 SEM) showed the expected austenitic dendritic structure in both conditions, with clear primary trunks and secondary arms. In the baseline casting the precipitates were dense, dendritic to short-rod shaped, and partly continuous along grain boundaries; after optimization they were markedly fewer, finer and discontinuously dispersed. The precipitates are carbides, principally Cr23C6, which form because chromium, molybdenum and niobium have a high affinity for carbon and the carbide has a low free energy of formation. Where solidification is slow, solute enriches the interdendritic liquid and continuous carbide networks develop; where the cooling rate at the formerly porous location is higher, atomic diffusion is too limited for coarsening and the carbides remain as fine dispersoids.
Fracture surfaces support the same conclusion. Both conditions failed by ductile mechanisms, but the baseline showed dimples that were locally small and shallow, together with occasional undissolved second-phase particles at dimple centres acting as microvoid nucleation sites and a coarser dendritic pattern consistent with a larger superheat and slower nucleation. After optimization the dimples were more numerous, larger and deeper, indicating greater plastic deformation before separation and more uniform microstructure, and secondary cracking was limited.
What the case establishes, and what it does not
The sequence — baseline simulation to identify the feeding path that closes first, gating change to restore access to the hot spot, orthogonal design with entropy-weighted grey relational analysis to set the thermal schedule, then production trials with CT and tensile verification — reduced the development cycle to a small number of physical iterations. The mechanism identified at the start (thin-wall freeze-off isolating the lower inclined bore) was the same mechanism the final design addressed, and the predicted 97% drop in pore volume was confirmed by the absence of dark regions on CT. Coupling an objective weighting method to a small L9 array is what made the parameter study affordable: nine simulations replaced several dozen trial castings.
Three limitations should be kept in view. The pore volumes quoted are simulation outputs from the Niyama post-processing, not measurements, so their absolute values carry model error even though the relative ranking is reliable; the CT result verifies the direction of the change, not the numbers. The deformation comparison across design states is confounded by the simultaneous change in pouring temperature and filling time, so the individual contribution of the relocated ingate to distortion reduction cannot be separated from the thermal schedule. And the conclusions are tied to one geometry, one alloy and one shell system: the significance order (filling time > pouring temperature ≈ shell temperature) is a property of this thin-to-thick tee body, and a heavier section or a different shell conductivity would be expected to shift the balance toward the shell temperature. Extending the approach to automatic gating and parameter search, rather than operator-selected levels, is the natural next step.