
In the field of precision casting, investment casting is widely employed for manufacturing complex components like valve bodies, which are critical in aerospace, military, and energy applications due to their role in controlling fluid flow under high-pressure conditions. However, defects such as shrinkage porosity, shrinkage cavities, and deformation often arise during the investment casting process, compromising the mechanical properties and reliability of castings. This study focuses on optimizing the investment casting process for a stainless steel three-way valve body to mitigate these issues. By integrating numerical simulation with grey correlation analysis, we investigate the effects of key process parameters, including pouring temperature, shell roasting temperature, and pouring time, on casting quality. The objective is to identify the optimal combination of parameters that minimizes defects and enhances the overall integrity of the casting, thereby improving the efficiency and cost-effectiveness of precision casting operations.
The valve body under study is made of SCS16 stainless steel, a material commonly used in investment casting for its corrosion resistance and strength. The chemical composition of SCS16 is detailed in Table 1, which highlights elements such as chromium, nickel, and molybdenum that contribute to its properties. Thermal physical parameters for SCS16 and the mullite ceramic shell, obtained from the ProCAST database, are essential for accurate simulation of the casting process. These parameters include thermal conductivity, specific heat, and density, which influence heat transfer and solidification behavior. The valve body features a three-way structure with varying wall thicknesses, ranging from 4 mm to 24.96 mm, and a total length of 150 mm. This non-uniform geometry predisposes the casting to defects, particularly in thicker sections where heat accumulation occurs, leading to shrinkage and deformation in the original process.
| C | Si | Mn | P | S | Ni | Cr | Mo | Fe |
|---|---|---|---|---|---|---|---|---|
| <0.03 | <1.5 | <2 | <0.04 | <0.04 | 12-16 | 17-20 | 2-3 | Bal. |
To address the defects observed in the initial investment casting setup, we employed ProCAST software for numerical simulation. The original gating system, a top-pouring design, was modeled and meshed with element sizes of 4 mm for runners and 2 mm for the casting, resulting in 195,858 surface elements and 45,906 volume elements. Simulation parameters included a gravity acceleration of 9.8 m/s², a shell material of refractory mullite, and initial conditions such as a pouring temperature of 1,640°C and shell roasting temperature of 1,050°C. The heat transfer coefficient between the casting and shell was set to 500 W/(m²·K), with air cooling at 10 W/(m²·K) and an ambient temperature of 20°C. The filling time was 4 seconds, typical for precision casting processes. Results from the simulation revealed significant shrinkage porosity volumes of up to 1.95 cm³ and deformation up to 0.0325 cm, primarily at the thick junctions of the valve body, indicating inadequate feeding and non-sequential solidification.
The optimization strategy involved redesigning the gating system to include additional ingates for better feeding of thick sections, promoting directional solidification. Subsequently, an orthogonal experimental design was implemented to systematically evaluate the influence of process parameters. Three factors—pouring temperature (A), shell roasting temperature (B), and pouring time (C)—were selected, each at three levels, as outlined in Table 2. This design facilitated a comprehensive analysis of parameter interactions while minimizing the number of experiments, which is crucial for efficient investment casting optimization.
| Level | A (°C) | B (°C) | C (s) |
|---|---|---|---|
| 1 | 1,610 | 1,000 | 4 |
| 2 | 1,640 | 1,050 | 6 |
| 3 | 1,670 | 1,100 | 8 |
The orthogonal array L9 was used to define nine experimental trials, as shown in Table 3, with responses measured in terms of shrinkage porosity volume and deformation amount. These quality indicators are critical in precision casting, as they directly affect the structural integrity of the final product. To handle the multi-objective nature of the optimization, grey correlation analysis was applied, which is particularly suitable for small sample sizes and complex systems like investment casting. The analysis began with data normalization to render the responses dimensionless, using the formula:
$$y_i = \frac{x_i – \min x_i}{\max x_i – \min x_i}$$
where \(x_i\) is the original value for the i-th trial, and \(y_i\) is the normalized value. This step ensures comparability across different units and scales. Next, the grey correlation coefficient was calculated to quantify the relationship between each trial and an ideal reference sequence. The coefficient is given by:
$$\delta_i = \frac{\min |y_i^0 – y_i| + \rho \max |y_i^0 – y_i|}{|y_i^0 – y_i| + \rho \max |y_i^0 – y_i|}$$
where \(y_i^0\) represents the ideal normalized value (set to 0 for minimization objectives), and \(\rho\) is the distinguishing coefficient, typically set to 0.5 to balance sensitivity. To account for the relative importance of each quality indicator, the entropy weight method was employed to assign weights objectively. This involved constructing a decision matrix from the experimental data, normalizing it for negative indicators (where lower values are better) using:
$$\lambda_{ij} = 0.998 \times \frac{\max_j y_{ij} – y_{ij}}{\max_j y_{ij} – \min_j y_{ij}} + 0.02$$
followed by calculating the proportion of each indicator:
$$p_{ij} = \frac{\lambda_{ij}}{\sum_{i=1}^m \lambda_{ij}}$$
and the information entropy:
$$e_j = -k \sum_{i=1}^m p_{ij} \ln p_{ij}$$
with \(k = 1 / \ln m\). The weight for each indicator was then derived as:
$$w_j = \frac{1 – e_j}{\sum_{j=1}^n (1 – e_j)}$$
Table 4 presents the calculated weights, showing that deformation amount has a higher weight (0.7127) than shrinkage porosity volume (0.2873), reflecting its greater impact on casting quality in this investment casting application.
| Indicator | Shrinkage Porosity Volume | Deformation Amount |
|---|---|---|
| Weight | 0.2873 | 0.7127 |
The grey correlation degree for each trial was computed as the weighted sum of the correlation coefficients:
$$G_i = \sum_{j=1}^n w_j \delta_i$$
with results summarized in Table 5. This table includes the original response values, normalized data, correlation coefficients, and overall grey correlation degrees, ranked to identify the best-performing trial. The highest grey correlation degree of 0.9208 corresponds to trial 2, indicating the optimal parameter combination: pouring temperature of 1,610°C, shell roasting temperature of 1,050°C, and pouring time of 6 seconds. This combination significantly reduces defects compared to the original process, underscoring the effectiveness of grey correlation analysis in precision casting optimization.
| Trial | Shrinkage Volume (cm³) | Normalized Shrinkage | Shrinkage Correlation | Deformation (cm) | Normalized Deformation | Deformation Correlation | Grey Correlation Degree | Rank |
|---|---|---|---|---|---|---|---|---|
| 1 | 0.0954 | 0.8071 | 0.3825 | 0.0313 | 0.8912 | 0.3594 | 0.3660 | 8 |
| 2 | 0.0566 | 0.1901 | 0.7245 | 0.0239 | 0.0000 | 1.0000 | 0.9208 | 1 |
| 3 | 0.0446 | 0.0000 | 1.0000 | 0.0304 | 0.7859 | 0.3888 | 0.5644 | 3 |
| 4 | 0.0744 | 0.5211 | 0.4897 | 0.0320 | 0.9750 | 0.3390 | 0.3823 | 6 |
| 5 | 0.0714 | 0.4257 | 0.5401 | 0.0312 | 0.8902 | 0.3597 | 0.4115 | 4 |
| 6 | 0.0918 | 0.7491 | 0.4003 | 0.0313 | 0.8991 | 0.3574 | 0.3697 | 7 |
| 7 | 0.0711 | 0.4203 | 0.5433 | 0.0249 | 0.1231 | 0.3210 | 0.3849 | 5 |
| 8 | 0.1076 | 1.0000 | 0.3333 | 0.0322 | 1.0000 | 0.3333 | 0.3333 | 9 |
| 9 | 0.0561 | 0.1825 | 0.7326 | 0.0247 | 0.0955 | 0.8395 | 0.8088 | 2 |
Further analysis through mean and range calculations of the grey correlation degrees, as shown in Table 6, reveals the significance of each factor. The range values indicate that pouring time (C) has the largest effect (0.3476), followed by pouring temperature (A) at 0.2293, and shell roasting temperature (B) at 0.2033. This hierarchy suggests that in investment casting, controlling the pouring duration is crucial for minimizing defects, while temperature parameters, though important, have a relatively smaller impact. The trend of grey correlation degrees across factor levels, illustrated in subsequent discussions, shows that lower pouring temperatures and intermediate pouring times yield the best results, aligning with the principles of precision casting that emphasize controlled solidification.
| Factor | Level 1 Mean | Level 2 Mean | Level 3 Mean | Range |
|---|---|---|---|---|
| A | 0.6171 | 0.3878 | 0.5090 | 0.2293 |
| B | 0.3777 | 0.5552 | 0.5810 | 0.2033 |
| C | 0.3563 | 0.7039 | 0.4536 | 0.3476 |
Validation of the optimized process was conducted through numerical simulation and practical verification. The improved gating system, combined with the optimal parameters, resulted in a smooth filling process where molten metal entered the mold cavity from the bottom, reducing turbulence and gas entrapment. Solidification occurred sequentially, starting from the thin sections and progressing to the thicker areas, with the additional ingates providing effective feeding to prevent isolated liquid zones. The predicted shrinkage porosity volume under the best conditions was 0.0566 cm³, a 97% reduction from the original process, and deformation decreased by 27% to 0.024 cm. These improvements highlight the success of the optimization in enhancing the quality of the investment casting.
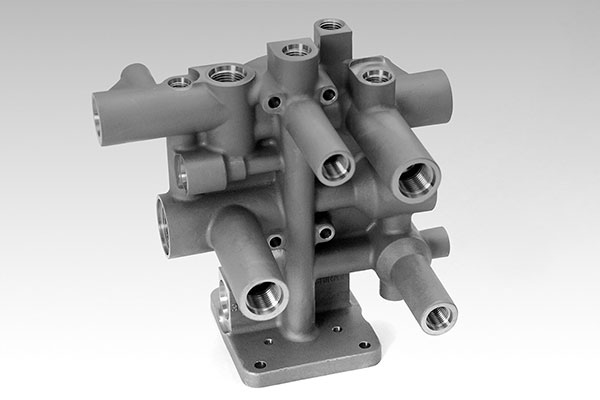
In conclusion, this study demonstrates the efficacy of integrating numerical simulation and grey correlation analysis for optimizing investment casting processes. The identified optimal parameters—pouring temperature of 1,610°C, shell roasting temperature of 1,050°C, and pouring time of 6 seconds—significantly reduce defects in the stainless steel three-way valve body. The analysis confirms that the gating system structure and pouring time are the most influential factors, underscoring the importance of design and control in precision casting. This approach not only improves casting quality but also reduces production costs by minimizing trial-and-error experiments, making it a valuable methodology for advancing investment casting technologies in industrial applications.