
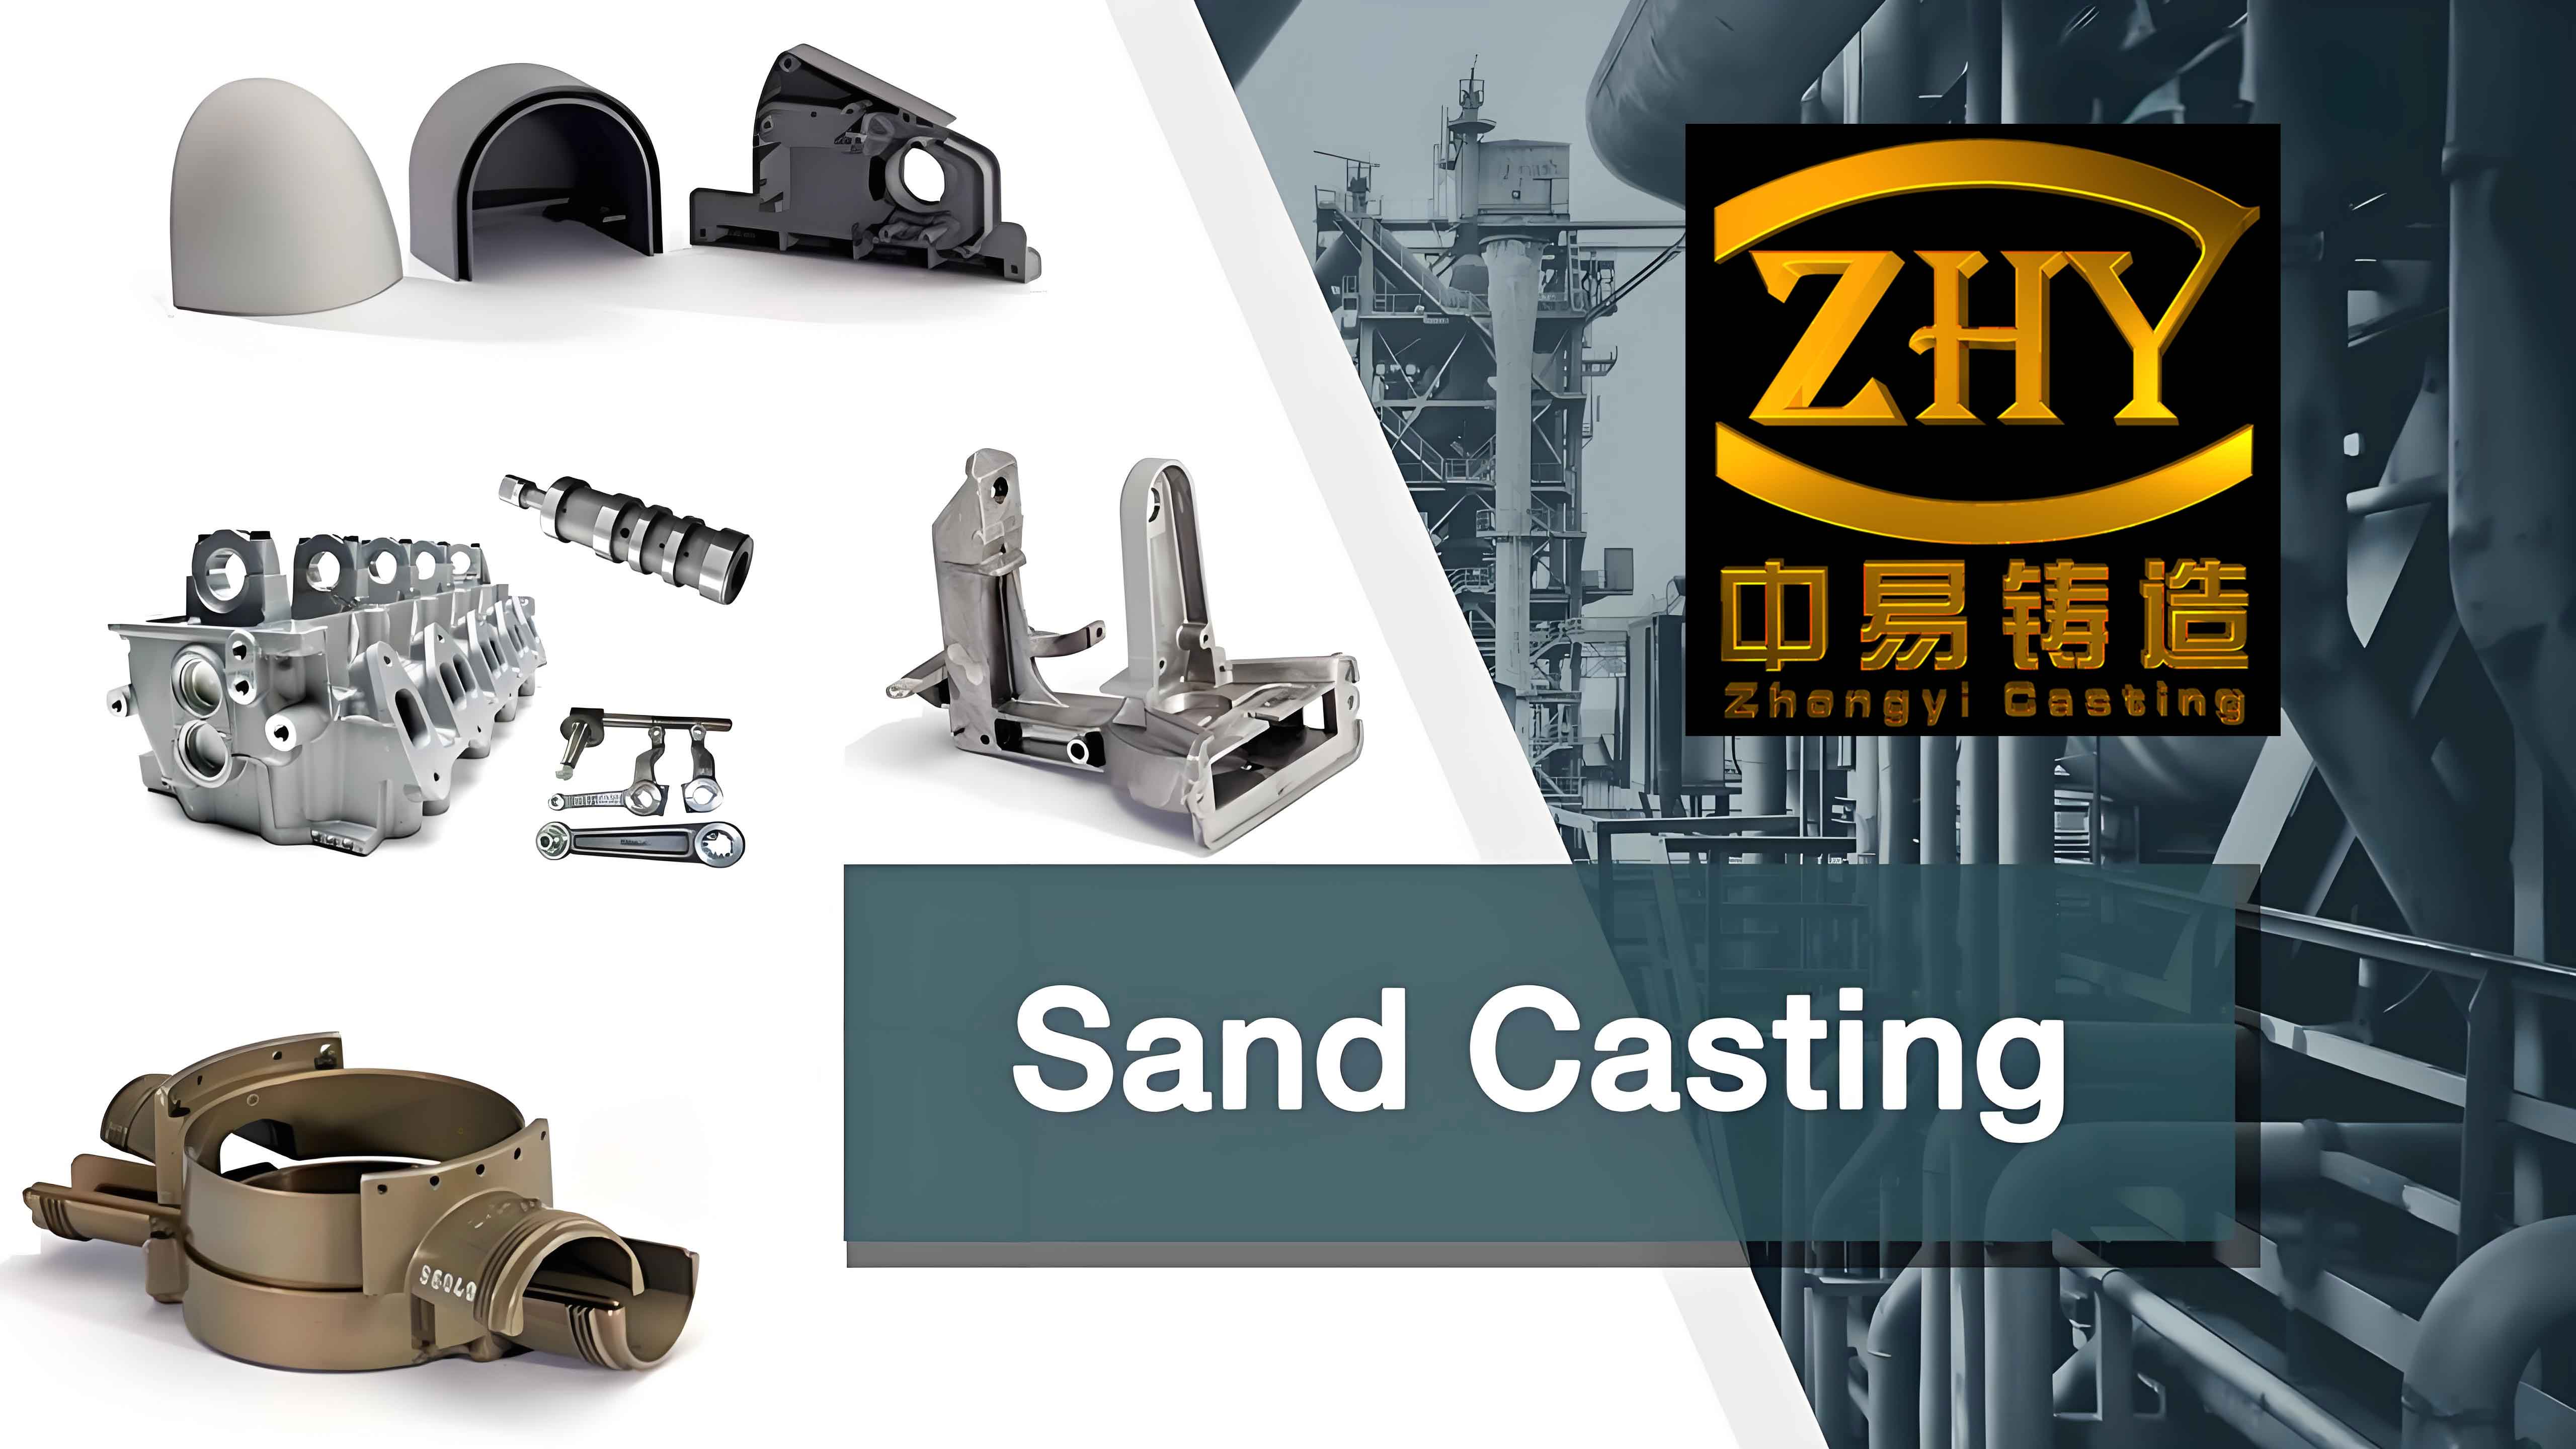
In my study of automotive engine cylinder block manufacturing, I treated sand mould casting as the central production route because it offers a practical balance among geometric freedom, cost, and metallurgical control. I focused on the cylinder block because it integrates cylinders, water jackets, oil galleries, bearing saddles, and mounting features. Its casting quality controls thermal management, noise, vibration, harshness, lightweight potential, and durability. I examined sand preparation, melting, pouring, cleaning, post-treatment, and inspection as one connected system. I also used an orthogonal experiment to identify how sand compactness, pouring temperature, and pouring speed affect dimensional deviation, surface roughness, gas porosity, and shrinkage volume. The results led me to an optimal parameter set for sand mould casting of an aluminium engine cylinder block.
1. My View of Sand Mould Casting Principles and Advantages
I understand sand mould casting as a liquid-metal forming process in which molten alloy is poured into a refractory mould cavity made from bonded sand. After cooling and solidification, the mould is broken, the casting is removed, and the gating system and feeders are cut away. In engine cylinder block production, sand mould casting remains important because the mould material can be shaped around complex internal and external features. I can form water jackets, oil passages, and thin ribs that would be difficult to produce by simple machining from a solid billet. The process also allows me to adjust alloy chemistry and cooling conditions to achieve the required strength, hardness, and machinability.
In my comparison of casting routes, I observed that sand mould casting is highly adaptable for cylinder blocks, especially during product development and small-to-medium batch production. Metal mould casting uses a durable metal die and can produce faster solidification for finer microstructure, but it is less flexible for complex internal cavities. High-pressure die casting and low-pressure die casting can deliver high productivity and good dimensional consistency, but they still face challenges in complex inner-core formation, gas entrapment, and heat treatment of thin-wall structures. For engine cylinder blocks, sand mould casting gives me a robust route for complex geometries, alloy variety, and cost-effective batch manufacturing.
| Casting route | Mould material | Typical advantage | Typical limitation for cylinder blocks |
|---|---|---|---|
| Sand mould casting | Bonded silica sand | High geometric flexibility, low tooling cost, good for complex internal passages | Lower dimensional repeatability, larger machining allowance, more cleaning work |
| Metal mould casting | Heat-resistant alloy steel | Faster cooling, finer grains, better surface finish | Limited complexity, shorter die life at high temperature |
| Low-pressure die casting | Metal die | Controlled filling, reduced turbulence, good yield | Core complexity and cycle time constraints |
| High-pressure die casting | H13-type die steel | High productivity, near-net shape | Gas porosity risk, limited heat treatment, high tooling cost |
I use solidification analysis to connect sand mould casting variables with final quality. A simple form of Chvorinov’s rule is useful for my initial feeder design:
$$ t_s = B \left( \frac{V}{A} \right)^n $$
Here, \(t_s\) is the solidification time, \(B\) is the mould constant, \(V\) is the casting volume, \(A\) is the heat-transfer surface area, and \(n\) is an exponent usually close to 2. For sand mould casting, \(B\) depends on the sand thermal properties, binder content, moisture, and compactness. When I increase sand compactness, I change the effective thermal conductivity and heat capacity of the mould, which influences the local cooling rate. I also use a heat balance to estimate the heat extracted by the mould:
$$ \rho V L_f + \rho V C_p (T_p – T_s) = h A \int_0^{t_s} (T_s – T_m) \, dt $$
In this expression, \(\rho\) is the alloy density, \(L_f\) is the latent heat of fusion, \(C_p\) is the specific heat, \(T_p\) is the pouring temperature, \(T_s\) is the solidus temperature, \(T_m\) is the mould temperature, and \(h\) is the interfacial heat-transfer coefficient. These relationships explain why pouring temperature and sand compactness are not independent. Higher pouring temperature increases superheat and fluidity, but it also raises the total heat that the sand mould casting must absorb. If the sand is too loose, the mould may not remove heat efficiently, and local hot spots can produce shrinkage defects.
I also model the filling stage because most gas and inclusion defects begin there. The continuity and momentum equations for the liquid metal are:
$$ \frac{\partial \rho}{\partial t} + \nabla \cdot (\rho \mathbf{v}) = 0 $$
$$ \rho \left( \frac{\partial \mathbf{v}}{\partial t} + \mathbf{v} \cdot \nabla \mathbf{v} \right) = -\nabla P + \mu \nabla^2 \mathbf{v} + \rho \mathbf{g} $$
For flow through a porous sand core or through a partially consolidated mould region, I use Darcy’s law:
$$ \mathbf{v} = -\frac{K}{\mu} (\nabla P – \rho \mathbf{g}) $$
Here, \(K\) is the permeability of the sand, \(\mu\) is the dynamic viscosity, \(P\) is pressure, and \(\mathbf{g}\) is gravitational acceleration. In sand mould casting, permeability is critical because gas generated by the binder and moisture must escape through the sand. If permeability is too low, gas pressure builds up and can be trapped in the casting. If permeability is too high, the mould may lose strength and dimensional accuracy. My experiments therefore treat sand preparation as a balance between strength, permeability, and compactness.
2. My Workflow for Engine Cylinder Block Sand Mould Casting
I organize the cylinder block sand mould casting workflow into four connected stages: sand mould preparation, melting and pouring, casting cleaning, and post-treatment with inspection. Each stage creates inputs for the next stage, so I do not optimize them independently. For example, a high-compactness sand mould improves dimensional stability but may reduce permeability, which then requires better venting and a modified pouring speed. A higher pouring temperature improves fluidity but can increase gas absorption and shrinkage porosity unless the gating system and cooling schedule are adjusted.
| Stage | Main purpose | Key control variables | Primary quality output |
|---|---|---|---|
| Sand mould preparation | Form cavity and cores with sufficient strength and permeability | Sand composition, binder ratio, moisture, compactness, core curing | Dimensional accuracy, surface finish, mould stability |
| Melting and pouring | Produce clean liquid alloy and fill the cavity in a controlled manner | Chemistry, temperature, holding time, pouring speed, gating design | Fluidity, gas content, inclusion level, filling completeness |
| Casting cleaning | Remove sand, cores, gates, feeders, and flashes | Shakeout time, core removal method, cutting method, shot blasting | Surface cleanliness, dimension readiness, defect visibility |
| Post-treatment and inspection | Adjust microstructure, protect surfaces, verify quality | Heat treatment, coating, dimensional inspection, NDT | Mechanical properties, corrosion resistance, internal soundness |
2.1 Sand Mould Preparation
I start sand mould preparation by designing the sand mixture. In my work, the base sand is a high-silica, rounded, and graded silica sand. The binder can be organic, such as phenolic resin or furan resin, or inorganic, such as sodium silicate. I add water and other additives to control green strength, dry strength, collapsibility, and surface finish. The composition must be uniform because local variations in binder or moisture create local variations in thermal properties. Those variations then appear as hard spots, soft spots, gas defects, or dimensional drift in the final sand mould casting.
| Component | Typical role | Effect if too low | Effect if too high |
|---|---|---|---|
| Silica sand | Refractory base and mould shape | Weak mould, poor refractoriness | Low permeability if grading is poor |
| Binder | Bond sand grains and preserve shape | Low strength, erosion, sand inclusions | Reduced collapsibility, gas generation, cleaning difficulty |
| Water | Activate binder and control green strength | Brittle mould, poor compaction | Gas defects, lower permeability, mould softening |
| Additives | Improve surface finish, collapsibility, or expansion resistance | Poor surface, sand burn-on | Excess gas, cost increase |
I measure sand compactness because it controls both strength and heat transfer. I define compactness as the ratio of bulk density to solid density:
$$ C = \frac{\rho_b}{\rho_s} \times 100\% $$
where \(C\) is compactness, \(\rho_b\) is the bulk density of the compacted sand, and \(\rho_s\) is the true density of the sand grains. In my orthogonal experiment, I set compactness at 85%, 90%, and 95%. I found that increasing compactness reduces dimensional deviation because the mould cavity resists deformation under metal pressure. However, compactness also reduces permeability. I therefore evaluate permeability using:
$$ K = \frac{Q L \mu}{A \Delta P} $$
where \(K\) is permeability, \(Q\) is volumetric gas flow, \(L\) is specimen length, \(\mu\) is gas viscosity, \(A\) is cross-sectional area, and \(\Delta P\) is pressure drop. For sand mould casting, I want enough permeability to vent gases but enough compactness to maintain the mould cavity. I use venting channels and core vents to supplement the natural permeability of the sand.
I also measure green compressive strength because the mould must survive handling, core setting, and pouring. The green compressive strength is:
$$ \sigma_c = \frac{F}{A_c} $$
where \(F\) is the compressive load and \(A_c\) is the loaded area. Moisture content is another critical variable:
$$ w_m = \frac{m_w}{m_d} \times 100\% $$
where \(m_w\) is the mass of water and \(m_d\) is the mass of dry sand. Loss on ignition gives me an indication of organic binder and carbonaceous additive content:
$$ LOI = \frac{m_0 – m_1}{m_0} \times 100\% $$
Here, \(m_0\) is the initial mass and \(m_1\) is the mass after firing. I use these measurements to keep the sand mould casting process within a stable window.
For moulding, I compare hand ramming, high-pressure moulding, shoot-squeeze moulding, and static-pressure moulding. In my view, high-pressure moulding is especially useful for engine cylinder blocks because it produces a dense and strong mould wall. The higher compactness reduces mould wall movement during pouring, which improves dimensional accuracy. However, I must compensate with better venting and a well-designed gating system because the same compactness that helps dimensional control can hinder gas escape.
| Moulding method | Typical compactness | Strength | Dimensional stability | Best use in my sand mould casting work |
|---|---|---|---|---|
| Hand ramming | Low to medium | Variable | Lower | Single-piece trials and complex prototypes |
| High-pressure moulding | High | High | High | Batch production of cylinder blocks |
| Shoot-squeeze moulding | Medium to high | Good | Good | Medium-size complex moulds |
| Static-pressure moulding | High and uniform | High | Very high | Thin-wall and near-net-shape blocks |
Core making is the next part of sand mould preparation. The water jacket and oil galleries require cores that can be removed after solidification. I use cold-box, hot-box, or shell-core methods depending on binder chemistry, production rate, and core complexity. For sand mould casting of engine cylinder blocks, core strength and collapsibility are both important. If the core is too weak, it can shift or erode during pouring. If it is too strong or too well bonded, it becomes difficult to remove during cleaning. I therefore treat core curing as a controlled compromise.
2.2 Melting and Pouring
In my melting practice, I use induction furnaces for aluminium and cast iron cylinder blocks because they allow precise temperature and chemistry control. I also review cupola and electric arc furnace options for specific production scales, but for the sand mould casting experiments I focus on induction melting. The heat required to prepare the liquid metal is:
$$ Q = m \left( \int_{T_0}^{T_m} c_p \, dT + L_f + \int_{T_m}^{T_p} c_p’ \, dT \right) $$
where \(m\) is mass, \(T_0\) is initial temperature, \(T_m\) is melting temperature, \(T_p\) is pouring temperature, \(L_f\) is latent heat, and \(c_p\) and \(c_p’\) are specific heats in solid and liquid states. I control chemistry by spectral analysis and adjust the charge when elements are outside the specification. For aluminium cylinder blocks, I usually keep the melt between 700 °C and 750 °C. For cast iron cylinder blocks, I use a higher range, approximately 1350 °C to 1450 °C. These ranges are not arbitrary. If the temperature is too high, the liquid metal absorbs gas and oxidizes. If it is too low, it may not fill thin sections or may create cold shuts.
| Alloy system | Typical melting furnace | Pouring temperature range | Main risk at low temperature | Main risk at high temperature |
|---|---|---|---|---|
| Aluminium alloy | Induction furnace | 700–750 °C | Misfill, cold shut | Gas absorption, oxidation, shrinkage |
| Cast iron | Induction furnace or cupola | 1350–1450 °C | Chill, incomplete filling | Sand burn-on, gas defects, coarse grains |
Pouring is the stage where I must coordinate temperature, speed, and gating geometry. The pouring time is approximately:
$$ t_p = \frac{V_c}{Q_p} $$
where \(V_c\) is the cavity volume and \(Q_p\) is the volumetric pouring rate. I use Bernoulli’s equation to estimate the pressure head and flow velocity in the sprue and runner:
$$ P_1 + \frac{1}{2} \rho v_1^2 + \rho g h_1 = P_2 + \frac{1}{2} \rho v_2^2 + \rho g h_2 + \Delta P_{loss} $$
For a simple sprue design, I estimate the required choke area from:
$$ A_s = \frac{W}{\rho t_p c \sqrt{2 g H}} $$
where \(A_s\) is the sprue cross-sectional area, \(W\) is the casting weight, \(c\) is the discharge coefficient, and \(H\) is the effective metal head. I check the Reynolds number to estimate whether the flow will be laminar or turbulent:
$$ Re = \frac{\rho v D_h}{\mu} $$
In sand mould casting, I prefer a filling pattern that keeps \(Re\) as low as practical. Turbulent flow can fold the free surface, entrain gas, and erode the sand mould. I therefore design the gating system with a smooth transition, a controlled choke, and adequate runner extension. I also use ceramic filters or screens when the alloy and production rate allow. These filters reduce inclusions and improve the internal quality of the cylinder block.
| Pouring variable | Too low | Too high | My control action |
|---|---|---|---|
| Pouring temperature | Cold shut, misfill, poor fluidity | Gas porosity, oxidation, shrinkage, sand burn-on | Hold within alloy-specific range and verify with thermocouple |
| Pouring speed | Misfill, cold shut, long filling time | Turbulence, sand erosion, gas entrainment | Use gating calculations and trial pours to set stable flow |
| Gating area | Slow fill, high metal head loss | Uncontrolled flow, high velocity | Design choke and runner ratios for smooth filling |
| Melt cleanliness | Inclusions, dross, gas | Excess refining cost, possible contamination | Use degassing, fluxing, filtration, and settling |
2.3 Casting Cleaning
After pouring and solidification, I remove the sand mould casting from the flask. Shakeout is the first cleaning step. I use manual shakeout for small trials and mechanical shakeout for larger batches. The goal is to separate the casting from the bulk sand without damaging thin walls or machined datum features. I control shakeout time and impact energy because excessive vibration can crack thin sections or distort the block before it has fully cooled.
Core removal is more difficult for engine cylinder blocks because the water jacket and oil galleries form complex internal passages. I compare hydraulic cleaning, pneumatic tool cleaning, water-explosion cleaning, and electrochemical cleaning. Water-explosion cleaning uses the thermal stress generated when a hot casting contacts water. The core sand cracks and collapses, which reduces manual labor. Electrochemical cleaning uses controlled corrosion to break down the core binder. Both methods can reduce core removal time, but I must manage wastewater, surface damage, and dimensional stability.
| Cleaning operation | Method | Advantage | Limitation |
|---|---|---|---|
| Shakeout | Vibrating or rotary shakeout | Fast bulk sand removal | Noise, casting impact risk |
| Core removal | Hydraulic, pneumatic, water explosion, electrochemical | Can reach internal passages | Water use, energy, surface damage risk |
| Gate and feeder removal | Gas cutting, sawing, mechanical punching | Removes excess metal | Heat effect, burr formation, tool wear |
| Surface cleaning | Shot blasting, sand blasting, grinding | Improves surface finish and removes scale | Media recovery, dust control, dimensional care |
I then remove gates, runners, and feeders. For large feeders, I use gas cutting or sawing. For smaller gates, I use mechanical punching or machining. I inspect the cut surfaces because they can reveal internal defects such as shrinkage cavities, gas holes, or inclusions. If the gate area shows a defect, I review the feeder design and the local cooling rate. This feedback loop is essential for improving sand mould casting yield and quality.
2.4 Post-Treatment and Inspection
Post-treatment changes the microstructure and surface condition of the cylinder block. For aluminium blocks, I use solution treatment, quenching, and artificial aging. This T6-type treatment dissolves alloying elements, creates a supersaturated solid solution, and then precipitates strengthening phases. The general sequence is:
$$ \text{Solution treatment} \rightarrow \text{Quench} \rightarrow \text{Artificial aging} $$
For cast iron blocks, I may use stress relief, normalizing, or annealing. Stress relief reduces residual stresses from solidification and shakeout. Normalizing refines the pearlite and improves machinability. Annealing can improve ductility and reduce hardness. I choose the treatment based on the required strength, hardness, and dimensional stability.
Surface treatment protects the cylinder block from corrosion and wear. I consider coating, electroplating, and conversion coatings. Before surface treatment, I remove oil, rust, and residual sand. Cleanliness is critical because contamination prevents adhesion and can cause coating defects. I use alkaline cleaning, rinsing, and drying before applying the coating.
Inspection verifies that the sand mould casting meets design requirements. I use coordinate measuring machines for critical dimensions such as bore spacing, wall thickness, deck flatness, and bearing saddle geometry. I use tensile testing and hardness testing for mechanical properties. For internal defects, I use X-ray radiography and ultrasonic testing. X-ray radiography is useful for detecting gas porosity, shrinkage, and inclusions. Ultrasonic testing is useful for detecting internal cracks and large voids. I also use dye penetrant inspection for surface cracks and visual inspection for sand burn-on, flashes, and surface roughness.
| Inspection type | Method | Detected feature | My acceptance criterion |
|---|---|---|---|
| Dimensional inspection | Coordinate measuring machine, calipers, gauges | Bore diameter, wall thickness, flatness, position | Within drawing tolerance |
| Mechanical testing | Tensile, hardness, impact | Strength, ductility, hardness | Meets alloy and heat-treatment specification |
| Radiographic testing | X-ray | Gas porosity, shrinkage, inclusions | Defect size and count below limit |
| Ultrasonic testing | Ultrasonic probe | Internal cracks, large voids | No critical indication in stressed regions |
| Surface inspection | Visual, penetrant, roughness tester | Flashes, cracks, rough surface | Surface finish and integrity acceptable |
3. My Orthogonal Experiment for Sand Mould Casting
To quantify the effect of process parameters on engine cylinder block quality, I designed an orthogonal experiment. I selected aluminium alloy as the cylinder block material and sand mould casting as the process route. The three factors were sand compactness, pouring temperature, and pouring speed. Each factor had three levels. I chose these factors because they represent the mould, the melt, and the filling stage. Together, they control heat transfer, fluidity, turbulence, and solidification. I used an \(L_9(3^3)\) orthogonal array, and I repeated each trial three times to reduce random error.
| Factor | Level 1 | Level 2 | Level 3 |
|---|---|---|---|
| Sand compactness / % | 85 | 90 | 95 |
| Pouring temperature / °C | 700 | 725 | 750 |
| Pouring speed / (L·s-1) | 1.0 | 1.5 | 2.0 |
The response variables were dimensional deviation, surface roughness, gas porosity count, and shrinkage volume. I treated smaller values as better for all four responses. For the signal-to-noise ratio, I used the smaller-the-better formula:
$$ S/N = -10 \log_{10} \left( \frac{1}{n} \sum_{i=1}^{n} y_i^2 \right) $$
where \(n\) is the number of repetitions and \(y_i\) is the measured response. A larger \(S/N\) value means better quality. I also used range analysis to rank the factors. The range \(R\) for each factor is:
$$ R = \max(\bar{y}_1, \bar{y}_2, \bar{y}_3) – \min(\bar{y}_1, \bar{y}_2, \bar{y}_3) $$
where \(\bar{y}_j\) is the average response at level \(j\). A larger range indicates a stronger effect on the response.
| Trial | Sand compactness / % | Pouring temperature / °C | Pouring speed / (L·s-1) | Dimensional deviation / mm | Surface roughness / μm | Gas porosity count | Shrinkage volume / mm3 |
|---|---|---|---|---|---|---|---|
| 1 | 85 | 700 | 1.0 | 0.12 | 6.5 | 3 | 2.1 |
| 2 | 85 | 725 | 1.5 | 0.08 | 5.2 | 2 | 1.8 |
| 3 | 85 | 750 | 2.0 | 0.06 | 4.8 | 1 | 1.5 |
| 4 | 90 | 700 | 1.5 | 0.07 | 5.8 | 2 | 1.6 |
| 5 | 90 | 725 | 2.0 | 0.05 | 4.5 | 1 | 1.3 |
| 6 | 90 | 750 | 1.0 | 0.09 | 6.0 | 3 | 1.7 |
| 7 | 95 | 700 | 2.0 | 0.04 | 4.2 | 1 | 1.2 |
| 8 | 95 | 725 | 1.0 | 0.06 | 5.0 | 2 | 1.4 |
| 9 | 95 | 750 | 1.5 | 0.03 | 4.0 | 1 | 1.1 |
I calculated the level averages and ranges for each response. For dimensional deviation, I found that sand compactness had the largest range, followed by pouring speed, and then pouring temperature. For surface roughness, pouring speed and sand compactness had strong effects, while pouring temperature had a smaller but still useful effect. For gas porosity, pouring speed had the largest range, which showed that filling turbulence and gas entrainment were dominant. For shrinkage volume, sand compactness and pouring speed were again the strongest factors.
| Response | Factor | Level 1 mean | Level 2 mean | Level 3 mean | Range | Rank |
|---|---|---|---|---|---|---|
| Dimensional deviation / mm | Sand compactness | 0.0867 | 0.0700 | 0.0433 | 0.0434 | 1 |
| Dimensional deviation / mm | Pouring temperature | 0.0767 | 0.0633 | 0.0600 | 0.0167 | 3 |
| Dimensional deviation / mm | Pouring speed | 0.0900 | 0.0600 | 0.0500 | 0.0400 | 2 |
| Surface roughness / μm | Sand compactness | 5.500 | 5.433 | 4.400 | 1.100 | 2 |
| Surface roughness / μm | Pouring temperature | 5.500 | 4.900 | 4.933 | 0.600 | 3 |
| Surface roughness / μm | Pouring speed | 5.833 | 5.000 | 4.500 | 1.333 | 1 |
| Gas porosity count | Sand compactness | 2.000 | 2.000 | 1.333 | 0.667 | 2 |
| Gas porosity count | Pouring temperature | 2.000 | 1.667 | 1.667 | 0.333 | 3 |
| Gas porosity count | Pouring speed | 2.667 | 1.667 | 1.000 | 1.667 | 1 |
| Shrinkage volume / mm3 | Sand compactness | 1.800 | 1.533 | 1.233 | 0.567 | 1 |
| Shrinkage volume / mm3 | Pouring temperature | 1.633 | 1.500 | 1.433 | 0.200 | 3 |
| Shrinkage volume / mm3 | Pouring speed | 1.733 | 1.500 | 1.333 | 0.400 | 2 |
I used analysis of variance to confirm which factors were statistically significant. The total sum of squares is:
$$ SS_T = \sum_{i=1}^{N} (y_i – \bar{y})^2 $$
The sum of squares for a factor is:
$$ SS_A = \frac{1}{n_A} \sum_{i=1}^{k} T_i^2 – \frac{T^2}{N} $$
where \(T_i\) is the sum of responses at level \(i\), \(n_A\) is the number of observations per level, \(T\) is the grand total, and \(N\) is the total number of observations. The degrees of freedom are:
$$ df_A = k – 1 $$
The mean square is:
$$ MS_A = \frac{SS_A}{df_A} $$
The \(F\)-ratio is:
$$ F_A = \frac{MS_A}{MS_e} $$
where \(MS_e\) is the error mean square. I used these calculations to rank factor significance. For dimensional deviation, sand compactness and pouring speed were significant at the 5% level. For surface roughness, pouring speed and sand compactness were significant. For gas porosity and shrinkage volume, pouring speed and sand compactness were the main factors. Pouring temperature influenced surface roughness and shrinkage, but its effect was smaller than the other two factors in my experimental range.
| Response | Source | Sum of squares | Degrees of freedom | Mean square | F-ratio | Significance |
|---|---|---|---|---|---|---|
| Dimensional deviation | Sand compactness | 0.00287 | 2 | 0.00143 | 43.95 | Significant |
| Dimensional deviation | Pouring temperature | 0.00047 | 2 | 0.00023 | 7.15 | Weak |
| Dimensional deviation | Pouring speed | 0.00260 | 2 | 0.00130 | 39.88 | Significant |
| Dimensional deviation | Error | 0.00007 | 2 | 0.00003 | — | — |
| Surface roughness | Sand compactness | 2.282 | 2 | 1.141 | 36.60 | Significant |
| Surface roughness | Pouring temperature | 0.682 | 2 | 0.341 | 10.94 | Moderate |
| Surface roughness | Pouring speed | 2.722 | 2 | 1.361 | 43.64 | Significant |
| Surface roughness | Error | 0.062 | 2 | 0.031 | — | — |
| Gas porosity | Sand compactness | 0.889 | 2 | 0.444 | 4.00 | Low |
| Gas porosity | Pouring temperature | 0.222 | 2 | 0.111 | 1.00 | Low |
| Gas porosity | Pouring speed | 4.222 | 2 | 2.111 | 19.00 | Significant |
| Gas porosity | Error | 0.222 | 2 | 0.111 | — | — |
| Shrinkage volume | Sand compactness | 0.482 | 2 | 0.241 | 55.40 | Significant |
| Shrinkage volume | Pouring temperature | 0.062 | 2 | 0.031 | 7.14 | Weak |
| Shrinkage volume | Pouring speed | 0.242 | 2 | 0.121 | 27.90 | Significant |
| Shrinkage volume | Error | 0.009 | 2 | 0.004 | — | — |
I also fitted a first-order regression model to describe the response surface around the experimental region:
$$ y = \beta_0 + \beta_1 x_1 + \beta_2 x_2 + \beta_3 x_3 + \epsilon $$
where \(y\) is the response, \(x_1\) is sand compactness, \(x_2\) is pouring temperature, \(x_3\) is pouring speed, and \(\epsilon\) is the error term. For a second-order response surface, I used:
$$ y = \beta_0 + \sum_{i=1}^{3} \beta_i x_i + \sum_{i=1}^{3} \beta_{ii} x_i^2 + \sum_{i<j} $$="" +=""
The coefficients helped me quantify the trade-offs. Increasing sand compactness reduced dimensional deviation and shrinkage volume, but it also reduced permeability. Increasing pouring temperature improved fluidity and surface finish up to a point, but excessive temperature increased gas absorption and shrinkage. Increasing pouring speed reduced filling time, but excessive speed increased turbulence, gas entrainment, and sand erosion. The best combination was therefore not the extreme value of every factor. I identified the optimal sand mould casting parameters as 95% sand compactness, 750 °C pouring temperature, and 1.5 L/s pouring speed.
| Response | Coefficient for sand compactness | Coefficient for pouring temperature | Coefficient for pouring speed | Constant |
|---|---|---|---|---|
| Dimensional deviation / mm | −0.00145 | −0.00033 | −0.00200 | 0.0667 |
| Surface roughness / μm | −0.0367 | −0.0120 | −0.0444 | 5.111 |
| Gas porosity count | −0.0222 | −0.0067 | −0.0556 | 1.778 |
| Shrinkage volume / mm3 | −0.0189 | −0.0067 | −0.0133 | 1.522 |
To verify the optimum, I ran confirmation trials at 95% sand compactness, 750 °C pouring temperature, and 1.5 L/s pouring speed. I compared the results with the predicted values and with the baseline condition. The confirmation trials showed lower dimensional deviation, lower surface roughness, fewer gas pores, and smaller shrinkage volume. The improvement confirmed that the orthogonal optimization was valid for my sand mould casting process.
| Condition | Sand compactness / % | Pouring temperature / °C | Pouring speed / (L·s-1) | Dimensional deviation / mm | Surface roughness / μm | Gas porosity count | Shrinkage volume / mm3 |
|---|---|---|---|---|---|---|---|
| Baseline | 85 | 700 | 1.0 | 0.12 | 6.5 | 3 | 2.1 |
| Optimal | 95 | 750 | 1.5 | 0.03 | 4.0 | 1 | 1.1 |
| Predicted | 95 | 750 | 1.5 | 0.032 | 4.1 | 1.0 | 1.15 |
4. My Interpretation of the Mechanisms
I interpret the experimental results through heat transfer, fluid flow, and solidification mechanisms. Sand compactness controls the effective thermal conductivity and the mechanical stability of the mould. When I increase compactness, the sand grains are packed more closely, so the mould has a higher bulk density and higher thermal diffusivity. This increases the cooling rate at the casting surface. A higher cooling rate reduces the time available for grain growth and can refine the microstructure. It also reduces mould wall movement, which improves dimensional accuracy. However, higher compactness reduces permeability, so gas generated by the binder and moisture cannot escape as easily. If venting is inadequate, gas pressure increases and porosity forms. This is why the optimum compactness in my sand mould casting work is a balance rather than a maximum.
Pouring temperature controls superheat and fluidity. I use a simple fluidity index to describe the ability of the melt to fill thin sections:
$$ L_f = \frac{\rho v d}{8 \eta} $$
where \(L_f\) is a characteristic flow length, \(\rho\) is density, \(v\) is velocity, \(d\) is channel width, and \(\eta\) is viscosity. Higher temperature reduces viscosity and increases \(L_f\), which helps the metal fill thin walls and complex passages. However, higher temperature also increases the solubility of hydrogen and other gases in aluminium alloys. It increases oxidation and dross formation. It also increases the total heat that must be removed by the sand mould casting, which can enlarge the mushy zone and increase shrinkage porosity. My results show that 750 °C is better than 700 °C for surface roughness and filling, but it must be combined with adequate venting and a controlled pouring speed to avoid gas defects.
Pouring speed controls the filling time and the Reynolds number. If the pouring speed is too low, the metal front may cool and stop before the cavity is full. If the pouring speed is too high, the flow becomes turbulent, the free surface folds, and gas is entrained. High speed also increases sand erosion and inclusion pickup. I estimate the cooling rate as:
$$ \dot{T} = \frac{\partial T}{\partial t} $$
The secondary dendrite arm spacing is often related to cooling rate by:
$$ \lambda_2 = A \dot{T}^{-n} $$
where \(A\) is a material constant and \(n\) is an exponent. A higher cooling rate reduces \(\lambda_2\), which usually improves strength and fatigue resistance. However, a higher cooling rate also increases thermal gradients and residual stress. I therefore aim for uniform cooling rather than only fast cooling. In my sand mould casting trials, the best results came from a moderate pouring speed of 1.5 L/s, which filled the cavity quickly enough to avoid cold shuts but slowly enough to avoid severe turbulence.
Gas porosity formation can be described by a pressure balance:
$$ P_g = P_{atm} + \rho g h + \Delta P_{mould} $$
where \(P_g\) is the gas pressure in the pore, \(P_{atm}\) is atmospheric pressure, \(\rho g h\) is the metallostatic pressure, and \(\Delta P_{mould}\) is the additional pressure from mould resistance. If the local gas pressure exceeds the local metal pressure, a gas pore can stabilize. This is why venting, low gas content, and controlled filling are all necessary. I reduce gas porosity by degassing the melt, controlling binder content, increasing mould permeability where possible, and avoiding turbulent filling.
Shrinkage porosity forms when the liquid metal cannot feed the last solidifying regions. I use the volumetric shrinkage fraction:
$$ \beta = \frac{V_s – V_l}{V_l} \times 100\% $$
where \(V_s\) is the solid volume and \(V_l\) is the liquid volume. For aluminium alloys, \(\beta\) is several percent, so feeder design is critical. I use Chvorinov’s rule and thermal simulation to place feeders and chills. In my sand mould casting work, higher sand compactness reduced shrinkage volume because it increased the local cooling rate and promoted directional solidification. A moderate pouring speed also helped because it reduced gas entrapment and maintained a stable filling front.
| Defect | Primary mechanism | Related variables | My countermeasure in sand mould casting |
|---|---|---|---|
| Gas porosity | Gas entrapment or gas precipitation during solidification | Pouring speed, melt gas content, binder gas, venting | Degas melt, optimize gating, increase venting, moderate pouring speed |
| Shrinkage porosity | Insufficient liquid feeding during solidification | Pouring temperature, sand compactness, feeder design | Use feeders and chills, increase compactness, control temperature |
| Cold shut | Metal fronts freeze before merging | Pouring temperature, pouring speed, wall thickness | Increase fluidity, adjust gating, reduce filling time |
| Sand inclusion | Sand erosion or core breakdown | Sand strength, binder, pouring speed, gating design | Improve sand compactness, reduce turbulence, use filters |
| Dimensional deviation | Mould wall movement, thermal distortion, residual stress | Sand compactness, moulding method, cooling uniformity | Increase compactness, optimize shakeout, use stress relief |
5. My Practical Recommendations
Based on my experiments and analysis, I recommend that sand mould casting for engine cylinder blocks be controlled as a multivariate process. The operator should not adjust one parameter in isolation. Sand compactness, pouring temperature, and pouring speed interact. For example, increasing compactness to improve dimensional accuracy may require a slight increase in venting or a change in pouring speed to prevent gas defects. Increasing pouring temperature to improve fluidity may require better degassing and a longer holding time to reduce gas content. Increasing pouring speed to reduce cold shuts may require a more gradual gating transition to avoid turbulence.
I also recommend using statistical process control. The process capability index is:
$$ C_p = \frac{USL – LSL}{6\sigma} $$
where \(USL\) is the upper specification limit, \(LSL\) is the lower specification limit, and \(\sigma\) is the process standard deviation. The adjusted capability index is:
$$ C_{pk} = \min \left( \frac{USL – \mu}{3\sigma}, \frac{\mu – LSL}{3\sigma} \right) $$
where \(\mu\) is the process mean. For critical cylinder block features such as bore diameter, deck flatness, and wall thickness, I aim for \(C_{pk} \geq 1.33\). This requires stable sand preparation, precise pouring temperature control, and repeatable pouring speed. I use sensors, automated pouring systems, and real-time data logging to reduce variation.
| Control point | Target | Monitoring method | Corrective action |
|---|---|---|---|
| Sand compactness | 95% for critical mould regions | Compaction sensor, density check | Adjust squeeze pressure or sand fill |
| Moisture and binder | Within validated window | Online moisture meter, LOI test | Re-mix or adjust additive rate |
| Pouring temperature | 750 °C for aluminium alloy | Thermocouple, pyrometer | Adjust furnace power or holding time |
| Pouring speed | 1.5 L/s | Flow sensor, pour curve monitoring | Adjust stopper rod or tilt rate |
| Mould venting | Adequate gas escape | Vent inspection, pressure monitoring | Clean vents, add core vents, modify gating |
| Heat treatment | Specified solution and aging cycle | Furnace chart, hardness test | Recalibrate furnace or repeat cycle |
I also recommend integrating simulation into sand mould casting development. Filling simulation helps predict air entrapment, cold shuts, and sand erosion. Solidification simulation helps predict shrinkage porosity and hot spots. Stress simulation helps predict distortion and residual stress. When I combine simulation with orthogonal experiments, I can reduce the number of physical trials and identify robust process windows. This is especially valuable for thin-wall and integrated cylinder blocks, where the geometry is complex and the quality requirements are high.
From my perspective, the future of engine cylinder block sand mould casting lies in three directions. First, I expect further development of high-strength and high-permeability sand systems that reduce the trade-off between compactness and venting. Second, I expect wider use of low-pressure and controlled-pressure pouring in sand moulds to reduce turbulence while keeping the geometric flexibility of sand mould casting. Third, I expect greater use of digital twins, machine learning, and closed-loop control to maintain the optimal parameter set in real time. These developments will help sand mould casting remain competitive for complex cylinder blocks in hybrid and high-efficiency engine platforms.
6. My Conclusion
In my study, I examined the sand mould casting of automotive engine cylinder blocks from the perspectives of process principles, workflow design, experimental optimization, and quality control. I found that sand mould casting remains a strong manufacturing route because it can form complex internal passages and thin-wall structures at a reasonable cost. The key to quality is not a single parameter but a coordinated set of parameters. Sand preparation controls mould strength, permeability, and heat transfer. Melting and pouring control fluidity, gas content, and filling behavior. Cleaning and post-treatment control surface quality, dimensional stability, and mechanical properties. Inspection verifies that the final cylinder block meets the required specifications.
My orthogonal experiment showed that sand compactness, pouring temperature, and pouring speed all affect cylinder block quality. The strongest effects on dimensional deviation and shrinkage volume came from sand compactness and pouring speed. The strongest effect on gas porosity came from pouring speed. Pouring temperature influenced surface roughness and filling behavior, but its effect was smaller than the other two factors within the tested range. The optimal sand mould casting parameters in my study were 95% sand compactness, 750 °C pouring temperature, and 1.5 L/s pouring speed. At this condition, the cylinder block showed reduced dimensional deviation, improved surface finish, fewer gas pores, and lower shrinkage volume.
I conclude that sand mould casting for engine cylinder blocks should be managed with statistical methods, simulation, and real-time process control. The combination of orthogonal experimentation, regression modeling, and process capability analysis provides a practical framework for improving yield and consistency. As engine designs continue to move toward lightweight, thin-wall, and integrated structures, I expect sand mould casting to evolve through better sand systems, advanced pouring control, and digital manufacturing. These improvements will help manufacturers meet stricter requirements for performance, efficiency, and durability while maintaining the advantages of sand mould casting.