
The production of high-integrity, geometrically complex steel components represents a significant challenge in modern manufacturing. Among various casting techniques, lost wax investment casting stands out for its exceptional capability to produce net-shape parts with superior surface finish, dimensional accuracy, and the ability to replicate intricate details. This process is indispensable for critical applications in aerospace, power generation, and medical industries. However, achieving defect-free castings, especially with alloys prone to oxidation and with complex thin-walled sections, requires meticulous process design. Traditional trial-and-error methods are costly and time-consuming. This article explores, from a first-person research perspective, the application of advanced numerical simulation as a robust tool for optimizing the lost wax investment casting process for steel components, fundamentally transforming how we design and validate casting protocols.
At its core, lost wax investment casting involves creating a wax pattern, building a ceramic shell around it, melting out the wax, and pouring molten metal into the resulting cavity. The final quality is highly sensitive to process parameters such as pouring temperature, pouring velocity, shell preheat temperature, and gating system design. Inappropriate settings can lead to defects like mistruns, shrinkage porosity, inclusions, and particularly entrapped gas or oxide films (often termed “air entrapment” or “oxide bi-films”). These defects are often localized in the last regions to fill and can severely compromise the mechanical performance of the casting.
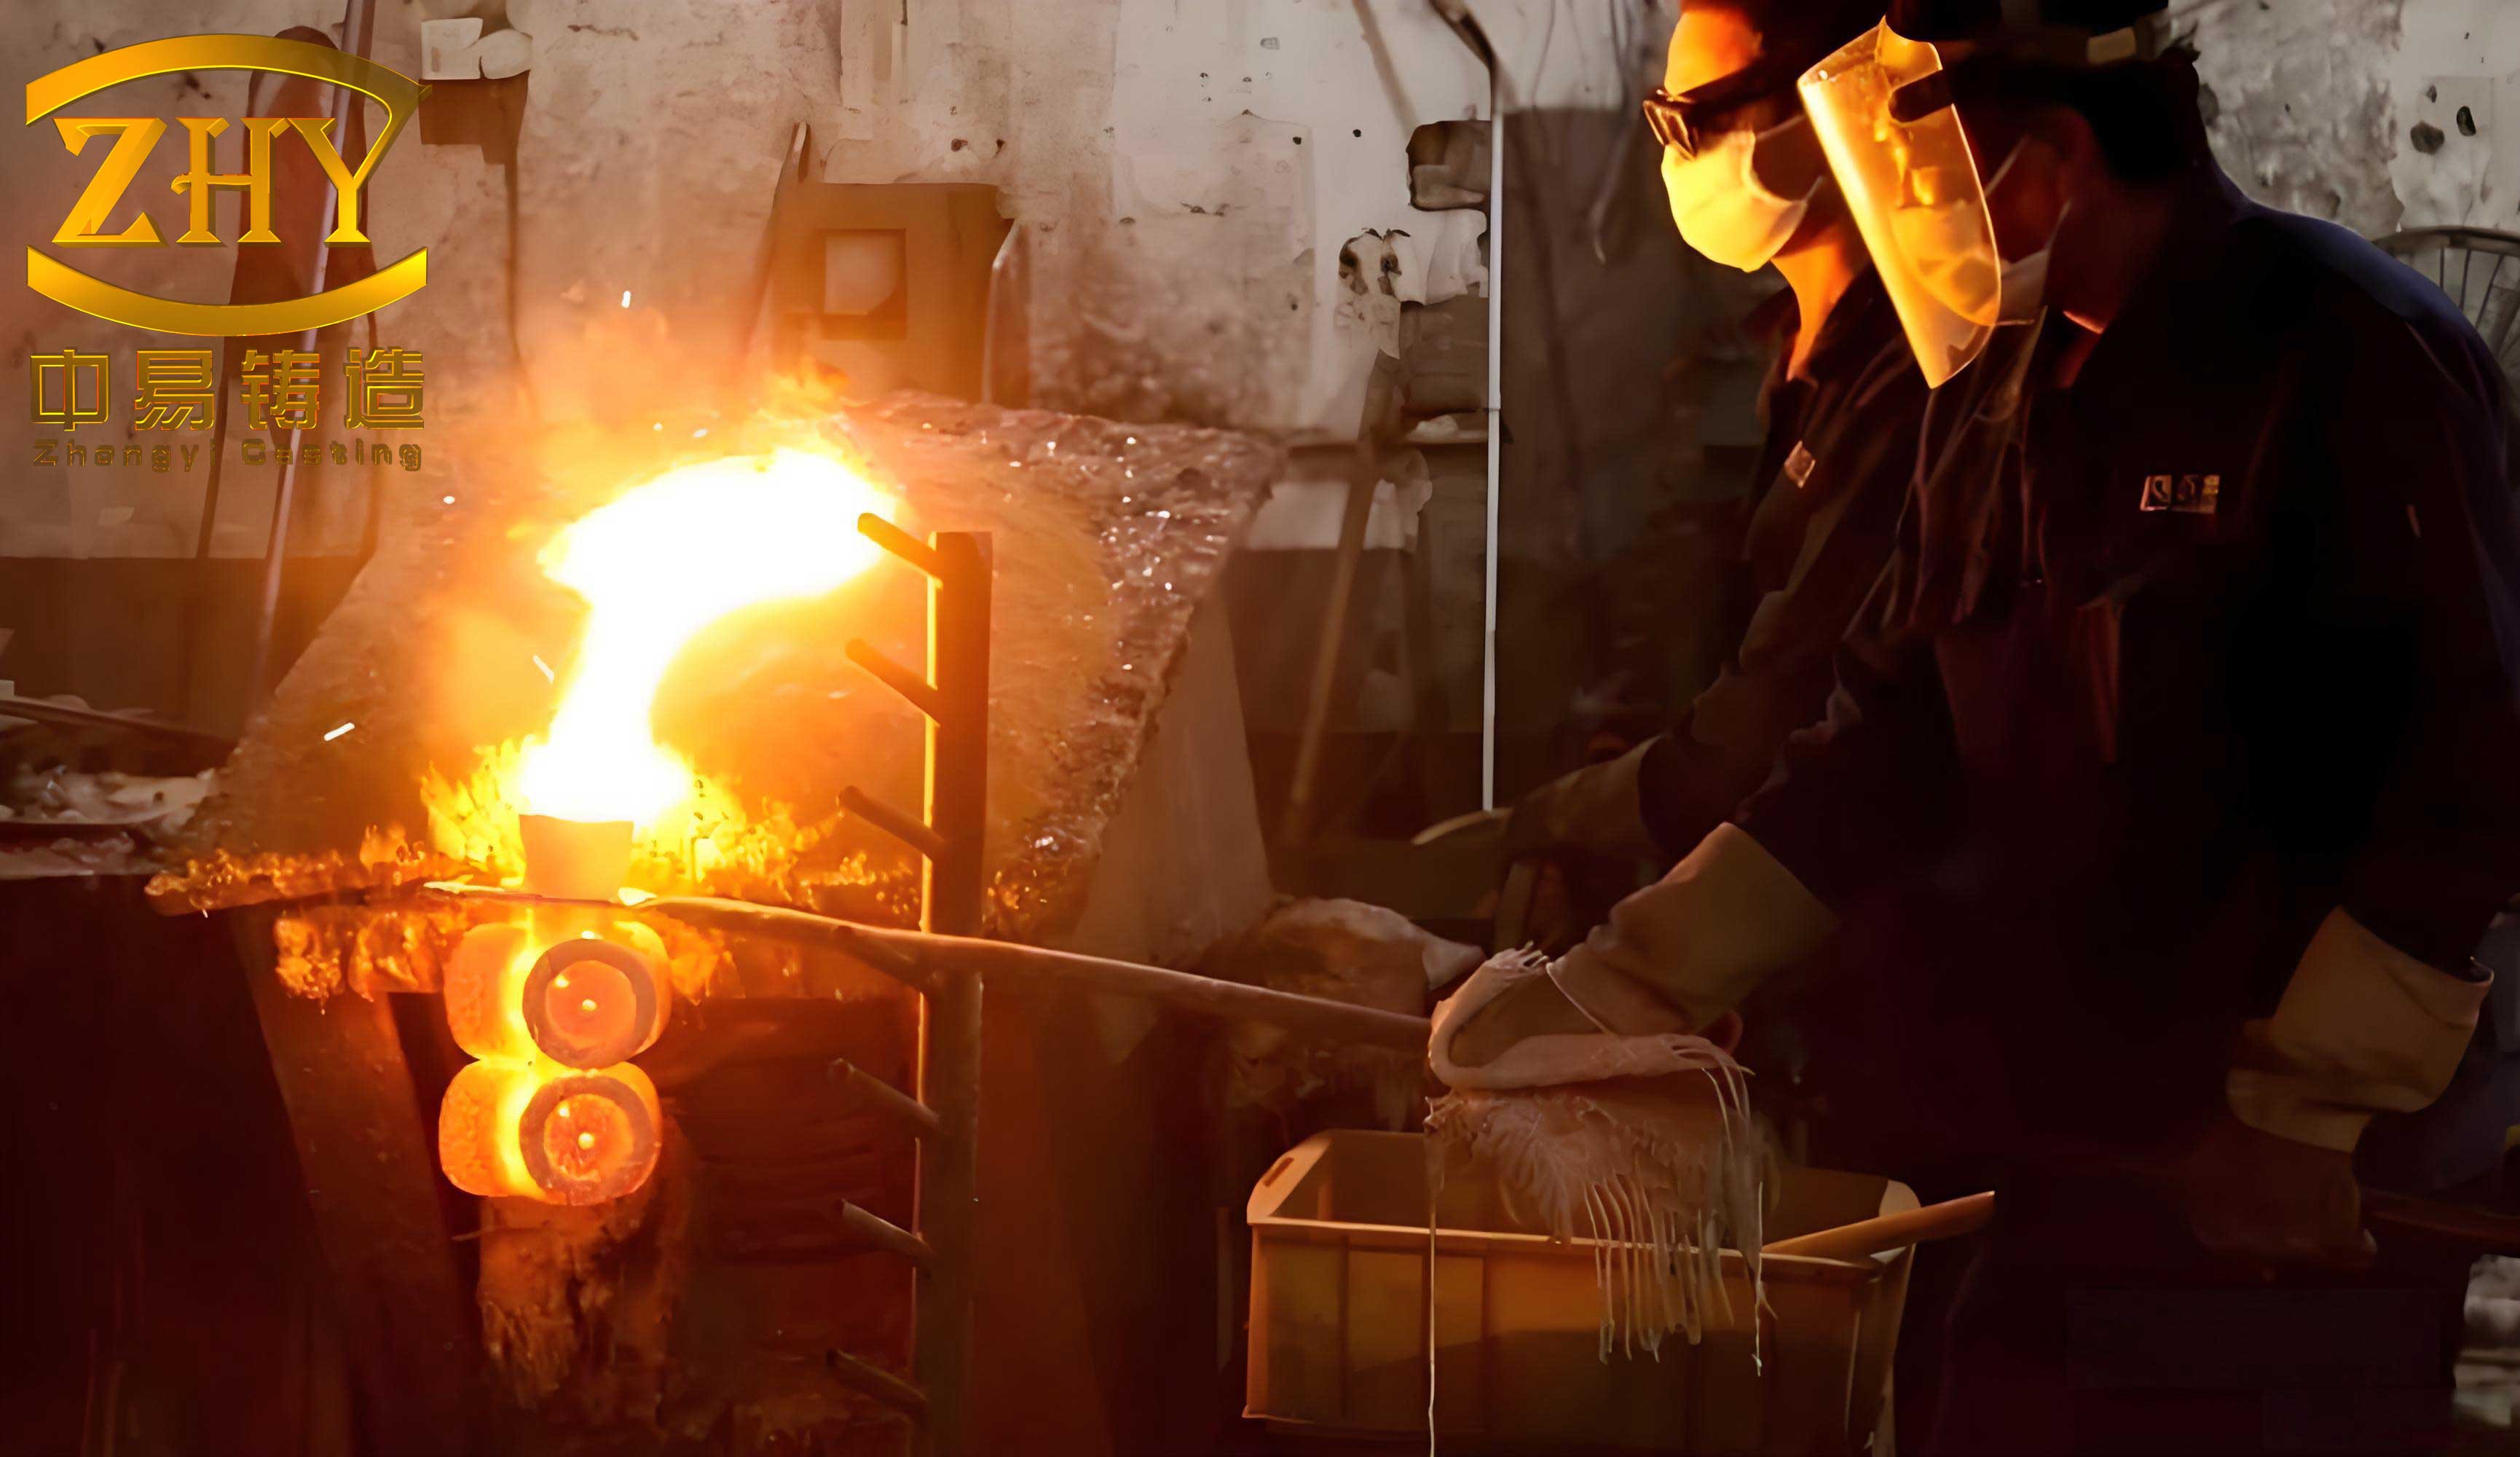
Numerical simulation software, such as ProCAST, FLOW-3D CAST, or MAGMASOFT, provides a virtual foundry. By solving the fundamental equations governing fluid flow, heat transfer, and stress development, these tools allow us to visualize the entire casting process before any metal is melted. The governing equations for fluid flow (Navier-Stokes) and heat transfer are implemented in their finite volume or finite element formulations:
$$ \frac{\partial \rho}{\partial t} + \nabla \cdot (\rho \vec{u}) = 0 $$
$$ \frac{\partial (\rho \vec{u})}{\partial t} + \nabla \cdot (\rho \vec{u} \vec{u}) = -\nabla p + \nabla \cdot \vec{\tau} + \rho \vec{g} + \vec{S} $$
$$ \frac{\partial (\rho h)}{\partial t} + \nabla \cdot (\rho \vec{u} h) = \nabla \cdot (k \nabla T) + S_h $$
where $\rho$ is density, $\vec{u}$ is velocity, $p$ is pressure, $\vec{\tau}$ is the stress tensor, $\vec{g}$ is gravity, $h$ is enthalpy, $k$ is thermal conductivity, $T$ is temperature, and $S$ represents source terms (e.g., momentum sink in the mushy zone, $S_h$ includes latent heat release). For lost wax investment casting, accurate modeling of the free surface (metal-air interface) and the heat extraction through the ceramic shell is paramount. The simulation workflow typically involves three key stages: Pre-processing, Solving, and Post-processing.
| Stage | Key Activities | Critical Outputs/Considerations |
|---|---|---|
| Pre-processing | 3D CAD Geometry Import, Mesh Generation, Material Property Assignment, Boundary Condition Definition, Initial Conditions Setup. | Mesh quality (skewness, aspect ratio) is crucial. Material properties (viscosity, thermal conductivity of metal and shell) must be temperature-dependent. Interface heat transfer coefficients (IHTC) between metal and shell need careful calibration. |
| Solving | Numerical computation of coupled fluid flow, heat transfer, and solidification physics. | Selection of appropriate solvers (e.g., VOF for free surface). Convergence monitoring. Computational time depends on model complexity and mesh size. |
| Post-processing | Visualization and analysis of results: temperature fields, velocity vectors, solidification sequence, defect prediction criteria. | Identification of hot spots, last-to-fill regions, flow turbulence, and quantitative assessment of shrinkage porosity risk (e.g., Niyama criterion) and oxide film entrapment. |
In my research focusing on a complex, thin-walled steel component analogous to a crank, the initial process design led to problematic filling. The initial gating system and a pouring velocity of 0.6 m/s were simulated. The filling sequence clearly showed that certain thin sections and the top of the casting cavity were the last to fill. The total filling time was calculated to be approximately 8.2 seconds. Post-processing analysis using a defect prediction module specifically tuned for lost wax investment casting indicated a high probability of oxide film entrapment in these last-filling zones. This defect, often invisible on radiographs but detrimental to fatigue life, is predicted based on the exposure time of the advancing melt front to the atmosphere within the mold.
The initial simulation predicted an average defect probability index of 0.7 (on a scale of 0 to 1) in the critical area, covering an estimated area of several square millimeters. To mitigate this, a systematic optimization study was undertaken. The most influential and easily adjustable parameter in many lost wax investment casting setups is the pouring velocity. Therefore, a series of simulations were conducted where only the pouring velocity was varied, keeping all other parameters—including alloy composition (a high-performance austenitic steel), pouring temperature (1580°C), and shell properties—constant.
| Pouring Velocity (m/s) | Filling Time (s) | Flow Behavior | Predicted Defect Probability (Index 0-1) | Relative Defect Area |
|---|---|---|---|---|
| 0.2 | ~24.6 | Very slow, laminar front, significant heat loss. | 0.95 (High) | Large |
| 0.4 | ~12.3 | Moderate speed, smoother front than 0.2 m/s. | 0.92 (High) | Medium-Large |
| 0.6 (Initial) | ~8.2 | Faster fill, some front turbulence possible. | 0.70 (Medium-High) | Medium |
| 0.8 | ~6.2 | Optimal: Controlled, progressive fill minimizing front exposure. | ~0.05 (Very Low) | Negligible |
| 1.0 | ~4.9 | Fast, turbulent entry, potential for mold erosion. | 0.40 (Medium) | Small-Medium |
| 1.2 | ~4.1 | Very fast, highly turbulent, severe risk of splash and entrainment. | 0.60 (Medium) | Medium |
The results, summarized in Table 2, reveal a non-linear relationship. Very low velocities (0.2-0.4 m/s) result in a slow, creeping metal front that remains exposed to the mold atmosphere for an extended period, maximizing the time for oxide film formation and entrapment, hence the very high defect probability. As velocity increases to 0.8 m/s, the filling becomes more energetic and directional, reducing the exposure time of individual front segments and promoting a more coherent fill that pushes air ahead effectively into vents or risers. This represents the optimum for this specific geometry and gating design. Beyond this point, higher velocities (1.0-1.2 m/s) induce turbulent breaking of the melt front, which can fold over and trap pockets of air and oxides, increasing the defect probability once again. This phenomenon can be conceptually related to a critical velocity for surface turbulence, often associated with the Bernoulli equation and the melt head pressure:
$$ v_{critical} \propto \sqrt{2gH} $$
where $g$ is gravity and $H$ is the effective metallostatic head. Exceeding this critical velocity in sections of the gating system or mold cavity leads to entrainment.
Beyond filling-related defects, simulation is equally critical for predicting solidification shrinkage and porosity. The thermal history from the filling simulation serves as the input for the solidification analysis. By tracking the evolution of the solid fraction $f_s$, we can identify isolated liquid pockets that become feed points for porosity. Quantitative criteria like the Niyama criterion $G/\sqrt{\dot{T}}$ (where $G$ is thermal gradient and $\dot{T}$ is cooling rate) are calculated post-solidification to map areas at risk of microporosity. For the optimized case with 0.8 m/s pouring speed, the solidification pattern was also more favorable, showing a directional progression from the casting extremities back towards the feeder, minimizing isolated hot spots.
The implications of this virtual optimization for lost wax investment casting are profound. It enables a data-driven approach to process design. The methodology can be extended to other critical parameters. For instance, the geometry of the gating system—runner cross-section, gate placement, and use of filters—can be iteratively tested in simulation to further improve metal delivery. The effect of shell preheat temperature on fluidity and solidification rate can be studied without the cost of multiple furnace runs. A multi-variable optimization can be formalized using a response surface methodology, where simulation results for different parameter combinations are used to fit a meta-model, and an optimization algorithm finds the global optimum. This can be expressed as finding the set of parameters $\vec{x}$ (velocity, temperature, etc.) that minimizes a cost function $F(\vec{x})$ representing defect severity:
$$ \min_{\vec{x}} F(\vec{x}) = w_1 \cdot P_{entrapment}(\vec{x}) + w_2 \cdot V_{porosity}(\vec{x}) + w_3 \cdot t_{cycle}(\vec{x}) $$
subject to: $$ \vec{x}_{lower} \leq \vec{x} \leq \vec{x}_{upper} $$
where $w_i$ are weighting factors, $P$ is entrapment probability, $V$ is porosity volume, and $t$ is cycle time.
| Parameter Category | Specific Variables | Simulation Analysis Focus |
|---|---|---|
| Gating & Feeding Design | Runner size & shape, Gate number/location/size, Feeder size & neck. | Fill pattern uniformity, pressure distribution, feed efficiency, yield. |
| Thermal Parameters | Shell Preheat Temperature, Pouring Temperature, Mold Material Properties. | Thermal gradients, solidification mode (directional vs. pasty), cooling rate. |
| Material Properties | Alloy-specific data: Fraction solid vs. Temperature, Viscosity, Surface Tension. | Accuracy of fluidity, shrinkage prediction, and defect formation models. |
| Process Sequence | Vacuum assistance during pour, Tilt pouring parameters. | Air evacuation, reduction of turbulent entrainment, smooth fill. |
In conclusion, the integration of numerical simulation into the development cycle for lost wax investment casting is not merely an enhancement but a necessity for producing reliable, high-performance steel castings. My investigation demonstrates that parameters like pouring velocity have an optimal window that balances filling time against defect formation mechanisms. Through virtual prototyping, we can systematically explore this window and other parameters at a fraction of the cost and time of physical trials. The ultimate goal is to achieve a “right-first-time” manufacturing philosophy for lost wax investment casting. Future advancements will involve even more integrated models, perhaps coupling macro-scale filling and solidification with micro-scale predictions of grain structure and phase transformations, further solidifying simulation as the cornerstone of intelligent and efficient lost wax investment casting process optimization.