
There are many process parameters of low pressure casting, among which the temperature distribution and filling speed have great influence on the forming of low pressure casting. The temperature distribution determines the solidification sequence of low pressure castings. A reasonable temperature field can avoid the occurrence of isolated liquid phase areas inside low-pressure castings and achieve sequential solidification. The filling speed affects the quality of low-pressure castings through the filling process. If the filling speed is too fast, slag inclusion, air entrainment, and other phenomena may occur during the filling process; If the filling speed is too slow, it will cause the metal liquid to solidify during the filling process.
Therefore, this article selects pouring temperature, preheating temperature of upper and lower molds, and filling time as optimization parameters, and evaluates the solidification time, porosity, and secondary dendrite arm spacing (SDAS) of low-pressure castings as evaluation indicators. A 4-factor 3-level orthogonal table L9 (3 ^ 4) is obtained, as shown in the table.
| Horizontal | A Pouring temperature /℃ | B Upper mold preheating temperature/℃ | C Lower mold preheating temperature/℃ | D Filling time/s |
| 1 | 650 | 200 | 260 | 20 |
| 2 | 680 | 240 | 300 | 25 |
| 3 | 710 | 280 | 340 | 30 |
Since the Taguchi methods usually uses the signal to noise ratio (S/N) instead of the actual simulation result parameters to measure the fluctuation of indicators, the concept of signal to noise ratio is introduced here. It can reflect the average value and changes in the response of quality characteristics, and by controlling process parameters that have a significant impact, the stability of product quality characteristics can be improved. Due to the smaller experimental values of the evaluation indicators used by the research institute, the better the quality characteristics of low-pressure castings. Therefore, the expected small characteristics are used for analysis and calculation of the signal-to-noise ratio, and the calculation formula is as follows:
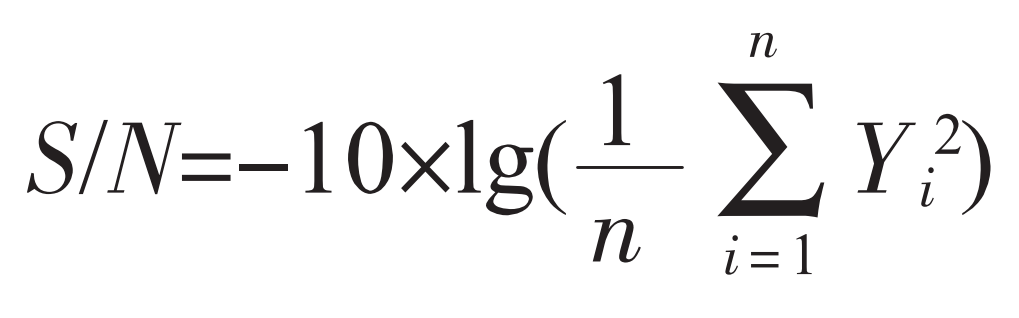
In the formula: n is the number of trials in this group; Yi is the objective function value of the experimental results.