
I studied a complex thin-walled stainless steel bearing seat used in food equipment, and I treated the production problem as a coupled problem of precision casting process design, numerical simulation, and intelligent optimization. The part was made from 1.4308 stainless steel, and the actual production route suffered from shrinkage porosity, shrinkage cavities, misrun, scabs, and stress-related deformation. In my work, I focused on how the gating system and the precision casting parameters control these defects. I used three-dimensional modeling, finite-element simulation, orthogonal experimentation, a back-propagation neural network, particle swarm optimization, and a genetic algorithm to improve both the qualified product rate and the process yield.
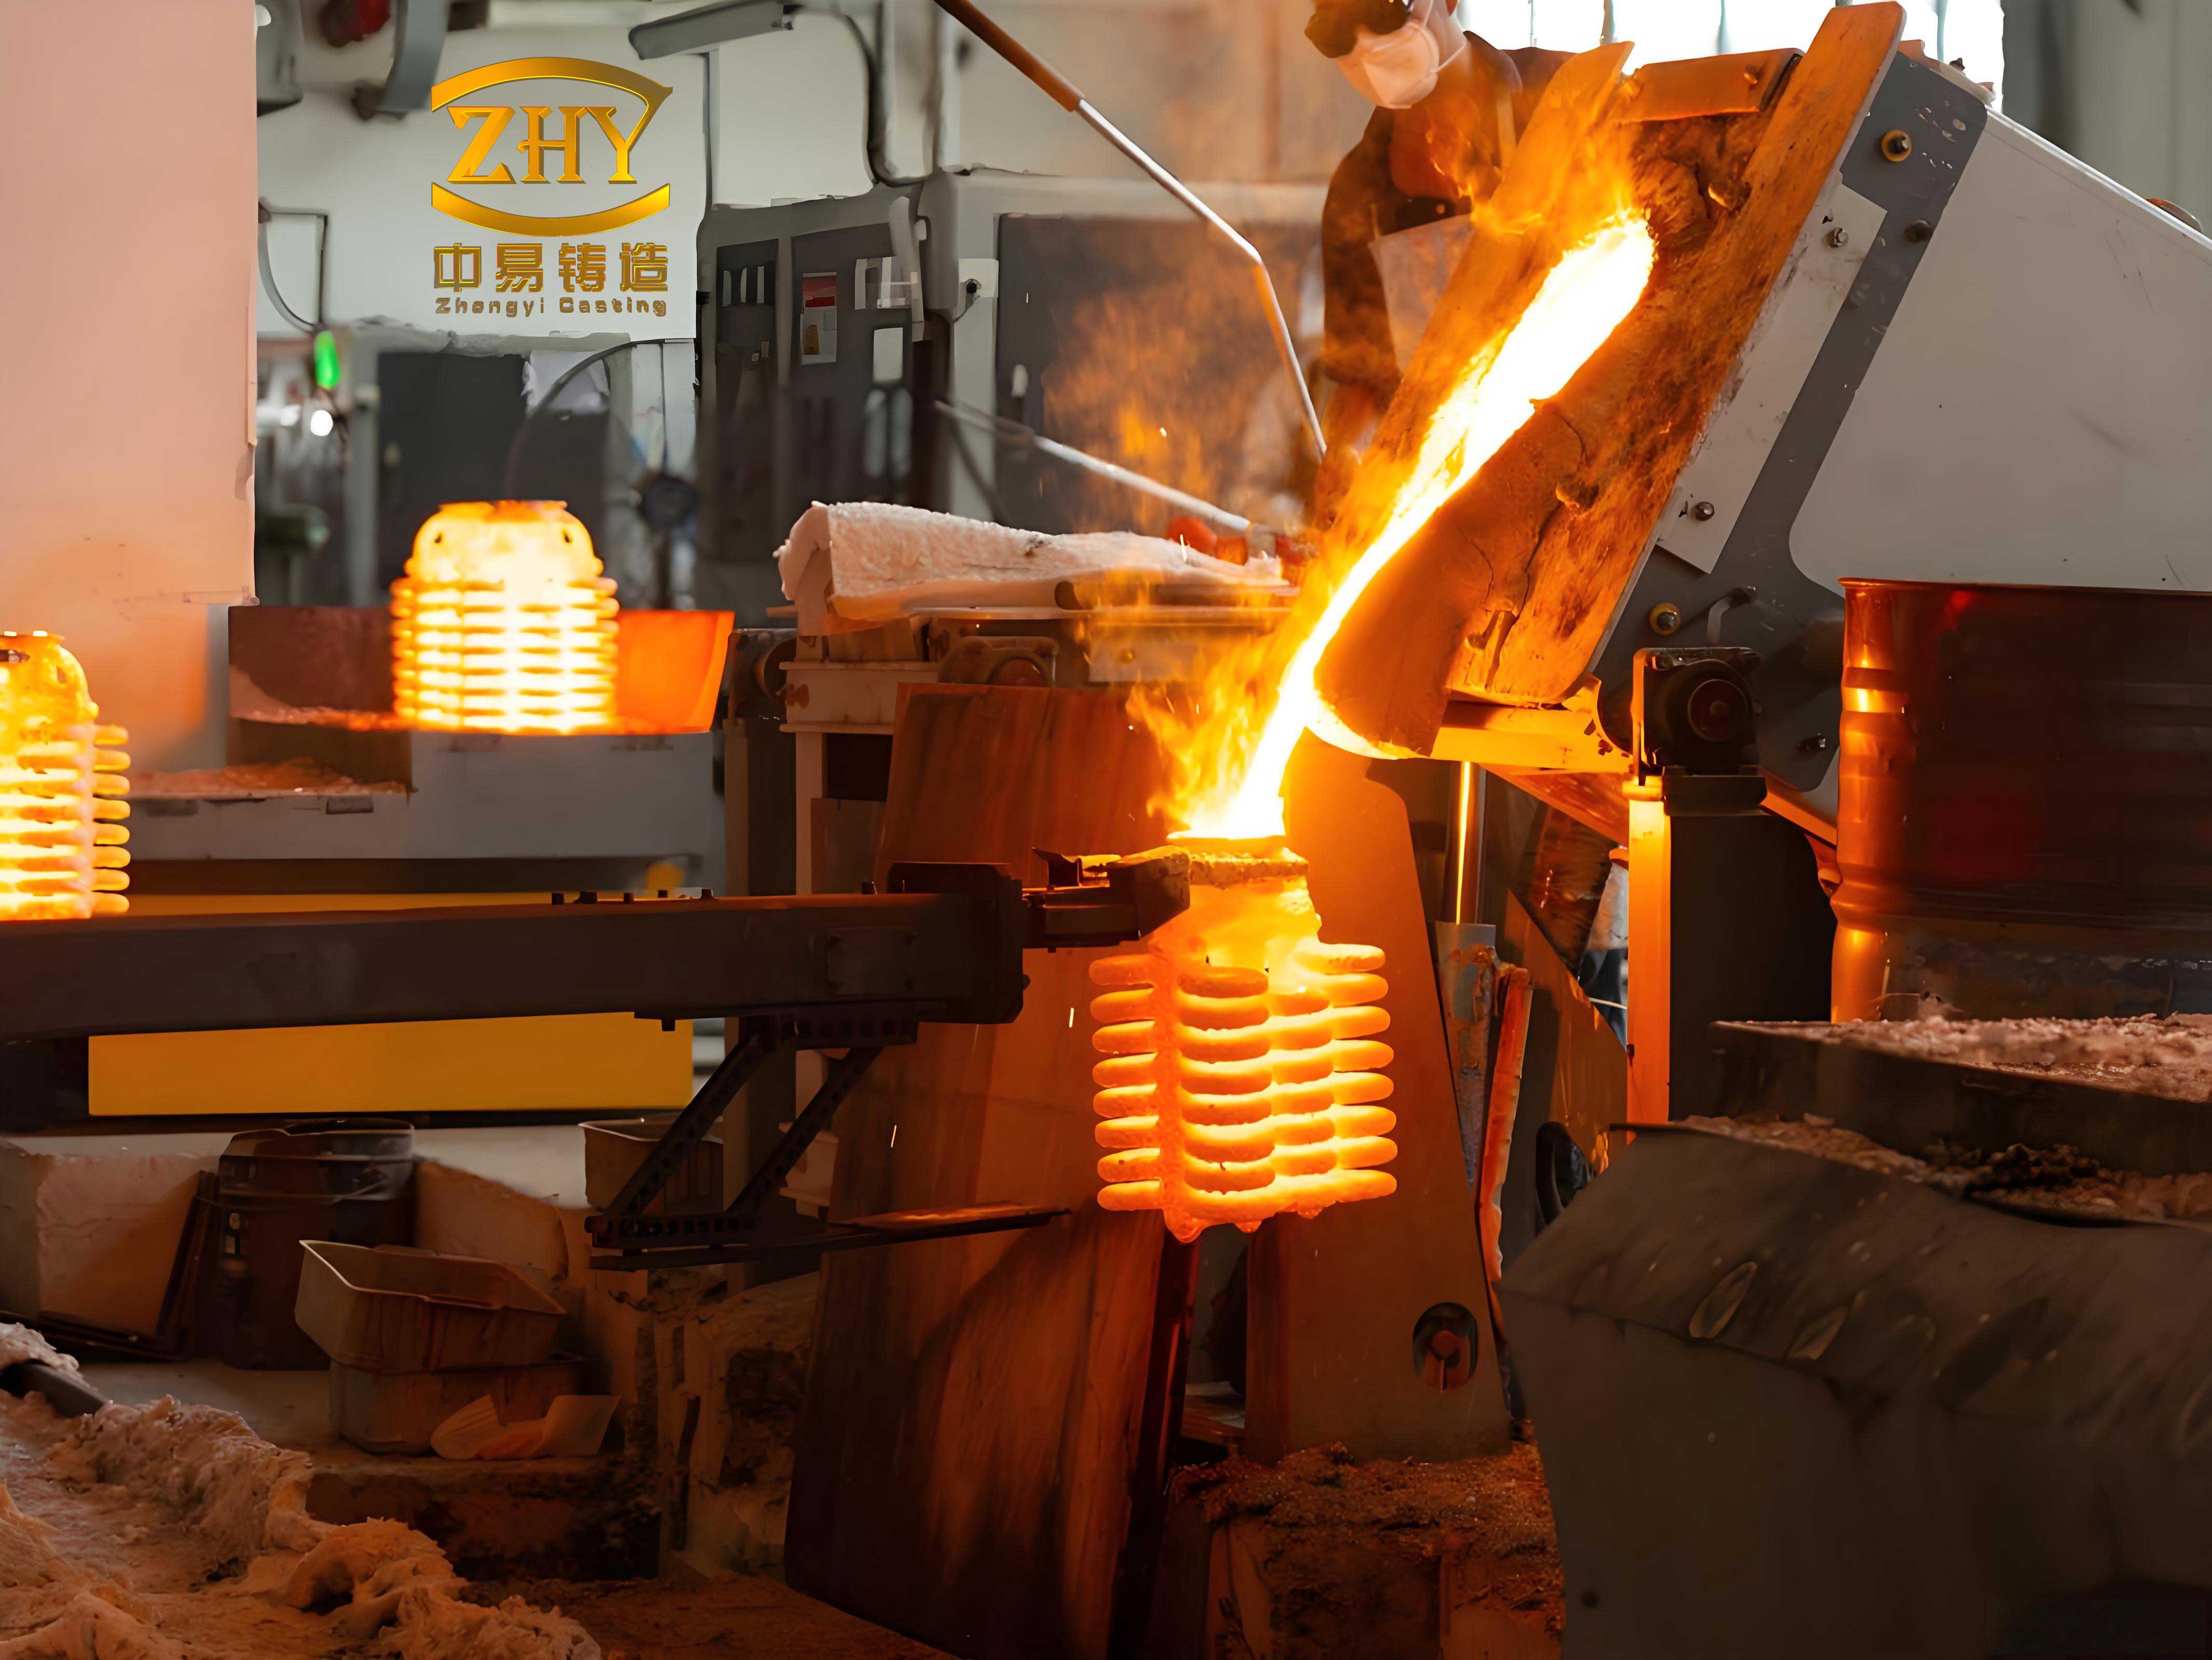
Material and Process Basis
I selected 1.4308 stainless steel because it combines corrosion resistance, high-temperature stability, and good mechanical machining behavior. Its chemical composition is given in Table 1. The carbon content is kept low, while chromium and nickel provide the austenitic matrix required for food-contact service. In precision casting, the metal composition must be tightly controlled because small shifts in chromium, nickel, or carbon can change fluidity, solidification range, and final shrinkage behavior.
| Element | C | Si | Mn | P | S | Cr | Ni | Fe |
|---|---|---|---|---|---|---|---|---|
| Requirement, wt.% | ≤0.07 | ≤1.50 | ≤1.50 | ≤0.040 | ≤0.030 | 18.0–20.0 | 8.00–11.0 | Balance |
| Measured sample, wt.% | 0.064 | 0.703 | 1.173 | 0.027 | 0.0050 | 18.42 | 8.36 | Balance |
For the precision casting wax pattern, I used a recyclable medium-temperature wax. Its softening point, drop point, shrinkage, penetration, and ash content are summarized in Table 2. A low standard shrinkage is important because the wax pattern directly reproduces the final casting shape. If the wax shrinks too much or too unevenly, the mold cavity becomes distorted before the metal is ever poured.
| Property | Softening point, °C | Drop point, °C | Standard shrinkage | Penetration | Ash content | Color |
|---|---|---|---|---|---|---|
| Value | 79.40–85.00 | 87.70–93.30 | 0.90%–1.00% | 20–30D | <0.02% | Yellow-brown |
For the ceramic shell, I used a zircon sand face coat and mullite backup coats with a silica sol binder. Zircon provides high refractoriness and relatively low thermal expansion, while mullite provides good high-temperature strength and creep resistance. The key refractory properties are listed in Table 3. These properties affect shell strength, thermal insulation, and the heat-transfer coefficient between the metal and the mold during precision casting.
| Material | Chemical nature | Melting point, °C | Refractoriness, °C | Density, g/cm³ | Thermal expansion, 1/°C |
|---|---|---|---|---|---|
| Zircon sand | Acidic | 2750 | >1825 | 4.5–4.9 | 4.6 × 10⁻⁶ |
| Mullite sand | Neutral | 1810 | >1700 | 3.16 | 4.5 × 10⁻⁶ |
I described the mold filling process with the continuity equation, the Navier–Stokes equations for an incompressible viscous liquid, and the energy equation. The continuity equation is:
$$ \frac{\partial u}{\partial x}+\frac{\partial v}{\partial y}+\frac{\partial w}{\partial z}=0 $$
The momentum conservation in the three coordinate directions can be written as:
$$ \rho\left(\frac{\partial u}{\partial t}+u\frac{\partial u}{\partial x}+v\frac{\partial u}{\partial y}+w\frac{\partial u}{\partial z}\right)=-\frac{\partial p}{\partial x}+\mu\left(\frac{\partial^2 u}{\partial x^2}+\frac{\partial^2 u}{\partial y^2}+\frac{\partial^2 u}{\partial z^2}\right)+\rho g_x $$
$$ \rho\left(\frac{\partial v}{\partial t}+u\frac{\partial v}{\partial x}+v\frac{\partial v}{\partial y}+w\frac{\partial v}{\partial z}\right)=-\frac{\partial p}{\partial y}+\mu\left(\frac{\partial^2 v}{\partial x^2}+\frac{\partial^2 v}{\partial y^2}+\frac{\partial^2 v}{\partial z^2}\right)+\rho g_y $$
$$ \rho\left(\frac{\partial w}{\partial t}+u\frac{\partial w}{\partial x}+v\frac{\partial w}{\partial y}+w\frac{\partial w}{\partial z}\right)=-\frac{\partial p}{\partial z}+\mu\left(\frac{\partial^2 w}{\partial x^2}+\frac{\partial^2 w}{\partial y^2}+\frac{\partial^2 w}{\partial z^2}\right)+\rho g_z $$
The energy equation includes heat conduction, convection, and latent heat release during solidification:
$$ \rho c_p\left(\frac{\partial T}{\partial t}+u\frac{\partial T}{\partial x}+v\frac{\partial T}{\partial y}+w\frac{\partial T}{\partial z}\right)=\lambda\left(\frac{\partial^2 T}{\partial x^2}+\frac{\partial^2 T}{\partial y^2}+\frac{\partial^2 T}{\partial z^2}\right)+L\frac{\partial f_s}{\partial t} $$
For the solidification stage, I used Fourier’s law for conduction, Newton’s law for convection, and the Stefan–Boltzmann law for radiation:
$$ q=-k\nabla T $$
$$ q=h\left(T_\infty-T_s\right) $$
$$ q=\varepsilon\sigma T_s^4 $$
I predicted shrinkage cavities and shrinkage porosity through the critical solid fraction method and the Niyama criterion. The total shrinkage volume is the sum of cavity volume and porosity volume:
$$ V_{sz}=V_{sk}+V_{ss} $$
The Niyama criterion is especially useful for thin-walled precision casting because it includes both local temperature gradient and cooling rate:
$$ \frac{G}{\sqrt{R}}<k $$=""
The local temperature gradient and cooling rate are calculated from neighboring finite-element cells:
$$ G=\max\left\{\frac{\left|T_{i,j,k}-T_{i+m,j+m,k+m}\right|}{\sqrt{(m\Delta x)^2+(m\Delta y)^2+(m\Delta z)^2}}\right\},\quad m=-1,0,1 $$
$$ R=\frac{\left|T_{i,j,k}^{m+1}-T_{i,j,k}^{m}\right|}{\Delta t} $$
Part Analysis and Casting Scheme Design
The bearing seat had a maximum outline of about 245 mm by 214 mm, a cylindrical tube length of about 245 mm, and a general wall thickness of 5–6 mm before machining. After machining, the tube wall became about 3 mm. One side of the rectangular frame had a protruding thin wall about 2.4 mm thick and 31.6 mm long, and the inner rectangular hollow contained regions as thin as 1.8 mm. The rectangular frame itself measured about 196.6 mm by 177.6 mm, and its inner recess had a wall thickness near 3 mm. A reinforcing rib about 2.5 mm thick connected the cylindrical and rectangular sections. The total mass of the part was about 2.2 kg. These features made the part a difficult precision casting because the thin walls cooled quickly, while the irregular junctions created isolated liquid regions that could not be fed.
I determined the pouring position by considering feeding direction, thin-wall placement, and the location of important functional surfaces. The cylindrical bore needed coaxiality, the outer bosses needed flatness, and the lower protruding thin plate needed flatness for assembly. Therefore, I placed the critical surfaces away from the last-solidifying regions and located the ingates so that the metal could feed the thick junctions while still filling the thin walls. I evaluated four main pouring positions and designed five gating system schemes, as summarized in Table 4.
| Scheme | Pouring position and gating type | Module mass, kg | Process yield | Main feature |
|---|---|---|---|---|
| 1 | Horizontal tube, thin plate at lower side, combined pouring | 9.9 | 44.4% | Single sprue with ingates; large thin plane at bottom |
| 2 | Vertical tube, thin plate at one side, step pouring | 11.6 | 37.9% | Multiple sprue branches; stable filling but lower yield |
| 3 | Horizontal tube, thin plate inclined, inclined pouring | 10.2 | 43.1% | Slower metal rise; possible gas entrapment |
| 4 | Horizontal tube, thin plate at upper side, combined pouring | 10.4 | 42.3% | Bottom first filling followed by middle feeding |
| 5 | Vertical tube, thin plate at one side, four parts per tree, combined step pouring | 18.0 | 48.9% | Highest process yield; multiple ingates and four-cavity cluster |
I estimated the minimum pouring speed from the thinnest wall and the maximum flow length:
$$ v_J=K\frac{L}{\delta_{\min}} $$
I also estimated the pouring time from the casting mass and the minimum wall thickness:
$$ t_J=S\sqrt{G\delta_{\min}} $$
Here, \(K\) is a pouring coefficient, \(L\) is the maximum thin-wall length, \(\delta_{\min}\) is the minimum wall thickness, \(S\) is an empirical coefficient, and \(G\) is the total poured metal mass. For the initial precision casting trials, I selected a pouring temperature of 1620 °C, a pouring speed of 2 kg·s⁻¹, a shell preheating temperature of 1130 °C, and a shell thickness of 6 mm.
Numerical Simulation Setup
I imported the solid models into a finite-element casting simulation environment. Because the gating systems were largely symmetric, I used half models to reduce computation time. I repaired all surfaces, assembled the contact interfaces, generated surface meshes, and then generated tetrahedral volume meshes. The gating system used a minimum element size of 4 mm, while the bearing seat used a minimum element size of 2 mm. The shell was generated with an initial thickness of 6 mm. Table 5 summarizes the mesh and shell setup.
| Item | Setting |
|---|---|
| Gating system surface mesh | Minimum element 4 mm |
| Bearing seat surface mesh | Minimum element 2 mm |
| Shell generation | 6 mm initial thickness |
| Volume mesh | Tetrahedral finite elements |
| Gravity direction | Normal to pouring cup plane |
| Metal–shell interface | Coincident interface, 500 W·m⁻²·K⁻¹ |
| Cooling condition | Air cooling |
| Casting type | Investment or shell casting |
For 1.4308 stainless steel, I used a solidus temperature of 1386 °C and a liquidus temperature of 1485 °C. The thermophysical properties included temperature-dependent thermal conductivity, enthalpy, solid fraction, and viscosity. I set the initial metal temperature to 1620 °C and the shell temperature to 1130 °C. These boundary conditions allowed me to compare the five gating schemes under the same initial precision casting conditions.
Filling and Solidification Behavior
I analyzed the filling sequence of each scheme. In scheme 1, the metal entered the part through two side ingates, then filled the bottom thin wall, and finally rose evenly to complete the casting. In scheme 2, the double sprue reduced the impact on the mold wall, but the top of the rectangular frame required later feeding from the cylindrical side. In scheme 3, the inclined position caused the liquid level to be higher on the two sides than in the middle, and local splashing appeared. In scheme 4, the bottom ingate filled the lower rectangular frame first, but the middle cross runner showed splashing. In scheme 5, the four-cavity cluster filled in a stepped sequence, and the liquid level near the rectangular thin wall was highest while the cylindrical side was temporarily lower. The filling times and qualitative behavior are compared in Table 6.
| Scheme | Approximate completion time, s | Filling behavior | Observed risk |
|---|---|---|---|
| 1 | 5.73 | Bottom thin wall first, then even rise | Some initial air entrapment in bottom runner |
| 2 | 5.11 | Double sprue reduces impact | Top frame depends on later feeding |
| 3 | 4.49 | Sides higher than middle | Splashing and possible gas entrapment |
| 4 | 4.90 | Bottom frame first, then cylinder | Cross-runner splashing |
| 5 | 6.14 | Stepped filling, four parts per tree | Highest yield but longer filling path |
During solidification, all five schemes began to freeze at the outer thin walls. As solid fraction increased, isolated liquid regions appeared at the irregular junctions between the cylindrical tube and the rectangular frame. These isolated regions could not receive enough liquid metal, so they became the main sites for shrinkage porosity and shrinkage cavities. I tracked the solid fraction and defect formation. The predicted shrinkage locations and volumes are listed in Table 7.
| Scheme | Predicted shrinkage locations | Predicted shrinkage volume, cc | Main defect concentration |
|---|---|---|---|
| 1 | 14 | 0.71 | Rib intersections, tube hollow wall, irregular junction |
| 2 | 16 | 0.76 | Right rib intersection, tube wall, irregular junction |
| 3 | 15 | 0.76 | Upper rib intersection, tube hollow wall, irregular junction |
| 4 | 12 | 0.84 | Upper rib intersection, tube-frame junction |
| 5 | 14 | 0.76 | Lower rib intersection, tube-frame junction |
I then compared the simulation results with actual precision casting trials. The wax patterns were injected, assembled, cleaned, coated with zircon face slurry, backed with mullite slurry, dried, dewaxed, and preheated. The metal was melted and poured at about 1620 °C into shells preheated to about 1130 °C. After cooling, the castings were shelled, cut, sandblasted, and acid-cleaned. I inspected the external surfaces visually and used X-ray radiography for internal defects. Because the overlapping cylindrical and rectangular geometry can hide defects in radiographic projection, I also used wire electrical discharge machining to section selected parts. The actual defect statistics are shown in Table 8.
| Scheme | Tree type | Shrinkage defects | Scab defects | Defect count per part |
|---|---|---|---|---|
| 1 | Two parts | 2 | 5 | 3.5 |
| 2 | Two parts | 3 | 2 | 2.5 |
| 3 | Two parts | 1 | 10 | 5.5 |
| 4 | Two parts | 2 | 0 | 1.0 |
| 5 | Four parts | 1 | 5 | 1.5 |
Although several schemes had low predicted shrinkage volume, I selected scheme 5 as the final gating structure. It provided the highest process yield, at 48.9%, and it produced the most stable overall result when surface scabs, internal shrinkage, and four-cavity production were considered together. The stepped combined pouring system allowed the mold to fill progressively and provided feeding paths for the thin walls and irregular junctions. This decision was important because precision casting economics depend not only on defect volume but also on yield and repeatability.
Orthogonal Optimization of Precision Casting Parameters
After fixing the gating structure, I optimized four precision casting parameters: pouring temperature, pouring speed, shell preheating temperature, and shell thickness. I designed a four-factor, five-level orthogonal experiment using an L25 orthogonal array. The factor levels are listed in Table 9.
| Level | Pouring temperature, °C | Pouring speed, kg·s⁻¹ | Shell preheating temperature, °C | Shell thickness, mm |
|---|---|---|---|---|
| 1 | 1600 | 1.50 | 1110 | 5.0 |
| 2 | 1610 | 1.75 | 1120 | 5.5 |
| 3 | 1620 | 2.00 | 1130 | 6.0 |
| 4 | 1630 | 2.25 | 1140 | 6.5 |
| 5 | 1640 | 2.50 | 1150 | 7.0 |
I used shrinkage porosity volume and equivalent stress as the two quality responses. The 25 simulation results are given in Table 10. I kept all other conditions constant so that the effect of each parameter could be isolated. The shrinkage volume was measured from the simulated defect field, and the equivalent stress was taken from the stress simulation after solidification.
| Run | Pouring temperature, °C | Pouring speed, kg·s⁻¹ | Shell preheating temperature, °C | Shell thickness, mm | Shrinkage volume, cc | Equivalent stress, MPa |
|---|---|---|---|---|---|---|
| 1 | 1600 | 1.50 | 1110 | 5.0 | 0.81 | 570.80 |
| 2 | 1600 | 1.75 | 1130 | 6.5 | 1.11 | 406.03 |
| 3 | 1600 | 2.00 | 1150 | 5.5 | 0.68 | 485.33 |
| 4 | 1600 | 2.25 | 1120 | 7.0 | 1.01 | 387.78 |
| 5 | 1600 | 2.50 | 1140 | 6.0 | 1.06 | 452.99 |
| 6 | 1610 | 1.50 | 1150 | 6.5 | 0.86 | 408.64 |
| 7 | 1610 | 1.75 | 1120 | 5.5 | 0.83 | 513.65 |
| 8 | 1610 | 2.00 | 1140 | 7.0 | 0.95 | 372.29 |
| 9 | 1610 | 2.25 | 1110 | 6.0 | 1.01 | 473.41 |
| 10 | 1610 | 2.50 | 1130 | 5.0 | 0.68 | 559.18 |
| 11 | 1620 | 1.50 | 1140 | 5.5 | 0.66 | 491.83 |
| 12 | 1620 | 1.75 | 1110 | 7.0 | 1.06 | 400.16 |
| 13 | 1620 | 2.00 | 1130 | 6.0 | 0.76 | 459.94 |
| 14 | 1620 | 2.25 | 1150 | 5.0 | 0.53 | 569.59 |
| 15 | 1620 | 2.50 | 1120 | 6.5 | 0.84 | 415.10 |
| 16 | 1630 | 1.50 | 1130 | 7.0 | 0.82 | 399.75 |
| 17 | 1630 | 1.75 | 1150 | 6.0 | 0.66 | 478.66 |
| 18 | 1630 | 2.00 | 1120 | 5.0 | 0.63 | 557.82 |
| 19 | 1630 | 2.25 | 1140 | 6.5 | 0.65 | 420.54 |
| 20 | 1630 | 2.50 | 1110 | 5.5 | 0.87 | 513.04 |
| 21 | 1640 | 1.50 | 1120 | 6.0 | 0.71 | 488.42 |
| 22 | 1640 | 1.75 | 1140 | 5.0 | 0.50 | 564.70 |
| 23 | 1640 | 2.00 | 1110 | 6.5 | 0.82 | 426.47 |
| 24 | 1640 | 2.25 | 1130 | 5.5 | 0.61 | 507.49 |
| 25 | 1640 | 2.50 | 1150 | 7.0 | 0.68 | 390.18 |
I performed a range analysis on the orthogonal results. For each factor, I summed the response values at each level and calculated the range:
$$ K_{ij}=\sum_{r=1}^{m} y_{ijr} $$
$$ R_j=\max_i(K_{ij})-\min_i(K_{ij}) $$
Table 11 gives the range analysis. For shrinkage volume, the order of influence was shell thickness > pouring temperature > shell preheating temperature > pouring speed. For equivalent stress, the order was shell thickness > shell preheating temperature > pouring temperature > pouring speed. This showed that shell thickness was the dominant precision casting parameter for both defect responses.
| Response | Factor | K1 | K2 | K3 | K4 | K5 | Range R |
|---|---|---|---|---|---|---|---|
| Shrinkage volume, cc | Pouring temperature | 4.66 | 4.33 | 3.85 | 3.63 | 3.31 | 1.35 |
| Shrinkage volume, cc | Pouring speed | 3.85 | 4.16 | 3.83 | 3.81 | 4.12 | 0.35 |
| Shrinkage volume, cc | Shell preheating temperature | 4.57 | 4.01 | 3.97 | 3.81 | 3.41 | 1.16 |
| Shrinkage volume, cc | Shell thickness | 3.14 | 3.65 | 4.20 | 4.27 | 4.52 | 1.38 |
| Equivalent stress, MPa | Pouring temperature | 2302.93 | 2327.18 | 2336.63 | 2369.80 | 2377.25 | 74.32 |
| Equivalent stress, MPa | Pouring speed | 2359.44 | 2363.20 | 2301.85 | 2358.80 | 2330.49 | 61.35 |
| Equivalent stress, MPa | Shell preheating temperature | 2383.87 | 2362.77 | 2332.39 | 2302.35 | 2332.41 | 81.52 |
| Equivalent stress, MPa | Shell thickness | 2822.09 | 2511.34 | 2353.42 | 2076.78 | 1950.16 | 871.93 |
BP Neural Network and PSO Optimization
I built a back-propagation neural network to map the four precision casting parameters to the two quality responses. The network had four input nodes, nine hidden nodes, and two output nodes. I normalized the data before training:
$$ x’=\frac{x-x_{\min}}{x_{\max}-x_{\min}} $$
The hidden layer used a sigmoid transfer function:
$$ f(x)=\frac{1}{1+e^{-x}} $$
The output layer used a linear function. For an input vector \(x\), the network prediction can be written as:
$$ y=w_2 f(w_1 x+b_1)+b_2 $$
The training error was defined as:
$$ E=\frac{1}{2}\sum_{k=1}^{N}\left(y_k-\hat{y}_k\right)^2 $$
Because the initial weights and biases of a BP neural network are random, the network can fall into a local minimum. I therefore used particle swarm optimization to find better initial weights and biases. The PSO velocity and position updates were:
$$ v_{id}^{k+1}=wv_{id}^{k}+c_1r_1\left(p_{id}^{k}-x_{id}^{k}\right)+c_2r_2\left(p_{gd}^{k}-x_{id}^{k}\right) $$
$$ x_{id}^{k+1}=x_{id}^{k}+v_{id}^{k+1} $$
I set the PSO maximum iteration to 100, swarm size to 50, particle length to 44, learning factors to 1.5, inertia weight to 0.8, position range to [-0.7, 0.7], and velocity range to [-10, 10]. I compared PSO with a genetic algorithm for optimizing the same BP network. The PSO-optimized network reached a stable fitness after about 40 generations, while the GA-optimized network stabilized after about 55 generations. The final PSO fitness was lower, so I used the PSO-BP model as the nonlinear prediction model for precision casting.
Genetic Algorithm for Parameter Optimization
I used a genetic algorithm to search for the best combination of pouring temperature, pouring speed, shell preheating temperature, and shell thickness. The optimization objective was a weighted sum of shrinkage volume and equivalent stress:
$$ \min f=w_1f_1+w_2f_2 $$
The variables were constrained as follows:
$$ 1600 \leq x_1 \leq 1640 $$
$$ 1.5 \leq x_2 \leq 2.5 $$
$$ 1110 \leq x_3 \leq 1150 $$
$$ 5 \leq x_4 \leq 7 $$
Here, \(x_1\) is pouring temperature, \(x_2\) is pouring speed, \(x_3\) is shell preheating temperature, and \(x_4\) is shell thickness. The GA used real-number coding, a population of 50 individuals, a crossover probability of 0.8, a mutation probability of 0.2, and 100 generations. I tested different weight combinations. The results are summarized in Table 12.
| Weight \(w_1\) for shrinkage | Weight \(w_2\) for stress | Pouring temperature, °C | Pouring speed, kg·s⁻¹ | Shell preheating temperature, °C | Shell thickness, mm | Shrinkage, cc | Shrinkage improvement | Stress, MPa | Stress improvement |
|---|---|---|---|---|---|---|---|---|---|
| 0.5 | 0.5 | 1639.65 | 2.41 | 1122.00 | 6.97 | 0.68 | 10.53% | 393.11 | 14.53% |
| 0.6 | 0.4 | 1603.05 | 2.15 | 1148.89 | 5.01 | 0.54 | 28.95% | 436.62 | 5.07% |
| 0.7 | 0.3 | 1601.00 | 2.15 | 1149.96 | 5.01 | 0.49 | 35.53% | 439.84 | 4.37% |
| 0.8 | 0.2 | 1619.26 | 1.53 | 1148.70 | 5.05 | 0.42 | 44.74% | 448.86 | 2.41% |
| 0.9 | 0.1 | 1618.47 | 2.29 | 1136.91 | 5.03 | 0.58 | 23.68% | 434.85 | 5.46% |
I selected the weight combination that gave the strongest reduction in shrinkage porosity because shrinkage was the main cause of rejection in the actual precision casting line. The best combination was \(w_1=0.8\) and \(w_2=0.2\), which produced a pouring temperature of 1619.26 °C, a pouring speed of 1.53 kg·s⁻¹, a shell preheating temperature of 1148.70 °C, and a shell thickness of 5.05 mm. Under these conditions, the predicted shrinkage volume was 0.42 cc, a 44.74% reduction, and the equivalent stress was 448.86 MPa, a 2.41% reduction.
Numerical Verification of the Optimized Process
I reran the filling and solidification simulation with the optimized parameters. The slower pouring speed produced a smoother metal front. The higher shell preheating temperature improved the thermal insulation of the thin walls. The thinner shell improved gas permeability and reduced the tendency for local overheating. The stepped gating system still filled the part progressively, and the final solidification occurred in the feeding channels rather than in the isolated thin-wall junctions. Table 13 compares the original scheme 5 parameters with the optimized parameters and responses.
| Condition | Pouring temperature, °C | Pouring speed, kg·s⁻¹ | Shell preheating temperature, °C | Shell thickness, mm | Shrinkage volume, cc | Equivalent stress, MPa |
|---|---|---|---|---|---|---|
| Original scheme 5 | 1620 | 2.00 | 1130 | 6.00 | 0.76 | 459.94 |
| Optimized process | 1619.26 | 1.53 | 1148.70 | 5.05 | 0.42 | 448.86 |
| Improvement | — | — | — | — | 44.74% | 2.41% |
I calculated the improvement percentages using:
$$ \eta=\frac{y_{\text{original}}-y_{\text{optimized}}}{y_{\text{original}}}\times 100\% $$
The optimized simulation showed fewer shrinkage sites and a smaller maximum defect area. The filling process remained stable, and no misrun or cold shut was predicted. The shell thickness near 5 mm was especially important because the range analysis had already shown shell thickness to be the strongest factor. A shell that is too thick retains heat and delays local cooling, while a shell that is too thin may lack strength. In my precision casting trials, a shell thickness close to 5 mm gave the best balance between strength and thermal behavior.
Experimental Validation
I validated the optimized precision casting process through production trials. The pouring temperature was controlled near 1619 °C, the shell preheating temperature near 1148 °C, the shell thickness near 5 mm, and the pouring speed near 1.5 kg·s⁻¹. The pouring time was kept near 12 s. After shell removal, cutting, sandblasting, and acid cleaning, I inspected the bearing seats visually. The surfaces showed no visible shrinkage cavities, no cold shuts, no scabs, and no obvious deformation. The parts also passed flatness and coaxiality checks on the corresponding fixtures. Table 14 summarizes the experimental validation.
| Check item | Original condition | Optimized condition | Observed result |
|---|---|---|---|
| Surface shrinkage | Present on several parts | Not visible | Improved |
| Scab | Present near thin-wall roots | Not visible | Improved |
| Cold shut or misrun | Risk in thin walls | Not observed | Improved |
| Flatness of bosses | Occasional distortion | Within fixture requirement | Accepted |
| Coaxiality of tube | Occasional deviation | Within fixture requirement | Accepted |
| X-ray internal inspection | Local shrinkage suspected | No obvious shrinkage | Accepted |
| Sectioned inspection | Shrinkage at junctions | Shrinkage essentially eliminated | Accepted |
The X-ray inspection did not show obvious internal shrinkage cavities in the optimized parts. Because the overlapping cylindrical and rectangular geometry can hide small defects in a single projection, I also cut one bearing seat along a selected section. The sectioned surface showed that the shrinkage porosity at the irregular junction had essentially disappeared. This confirmed that the combination of numerical simulation and intelligent optimization was effective for this complex thin-walled stainless steel bearing seat.
Discussion
The most important finding of my work was that precision casting quality for a complex thin-walled part cannot be improved by changing only one factor. The gating system determines the filling path and feeding distance, while the process parameters determine local cooling, thermal gradients, and stress development. In my study, the combined stepped pouring system with four parts per tree gave the highest process yield, and the optimized parameters reduced the predicted shrinkage volume from 0.76 cc to 0.42 cc. The equivalent stress decreased from 459.94 MPa to 448.86 MPa. These improvements are meaningful because a lower shrinkage volume reduces internal defects, and a lower equivalent stress reduces the risk of distortion and cracking during cooling.
I also found that shell thickness had the strongest influence on both shrinkage and stress. This is consistent with the physics of precision casting: the shell acts as both a mechanical support and a thermal barrier. A thicker shell slows heat extraction, which can keep thin sections liquid longer and increase feeding demand in isolated regions. A thinner shell promotes more uniform cooling, but it must still survive handling, dewaxing, preheating, and pouring. The optimized value near 5 mm is therefore a compromise between thermal management and structural integrity.
Another important result was that the PSO-BP model predicted the process responses more accurately than a GA-BP model. The PSO algorithm found a better initial weight and bias set for the neural network, which reduced the risk of local minima. The genetic algorithm then searched the parameter space using the trained network as a fitness function. This hybrid strategy allowed me to optimize two objectives, shrinkage and stress, while respecting the physical bounds of the precision casting process. The weighted objective function gave me control over which defect was treated as more critical. Since shrinkage porosity was the main cause of rejection, I selected the weighting that gave the largest shrinkage reduction.
The experimental results supported the simulation trends. After optimization, the bearing seats showed no visible surface shrinkage, no scabs, and no cold shuts. The flatness and coaxiality checks were within the fixture requirements. The internal sectioning showed that the shrinkage at the tube-frame junction was essentially removed. This agreement between simulation and experiment is important because it shows that the numerical model captured the dominant physics of filling, solidification, and feeding in this precision casting process.
Conclusions
I optimized a complex thin-walled stainless steel bearing seat produced by precision casting. The main conclusions are as follows.
First, I analyzed the part structure and determined suitable pouring positions and ingate locations. I designed five gating systems and compared them by filling simulation, solidification simulation, defect prediction, and actual production trials. The combined stepped pouring system with four parts per tree gave the highest process yield and the best overall production stability.
Second, I used a four-factor, five-level orthogonal experiment to study pouring temperature, pouring speed, shell preheating temperature, and shell thickness. The range analysis showed that shell thickness had the greatest influence on both shrinkage volume and equivalent stress. For shrinkage volume, the influence order was shell thickness > pouring temperature > shell preheating temperature > pouring speed. For equivalent stress, the influence order was shell thickness > shell preheating temperature > pouring temperature > pouring speed.
Third, I built a BP neural network to map the precision casting parameters to the quality responses. I used PSO to optimize the initial network weights and biases, and I used GA to search for the best parameter combination. The optimized parameters were approximately 1619 °C pouring temperature, 1.53 kg·s⁻¹ pouring speed, 1148.7 °C shell preheating temperature, and 5.05 mm shell thickness. The predicted shrinkage volume decreased by 44.74%, and the equivalent stress decreased by 2.41%.
Fourth, I validated the optimized process in actual production. The bearing seats showed no visible surface shrinkage, no scabs, and no cold shuts. X-ray inspection and sectioned inspection confirmed that the internal shrinkage at the irregular junctions was essentially eliminated. The flatness and coaxiality requirements were satisfied. These results show that numerical simulation combined with intelligent optimization can improve the quality and yield of precision casting for complex thin-walled stainless steel parts.
Overall, my work demonstrates a practical route for precision casting process development: define the part and material, design the gating system, simulate filling and solidification, screen parameters with orthogonal experiments, build a nonlinear prediction model, optimize the model with a swarm algorithm, search the parameter space with a genetic algorithm, and finally verify the result through production trials. This route reduced trial-and-error cost, improved the qualified product rate, and provided a repeatable method for similar thin-walled stainless steel bearing seats and related precision casting components.