
In the field of railway freight car components, steel castings are widely used due to their stable load-bearing capacity, ease of mass production, and low manufacturing costs. Critical load-bearing parts such as bolsters, side frames, couplers, coupler yokes, and integral traction beams are typically made from steel castings. Simulation and testing are essential tools for evaluating the reliability of these steel castings, and improving their conformity accuracy can significantly enhance the design quality of steel castings. Many scholars have conducted research on the conformity accuracy between simulation and testing for railway steel castings. For instance, studies have been performed on the simulation and testing of freight car bogie bolsters and side frames, comparing and analyzing results to summarize issues in simulation processes and provide recommendations for model simplification, mesh division, and boundary condition application. To further investigate how to improve the conformity accuracy between testing and simulation for steel castings and promote their mutual validation, this article begins by identifying influencing factors, analyzing various elements in models, testing, and simulation, proposes improvement methods, and validates them on a steel casting bolster from an export car product.
When analyzing the simulation and testing processes using the “Man, Machine, Material, Method, Environment” framework, factors affecting conformity accuracy are identified. The influence of “Man” can be reduced through standardized operating procedures; “Machine” and “Environment” are external objective factors; the influence of “Material” manifests as differences between the physical casting and the design model; and the influence of “Method” refers to whether the simulation method can replicate the testing process. The primary factors are the differences between the physical object and the design model, testing details, and simulation methods.
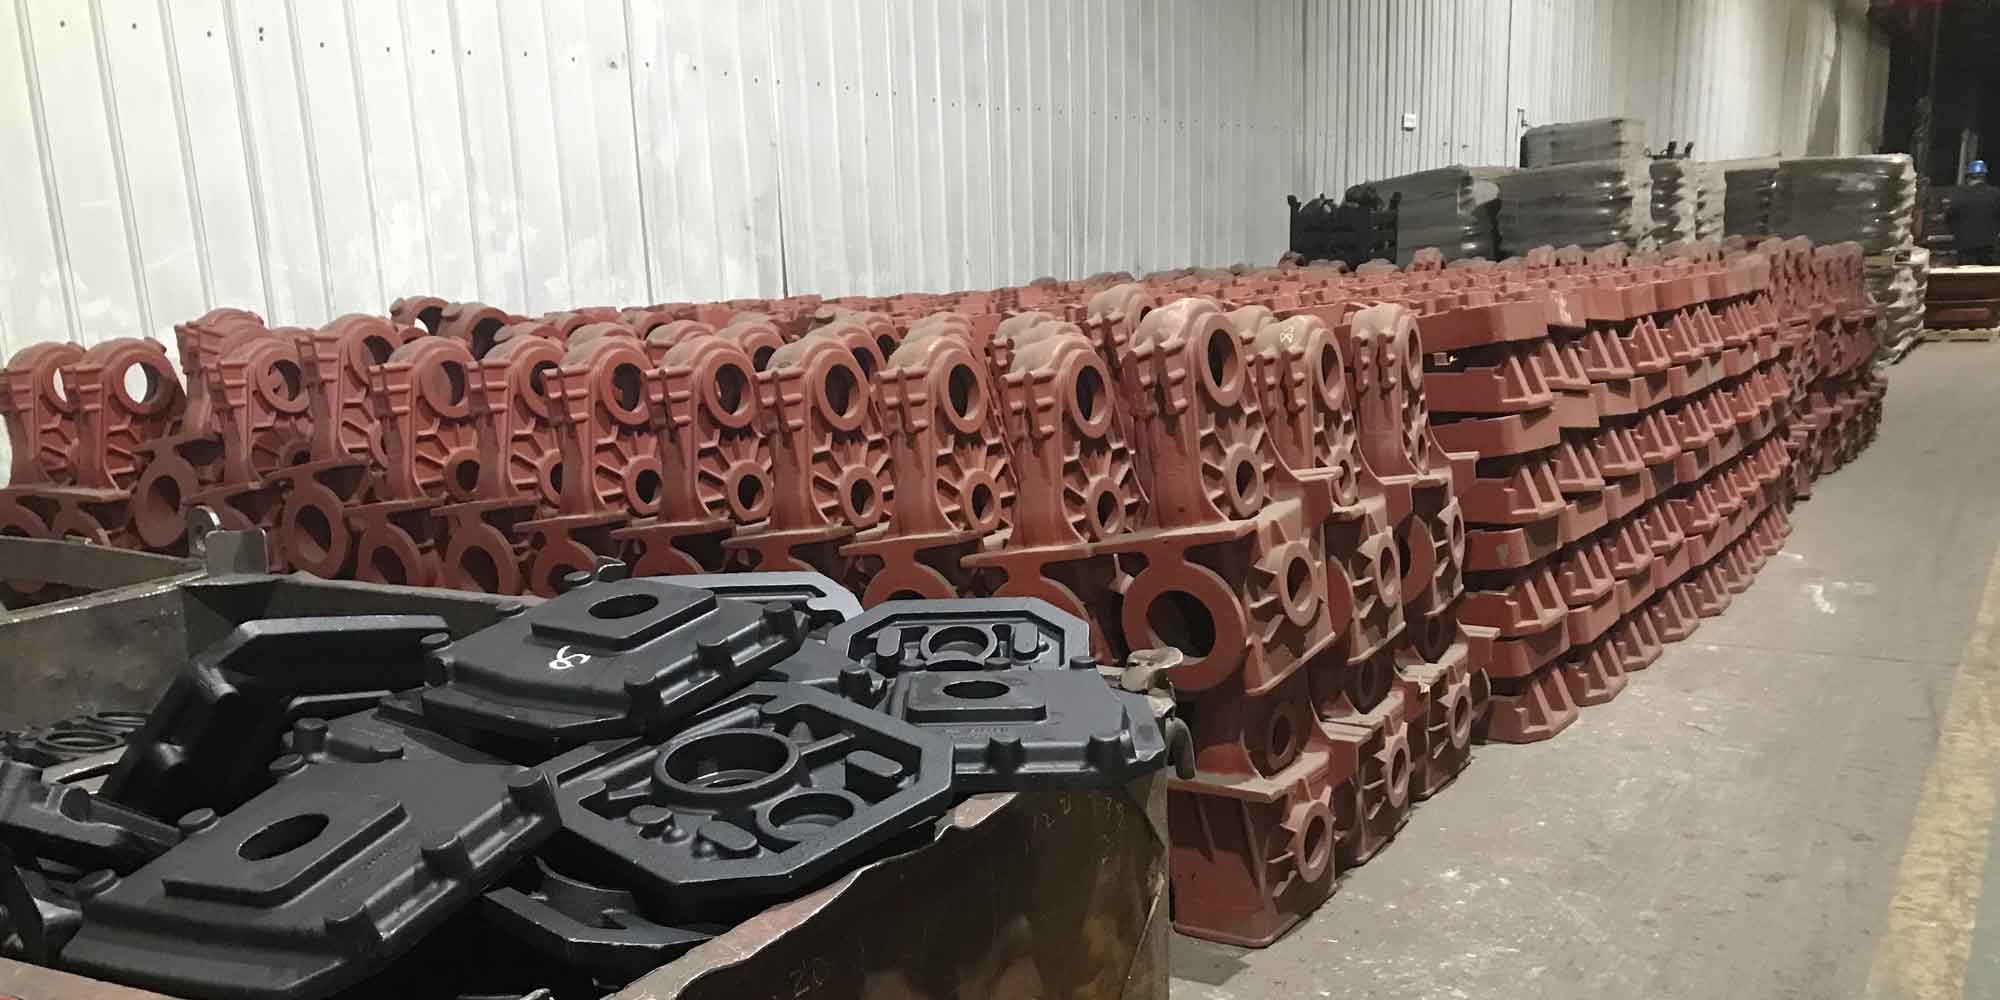
The manufacturing process of steel castings is complex, involving design, process planning, mold manufacturing, and production workshops, leading to model evolution. After completing the 3D structural design, 2D drawings are transferred to the casting process. Casting process engineers adjust parameters based on the design drawings, considering product structure characteristics, molten steel flow, and liquid metal cooling to set process parameters, determine parting surfaces, core parting surfaces, draft angles, add ribs, specify tolerance ranges, and fine-tune local shapes. They also design the gating and riser system, anti-deformation amounts, machining allowances, and material shrinkage rates to form 2D casting process drawings. Mold manufacturers convert these 2D drawings into 3D models, enlarge them according to the shrinkage rate of the steel casting material, and design and manufacture molds based on the 3D models. The foundry uses these molds for molding, core-making, assembly, melting, pouring, and cleaning to produce the first rough casting. Due to factors like sand characteristics and production conditions, the rough casting may have errors, which are checked and adjusted via line inspection. Qualified rough castings then undergo machining. Throughout this process, the physical object evolves from the design drawings, and differences arise due to comprehensive control of process, mold, and manufacturing settings, as well as material and production conditions. These differences reflect the experience of technical and production personnel at each stage.
The simulation uses the design 3D model with nominal dimensions. The 3D model from the mold manufacturing stage is closest to the physical object, only affected by material shrinkage. Using this model in simulation can reduce the gap between the physical object and the simulation object, effectively improving conformity accuracy. The dimensional deviation between the physical casting and the design model can be expressed as:
$$ \Delta D = D_{\text{physical}} – D_{\text{design}} $$
where \( \Delta D \) is the dimensional difference, \( D_{\text{physical}} \) is the measured dimension of the steel casting, and \( D_{\text{design}} \) is the nominal design dimension. For critical sections, the cumulative effect of process adjustments can be modeled as:
$$ D_{\text{physical}} = D_{\text{design}} + \sum_{i=1}^{n} \delta_i $$
Here, \( \delta_i \) represents adjustments from processes such as draft angles, shrinkage allowances, and machining. To quantify this, we can use a tolerance stack-up formula:
$$ \Delta D_{\text{total}} = \sqrt{\sum_{j=1}^{m} (\Delta d_j)^2} $$
where \( \Delta d_j \) are individual tolerance contributions. This highlights the importance of considering manufacturing variances in simulation models for steel castings.
Improving conformity accuracy also demands high-quality testing data, which should be repeatable, linear, and symmetric. Asymmetric data is a common issue that can lead to misinterpretation and affect accuracy. Key testing details causing asymmetry in steel castings include strain gauge placement, specimen positioning, and geometric tolerances.
For strain gauge placement on steel casting specimens, attention must be paid to the position, directional accuracy, and surface condition. Position and direction can be verified via marking; surface quality is ensured by grinding to remove the casting skin. If defects like pores are encountered, deeper grinding may be needed, or symmetric gauge positions must be changed. The strain measurement can be expressed as:
$$ \epsilon = \frac{\Delta L}{L_0} $$
where \( \epsilon \) is strain, \( \Delta L \) is length change, and \( L_0 \) is original length. For asymmetric cases, we define a symmetry error \( S_e \):
$$ S_e = \left| \frac{\epsilon_{\text{left}} – \epsilon_{\text{right}}}{\epsilon_{\text{avg}}} \right| \times 100\% $$
Here, \( \epsilon_{\text{left}} \) and \( \epsilon_{\text{right}} \) are strains at symmetric points, and \( \epsilon_{\text{avg}} \) is their average. A low \( S_e \) indicates good symmetry.
When positioning specimens, the relative positions among testing equipment, fixtures, and specimens must be accurate. Laser levels can assist in alignment to ensure symmetric planes coincide. For moving parts, positioning reference lines should be marked beforehand. Geometric tolerances of steel castings, such as surface flatness or parallelism, can cause local warping when placed on fixtures, leading to asymmetric data. Adjustments are needed to ensure tight contact among equipment, fixtures, and workpieces. The flatness error \( F_e \) can be defined as:
$$ F_e = \max |z_i – \bar{z}| $$
where \( z_i \) are height measurements and \( \bar{z} \) is the mean height. Compensation methods, such as using shims, can reduce this error.
| Testing Detail | Potential Issue | Improvement Method | Impact on Conformity Accuracy |
|---|---|---|---|
| Strain Gauge Placement | Position/direction errors, surface defects | Use marking for alignment, grind surface, adjust for defects | High: Directly affects stress/strain readings |
| Specimen Positioning | Misalignment of equipment, fixtures, specimen | Laser level alignment, reference lines for moving parts | Medium: Influences load distribution |
| Geometric Tolerances | Warping due to flatness/parallelism issues | Use shims (e.g., lead plates) to ensure tight contact | High: Causes asymmetric stress patterns |
Simulation models must accurately reflect the relationships among equipment, fixtures, and specimens. By analyzing the load transfer path, boundary conditions should be set correctly to replicate the effects of equipment and fixtures with appropriate simulation techniques. The correctness of simulation methods can be checked via displacement and stress trends. Simplifications that alter specimen stiffness, such as directly applying loads and constraints on the specimen, should be avoided. Fixtures in contact with the specimen need to be modeled to reflect their actual impact on local stress distribution, with reasonable contact friction coefficients and nonlinear solution methods.
Correct material parameters must be selected for steel castings. Standards specify elastic moduli for steel castings: TB 1335 recommends 172 GPa, TB 3548 recommends 200 GPa, and GB 50017-2003 recommends 206 GPa. From physical sampling and tensile tests of steel castings, the measured elastic modulus is approximately 200 GPa. In simulation models, an elastic modulus of 200 GPa is recommended for steel castings. Discrete elements should be 6 mm hexahedral elements or 8–12 mm ten-node tetrahedral elements. The stress-strain relationship follows Hooke’s law:
$$ \sigma = E \epsilon $$
where \( \sigma \) is stress, \( E \) is elastic modulus, and \( \epsilon \) is strain. For contact simulations, the friction force \( F_f \) is given by:
$$ F_f = \mu F_n $$
where \( \mu \) is the friction coefficient and \( F_n \) is the normal force. In nonlinear analyses, the equilibrium equation is:
$$ \mathbf{K}(\mathbf{u}) \mathbf{u} = \mathbf{F} $$
with \( \mathbf{K} \) as the stiffness matrix, \( \mathbf{u} \) as displacement vector, and \( \mathbf{F} \) as force vector. These formulations ensure accurate simulation of steel casting behavior.
To validate the improvement methods, a vertical load case study was conducted on a steel casting bolster from an export car product. The effects of physical object variations were studied, and testing details and simulation methods were refined.
Industrial CT scanning technology was used to measure internal structural dimensions of the steel casting product. Key cross-sections of the bolster were scanned to compare with design drawings. Differences were observed: the lower wall thickness was greater than nominal, the upper wall thickness was less, side wall thicknesses were slightly less, process ribs were added inside side walls and bottom walls, internal ribs had noticeable draft angles with thicknesses greater than nominal, and the weight was 10 kg heavier than specified. Based on CT results, a digital model of the sample was created. Comparing simulations of the sample digital model and the design digital model under vertical load on the center plate: displacement differences were 3% (sample model slightly lower), and stress differences at key locations averaged 8.9% (sample model slightly lower). This confirms the impact of physical variations on simulation results for steel castings.
In static testing, asymmetric strain occurred at symmetric A-locations on the bolster due to spring seat warping. Flatness and parallelism of spring seat surfaces relative to the center plate mounting surface were measured. Standards like AAR M-210 specify spring seat flatness should not exceed 3.175 mm, and TB 3012 specifies flatness ≤3.5 mm and parallelism ≤3-4 mm. Measurements showed compliance, but as spring seats are critical constraint locations, contact conditions with fixtures directly affect nearby stress magnitude and distribution. Tight contact areas have higher stress, while loose areas have lower stress. Using lead plates of varying thicknesses for adjustment improved symmetry. This illustrates that even within design standards, steel castings may require local adjustments during testing for optimal results.
The static test used a 5000 kN four-column pressure testing machine with a base platform, bottom loading cylinder, and top fixed plate. The bolster test fixture included a fixture base, rotating shaft, pads, lead plates, and loading center plate. The simulation model replicated this setup, as summarized below:
| Test Equipment/Fixture | Function | Simulation Implementation |
|---|---|---|
| Loading Center Plate | Transfer load | Model center plate, apply contact |
| Lead Plates | Adjust fixture-specimen gap | Contact friction coefficient |
| Fixture Base, Pads | Transfer load | Constraint elements |
| Rotating Shaft | Allow rotation about horizontal axis | Release rotational degrees of freedom |
| Base Platform | Transfer load | — |
| Bottom Cylinder | Apply load | Apply upward vertical force at center node of constraint elements |
| Top Fixed Plate | Limit displacement | Apply vertical displacement constraint on entire plane of center plate |
The simulation setup ensured accurate load transfer and boundary conditions for the steel casting bolster. The contact analysis used a penalty method with friction coefficient \( \mu = 0.2 \). The mesh consisted of 8 mm tetrahedral elements, with refinement near critical areas. The material model was linear elastic with \( E = 200 \) GPa and Poisson’s ratio \( \nu = 0.3 \). The vertical load \( F_v \) was applied incrementally:
$$ F_v = 5000 \text{ kN} \times \frac{t}{t_{\text{total}}} $$
where \( t \) is time step and \( t_{\text{total}} \) is total time. This quasi-static approach replicated the test loading rate.
Using improved testing and simulation methods, conformity was validated on the bolster product. Ninety-nine strain gauges were placed on locations like the lower wall center, lower wall A-locations, and central holes. With the design model simulation, displacement conformity reached 95%, and stress relative error percentages followed a normal distribution with mean 9.6% and standard deviation 2.8%, yielding an accuracy of 90.4%. Considering physical vs. design model differences, this conformity is satisfactory, proving the methods effective for steel castings.
Further analysis can be done by defining a conformity index \( C_i \):
$$ C_i = 1 – \frac{1}{n} \sum_{k=1}^{n} \frac{|\sigma_{\text{sim},k} – \sigma_{\text{test},k}|}{\sigma_{\text{test},k}} $$
where \( n \) is number of measurement points, \( \sigma_{\text{sim}} \) is simulated stress, and \( \sigma_{\text{test}} \) is tested stress. For this case, \( C_i \approx 0.904 \). To generalize for steel castings, we can relate accuracy to factors like model fidelity \( M_f \), testing control \( T_c \), and simulation precision \( S_p \):
$$ C_i = \alpha M_f + \beta T_c + \gamma S_p $$
with \( \alpha, \beta, \gamma \) as weighting coefficients. From our study, \( M_f \) (using CT-based models) contributed ~5% improvement, \( T_c \) (lead plate adjustments) ~3%, and \( S_p \) (fixture modeling) ~2%.
In conclusion, through research on conformity accuracy between simulation and testing for large steel castings in railway freight cars, we find that specimen characteristics, testing details, and simulation methods have the greatest impact. Steel castings undergo complex processes, and physical dimensions reflect comprehensive control of process and manufacturing factors, differing from design models. Statistical patterns can inform design. In model evolution, the mold 3D model is closest to the physical object and should be considered in simulation workflows for better results. Accurate simulation representation of test setups is key to improving conformity accuracy, and testing operational details must be strictly controlled to ensure data reliability. This methodology has been validated on steel casting bolster products and offers solutions for similar issues with other large steel castings in railway freight cars. Future work could involve automated CT scanning integration into simulation pipelines and machine learning for predictive accuracy adjustments. Steel castings will continue to be vital in railway applications, and enhancing test-simulation conformity will drive innovation in their design and manufacturing.