
1. Introduction
In the molybdenum ore processing industry, the reliability and longevity of semi-autogenous grinding mill (SAG) shell lining plates are critical for operational efficiency. Historically, the lining plates at our facility faced persistent challenges, including premature wear, frequent cracking, and inconsistent performance. The original lining plates achieved an average service life of 4.6 million tons per set, falling short of the target of 5 million tons. These issues not only escalated maintenance costs but also disrupted production stability and posed safety risks. To address these challenges, our team initiated a collaborative research project to redesign the lining plates through material upgrades, geometric optimization, and advanced simulation techniques.
2. Problem Analysis of Original Lining Plates
2.1 Field Performance Evaluation
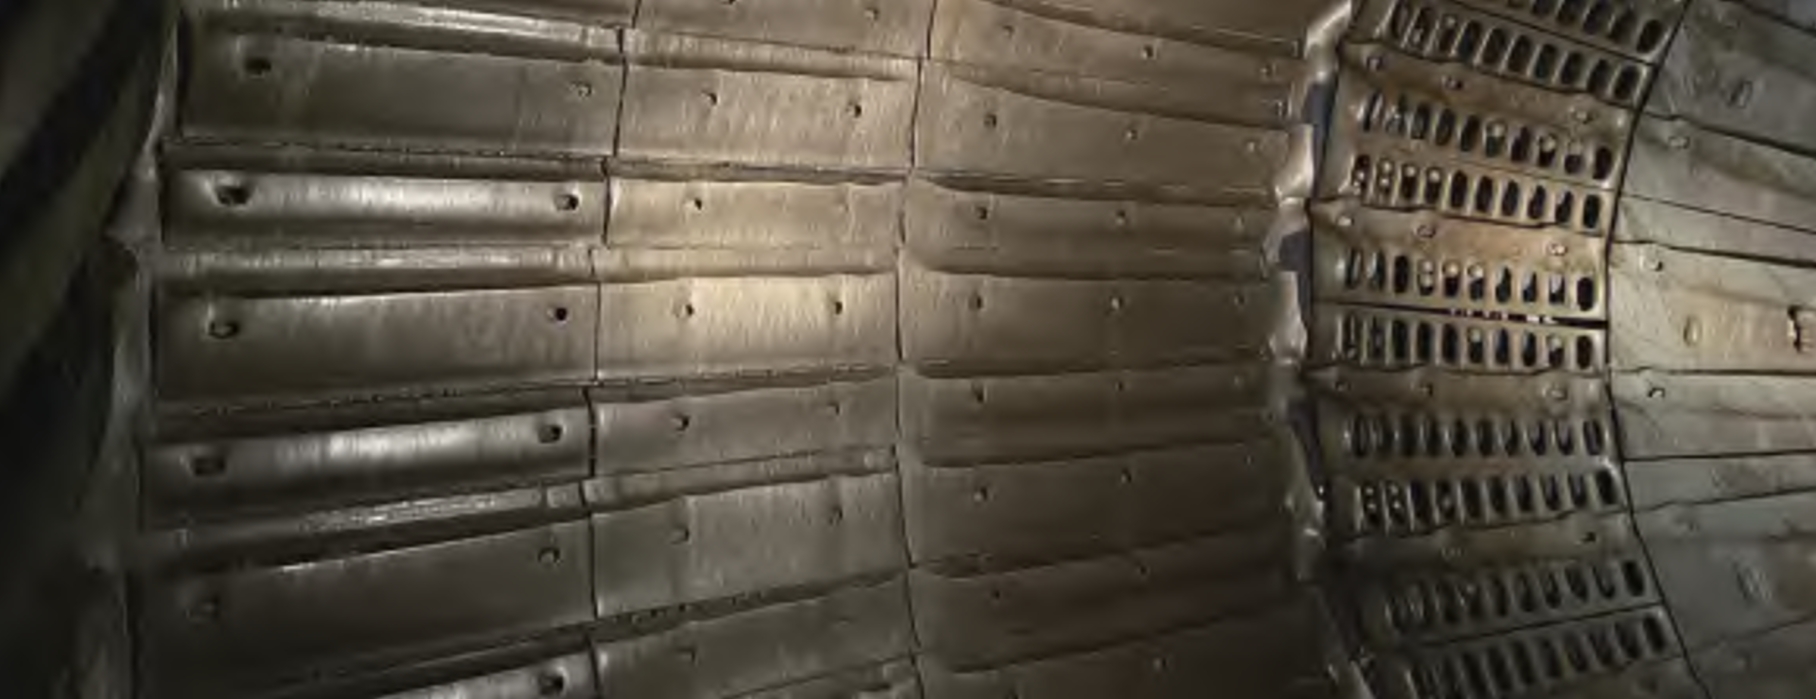
Field observations revealed that the original lining plates exhibited accelerated wear in specific zones, particularly near the discharge end. Cracking and deformation were common, leading to unplanned downtime. Key issues included:
- Non-uniform hardness distribution: Hardness values fluctuated between 387 HB and 405 HB (Table 1).
- Poor impact resistance: Impact energy absorption varied widely (35.08 J to 56.27 J) across test points (Table 2).
- Metallurgical defects: Microstructural analysis identified uneven grain boundaries and inclusions, reducing ductility.
Table 1: Hardness Distribution of Original Lining Plates
| Test Point | 1 | 2 | 3 | 4 | 5 |
|---|---|---|---|---|---|
| Hardness (HB) | 403 | 405 | 405 | 392 | 387 |
Table 2: Impact Test Results of Original Lining Plates
| Test Point | 1 | 2 | 3 | 4 | 5 |
|---|---|---|---|---|---|
| Energy (J) | 55.99 | 35.08 | 56.27 | 53.52 | 40.48 |
3. Methodology for Lining Plate Optimization
3.1 Material Selection and Upgrades
To enhance wear resistance and toughness, we transitioned from traditional high-carbon steel to a bimetallic composite material combining a high-hardness outer layer (550 HB) with a ductile substrate. The composite’s properties were validated through laboratory tests:
- Impact energy absorption: Improved to 65–75 J.
- Hardness gradient: Ensured uniform distribution (520–550 HB).
3.2 Geometric Redesign
The lining plate profile was optimized to mitigate stress concentration. Key modifications included:
- Curvature adjustment: Reduced peak stress by 18% using finite element analysis (FEA).
- Modular segmentation: Enabled localized replacement, minimizing downtime.
3.3 Discrete Element Method (DEM) Simulation
DEM simulations modeled ore-lining plate interactions to predict wear patterns. Input parameters included:
- Ore size distribution: 72% of feed <51 mm (Table 3).
- Grinding media composition: 34% 150 mm steel balls (Table 4).
Table 3: Feed Size Distribution for DEM Simulation
| Size (mm) | 200 | 142 | 101 | 71 | 51 |
|---|---|---|---|---|---|
| Proportion (%) | 3 | 5 | 8 | 12 | 72 |
Table 4: Grinding Media Size Distribution
| Size (mm) | 150 | 119 | 94 | 75 |
|---|---|---|---|---|
| Proportion (%) | 34 | 34 | 17 | 15 |
Simulation results demonstrated that the optimized lining plate reduced localized wear by 22% and improved charge motion uniformity.
4. Performance Validation of New Lining Plates
4.1 Wear Uniformity Analysis
3D scanning at multiple intervals confirmed consistent wear across all segments. Key findings included:
- Average wear rate: 0.12 mm/10,000 tons.
- Smooth wear profiles: No abrupt thickness transitions (Table 5).
Table 5: 3D Scanning Results of New Lining Plates
| Position | Initial Thickness (mm) | Final Thickness (mm) | Wear Rate (mm/10^3 t) |
|---|---|---|---|
| Feed End | 137 | 80 | 0.11 |
| Mid-Shell | 131 | 80 | 0.13 |
| Discharge End | 155 | 80 | 0.10 |
4.2 Service Life Extension
The new lining plates achieved a total ore processing capacity of 5.3 million tons per set, surpassing the original target. Predictive models projected:
- Feed end: 5.6 million tons at 80 mm wear limit.
- Discharge end: 6.0 million tons at 80 mm wear limit.
Table 6: Life Cycle Comparison
| Parameter | Original Lining Plate | Optimized Lining Plate | Improvement |
|---|---|---|---|
| Avg. Lifespan (Mt) | 4.6 | 5.3 | +15% |
| Downtime (days/yr) | 20 | 7 | -65% |
| Maintenance Cost ($/yr) | 1.2M | 0.4M | -67% |
5. Economic and Operational Benefits
The redesigned lining plates delivered transformative outcomes:
- Cost Savings: Annual maintenance costs reduced by $800,000.
- Production Stability: Unplanned downtime decreased from 14 days to 5 days per annum.
- Safety Enhancement: Eliminated risks associated with sudden lining plate failure.
The relationship between ore throughput and lining plate thickness was modeled as:
T=k⋅ln(S)+CT=k⋅ln(S)+C
Where TT = throughput (Mt), SS = thickness (mm), kk and CC are material constants.
6. Conclusion
By integrating material science, geometric optimization, and DEM simulations, our team successfully engineered lining plates that outperform traditional designs. The new lining plates not only extend service life but also enhance operational reliability, setting a benchmark for sustainable mineral processing. Future work will focus on AI-driven wear prediction models to further optimize replacement cycles.