
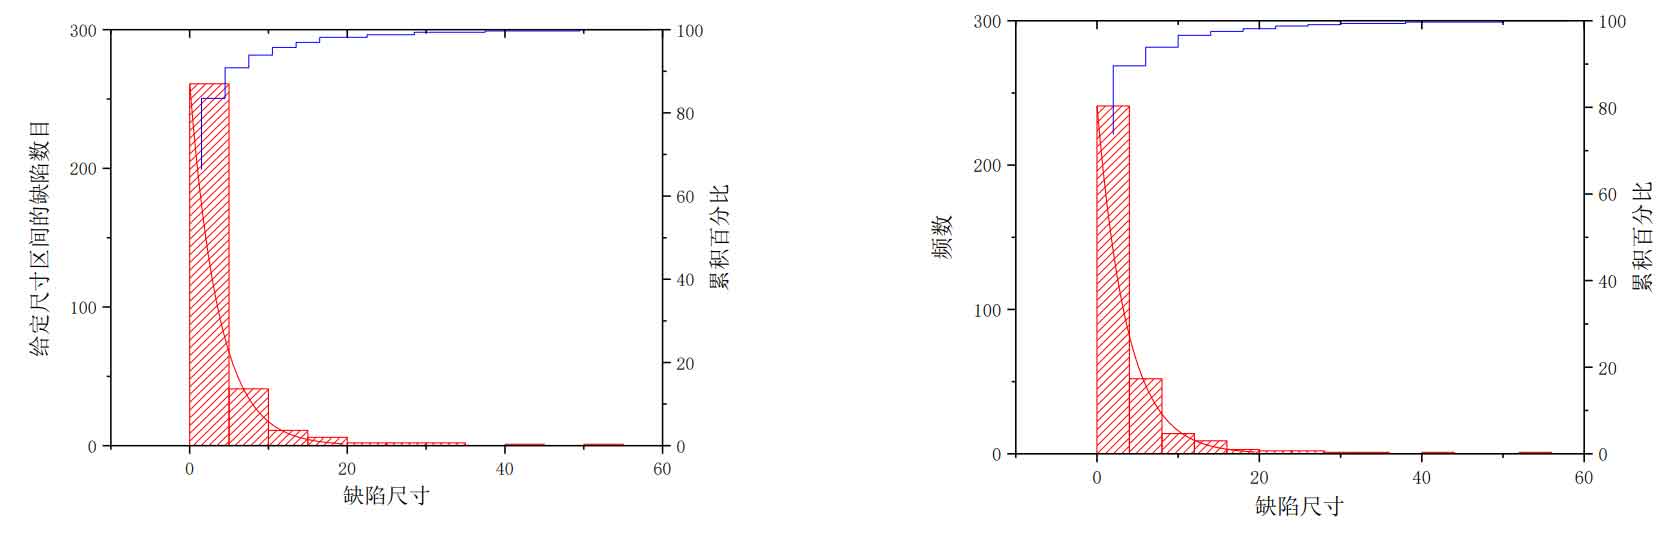
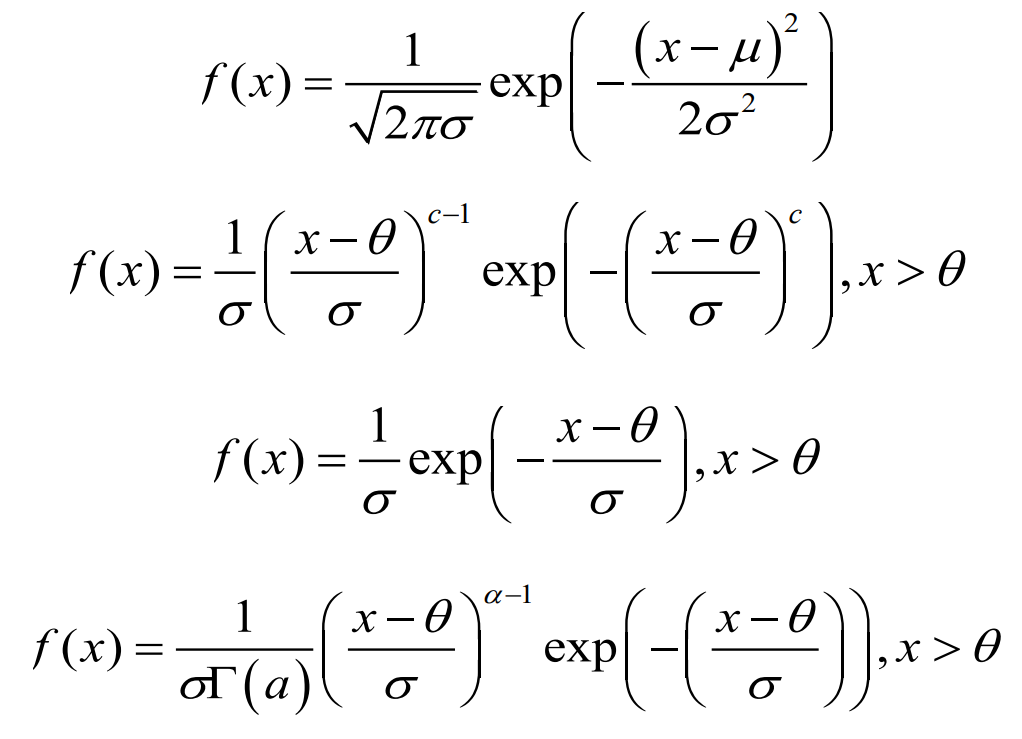
As shown in the table, the frequency statistics of casting defect size can be obtained by summarizing the sizes of all casting defects.
| Casting defect size range | Number of casting defects |
| 0-5 | 261 |
| 5-10 | 41 |
| 10-15 | 11 |
| 15-20 | 6 |
| 20-25 | 2 |
| 25-30 | 2 |
| 30-35 | 2 |
| 35-40 | 0 |
| 40-45 | 1 |
| 50-55 | 0 |
| 55-60 | 1 |
The frequency distribution histogram and frequency distribution histogram of casting defect length samples can be obtained by using the data statistics table, as shown in the figure. There are 302 casting defects less than 10mm, accounting for 89.61% of all casting defects, which shows that the total number of casting defects with smaller size is much more than that with larger size. With the increase of casting defect size, the number of casting defects exceeding this size always decreases monotonously. Small size casting defects are the main casting defects in cast steel joints. Since there is little difference between the frequency histogram with group spacing of 5 and 4, it is advisable to use the frequency histogram with group spacing of 4 to draw the probability distribution diagram, and then obtain the probability density distribution of casting defect length, because if the data comes from a population with probability density, the center line of the histogram with frequency divided by group spacing can be used as the estimation of the overall probability density.
The premise of reliability calculation is to determine the distribution law of casting defects. Before that, the distribution function of casting defect length must be determined. Because the real distribution is unknown, the empirical distribution must be used for fitting. As shown in the formula, the commonly used distribution types include normal distribution, Weibull distribution, exponential distribution, gamma distribution, etc.
Various corrosion defects and welding defects are studied. It is found that the size of defects obey exponential distribution, lognormal distribution and normal distribution. Scholars in various countries mostly make artificial assumptions about the distribution of casting defects. By observing the histogram, it is found that the curve trend is close to the exponential distribution. Therefore, it may be assumed that the casting defect size of the cast steel joint obeys exponential distribution. The parameters are estimated first, and then the test of distribution fitting is carried out.