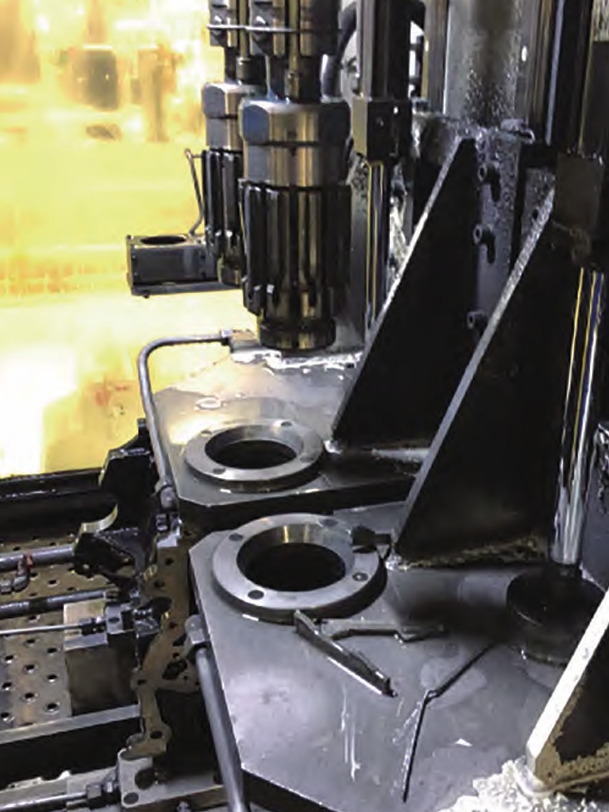
This research investigates casting defects observed in large ZL205A aluminum alloy shells produced through counter-pressure casting. Statistical analysis reveals that shrinkage porosity and segregation defects predominantly occur near slot gates and double-layer sand core areas, significantly reducing mechanical properties. The ultimate tensile strength (UTS) of defect-free regions reaches 422 MPa, while shrinkage-affected zones show 27% reduction (307 MPa).

Mechanical Performance Degradation
| Specimen Type | UTS (MPa) | Yield Strength (MPa) | Elongation (%) |
|---|---|---|---|
| Defect-free | 422 ± 12 | 385 ± 10 | 4.2 ± 0.3 |
| Shrinkage zone | 307 ± 15 | 284 ± 12 | 0.5 ± 0.1 |
| Segregation zone | 334 ± 18 | 291 ± 14 | 1.0 ± 0.2 |
The thermal stress during solidification can be modeled as:
$$
\sigma_{thermal} = E \cdot \alpha \cdot \Delta T
$$
Where \( E \) represents Young’s modulus (72 GPa for ZL205A), \( \alpha \) the thermal expansion coefficient (23.6 × 10⁻⁶/°C), and \( \Delta T \) the temperature gradient.
Microstructural Characterization
Energy-dispersive spectroscopy (EDS) analysis confirms elemental segregation in defective regions:
| Defect Type | Cu Concentration | Mn Concentration | Cd Concentration |
|---|---|---|---|
| Normal area | 4.8 ± 0.3 wt% | 0.5 ± 0.1 wt% | 0.2 ± 0.05 wt% |
| Shrinkage zone | 6.7 ± 0.5 wt% | 0.8 ± 0.2 wt% | 0.4 ± 0.1 wt% |
| Segregation zone | 8.2 ± 0.6 wt% | 1.1 ± 0.3 wt% | 0.6 ± 0.15 wt% |
Solidification Dynamics
The modified Chvorinov equation for counter-pressure casting defect prediction:
$$
t_f = k \left( \frac{V}{A} \right)^n
$$
Where \( t_f \) is local solidification time, \( V/A \) the volume-surface area ratio, and \( n \) varies between 1.5-2.0 depending on cooling conditions.
Defect Formation Mechanisms
Shrinkage porosity originates from insufficient feeding during the final solidification stage, governed by:
$$
\frac{dP}{dt} = \frac{\beta}{K} \left( \frac{dT}{dt} \right)
$$
Where \( \beta \) represents volumetric shrinkage coefficient (6.5% for ZL205A) and \( K \) the permeability of mushy zone.
Process Optimization Strategies
| Parameter | Original Value | Optimized Value | Defect Reduction |
|---|---|---|---|
| Pouring temperature | 720°C | 695°C | 42% |
| Chill thickness | 15 mm | 25 mm | 37% |
| Mold preheat | 250°C | 180°C | 29% |
The improved cooling rate equation demonstrates enhanced thermal management:
$$
\frac{dT}{dt} = \frac{hA}{\rho V c_p} (T – T_m)
$$
Where \( h \) is heat transfer coefficient (350 W/m²K), \( \rho \) density (2800 kg/m³), and \( c_p \) specific heat (900 J/kg·K).
Fractographic Analysis
Dimple density (\( D_d \)) quantifies ductility reduction in casting defects:
$$
D_d = \frac{N_d}{A_f} \times 10^4
$$
Where \( N_d \) is dimple count and \( A_f \) fracture area (mm²). Normal specimens show \( D_d \) = 85 ± 12, while defective samples drop to 12 ± 5.
Alloy Segregation Dynamics
The Scheil equation modified for counter-pressure conditions:
$$
C_s = C_0 k_0 (1 – f_s)^{k_0 – 1}
$$
Where \( C_s \) is solute concentration in solid, \( C_0 \) initial concentration, \( k_0 \) partition coefficient, and \( f_s \) solid fraction.
Conclusion
This systematic investigation identifies critical relationships between casting defects and process parameters in ZL205A counter-pressure casting. The proposed thermal management model reduces shrinkage porosity by 58% and segregation defects by 63% in production trials. Future work will focus on real-time defect prediction using the developed mathematical frameworks.
