Based on the experimental results, a second-order response surface model was constructed and the regression model was tested. The results are shown in the table. For a good model, the multiple decision coefficient R2 should not be less than 0.8, and the closer R2 is to 1, the better the data fitting effect. However, when adding variables, R2 increases, so it is usually used to test the correlation between the adjusted R2adj data and the fitted curve. The R2 of the model is 0.9651, and the R2adj is 0.9245, indicating a good agreement between the predicted model and the actual values. The coefficient of variation (CV) is 3.16%, indicating a low deviation between the predicted value and the experimental value, indicating high reliability during the experiment.
| R^2 | R^2adj | Root mean square error | Response mean | Coefficient of variation | Observations |
| 0.9651 | 0.9245 | 0.0113 | 0.3574 | 3.15% | 27 |
The P-value and F-value reflect the degree of influence of each factor on the indicator. A P value less than 0.05 indicates that the factor has a significant impact on the indicator, while a P value less than 0.01 indicates that the factor is highly significant. The larger the F value, the greater the degree of influence of this factor. For shrinkage porosity casting defects, the preheating temperature of the upper mold, the preheating temperature of the side mold, the preheating temperature of the lower mold, and the pouring temperature are all highly significant factors. The order of influence from large to small is: preheating temperature of mold on side B>preheating temperature of mold on side A>pouring temperature of mold on side D>preheating temperature of mold on side C.
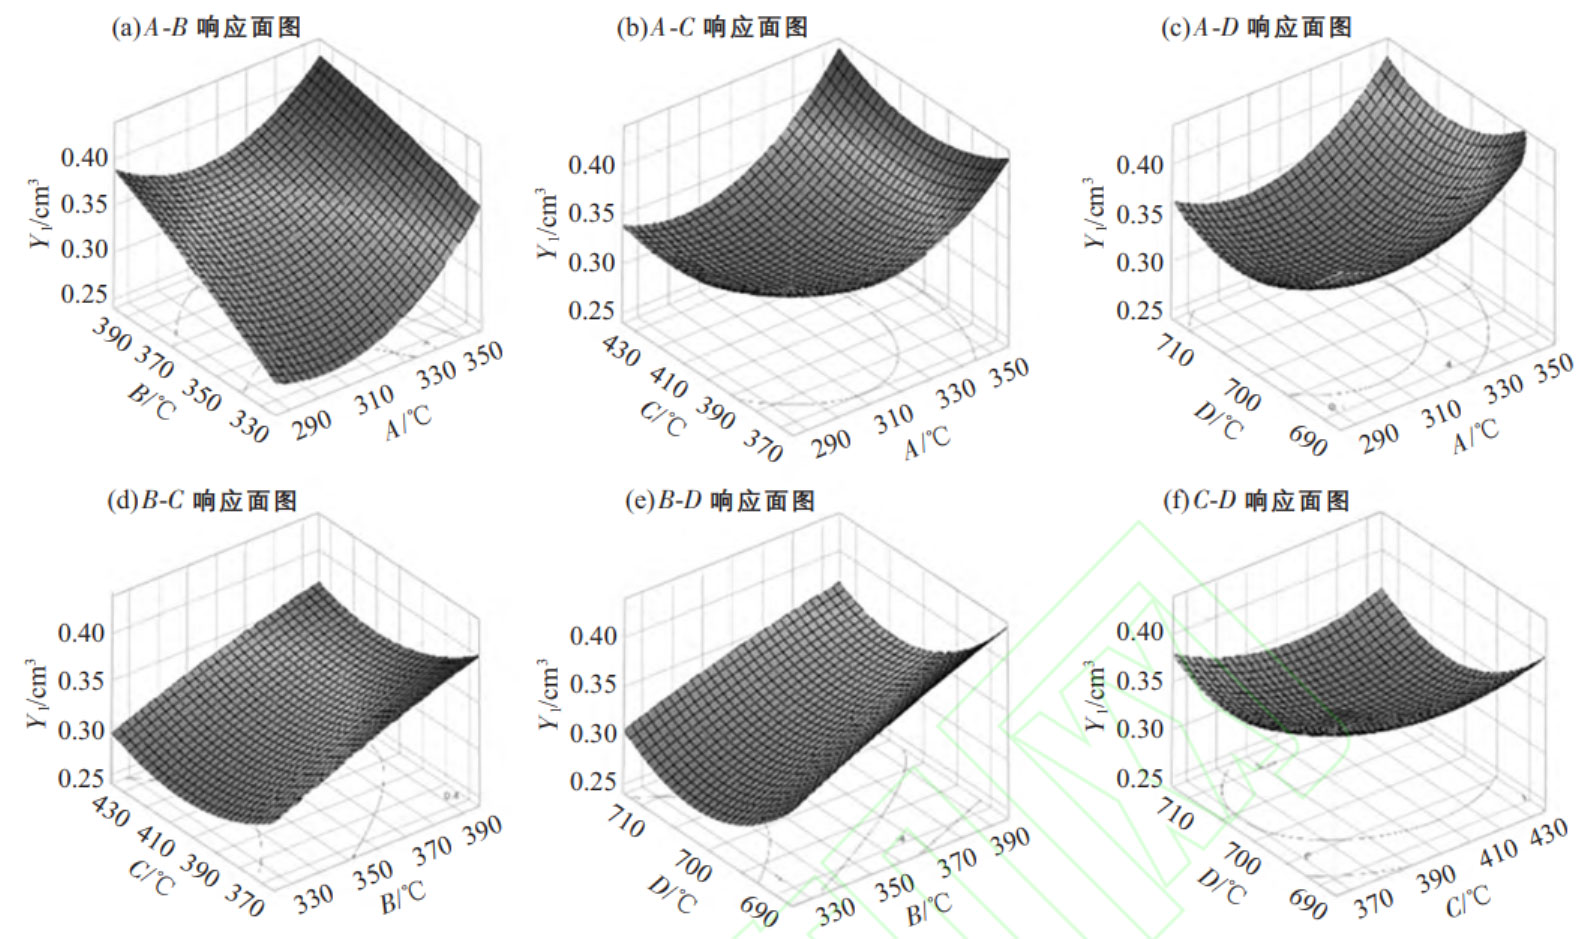
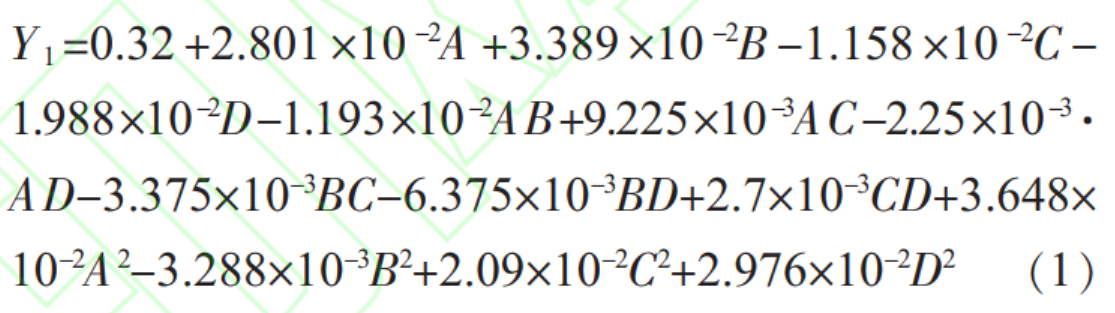
The figure shows the effect of the interaction of two factors on the response index Y1 (shrinkage porosity casting defect volume). The volume of shrinkage porosity casting defects decreases with the decrease of preheating temperature of the side mold, and then increases with the decrease of preheating temperature of the upper mold, lower mold, and pouring temperature. The preheating temperature of the upper mold and the preheating temperature of the side mold have the greatest impact with temperature changes. The increase in mold temperature and pouring temperature will enhance the fluidity of the molten metal, enhance the feeding ability, and reduce the volume of shrinkage and porosity casting defects. However, if the overall temperature is too high and the metal liquid is heavily aspirated, it will increase the tendency for shrinkage porosity, and the volume of shrinkage porosity casting defects will also increase. Therefore, it is necessary to control the pouring temperature and mold temperature within a reasonable range. The final response regression prediction model is as follows: