Abstract
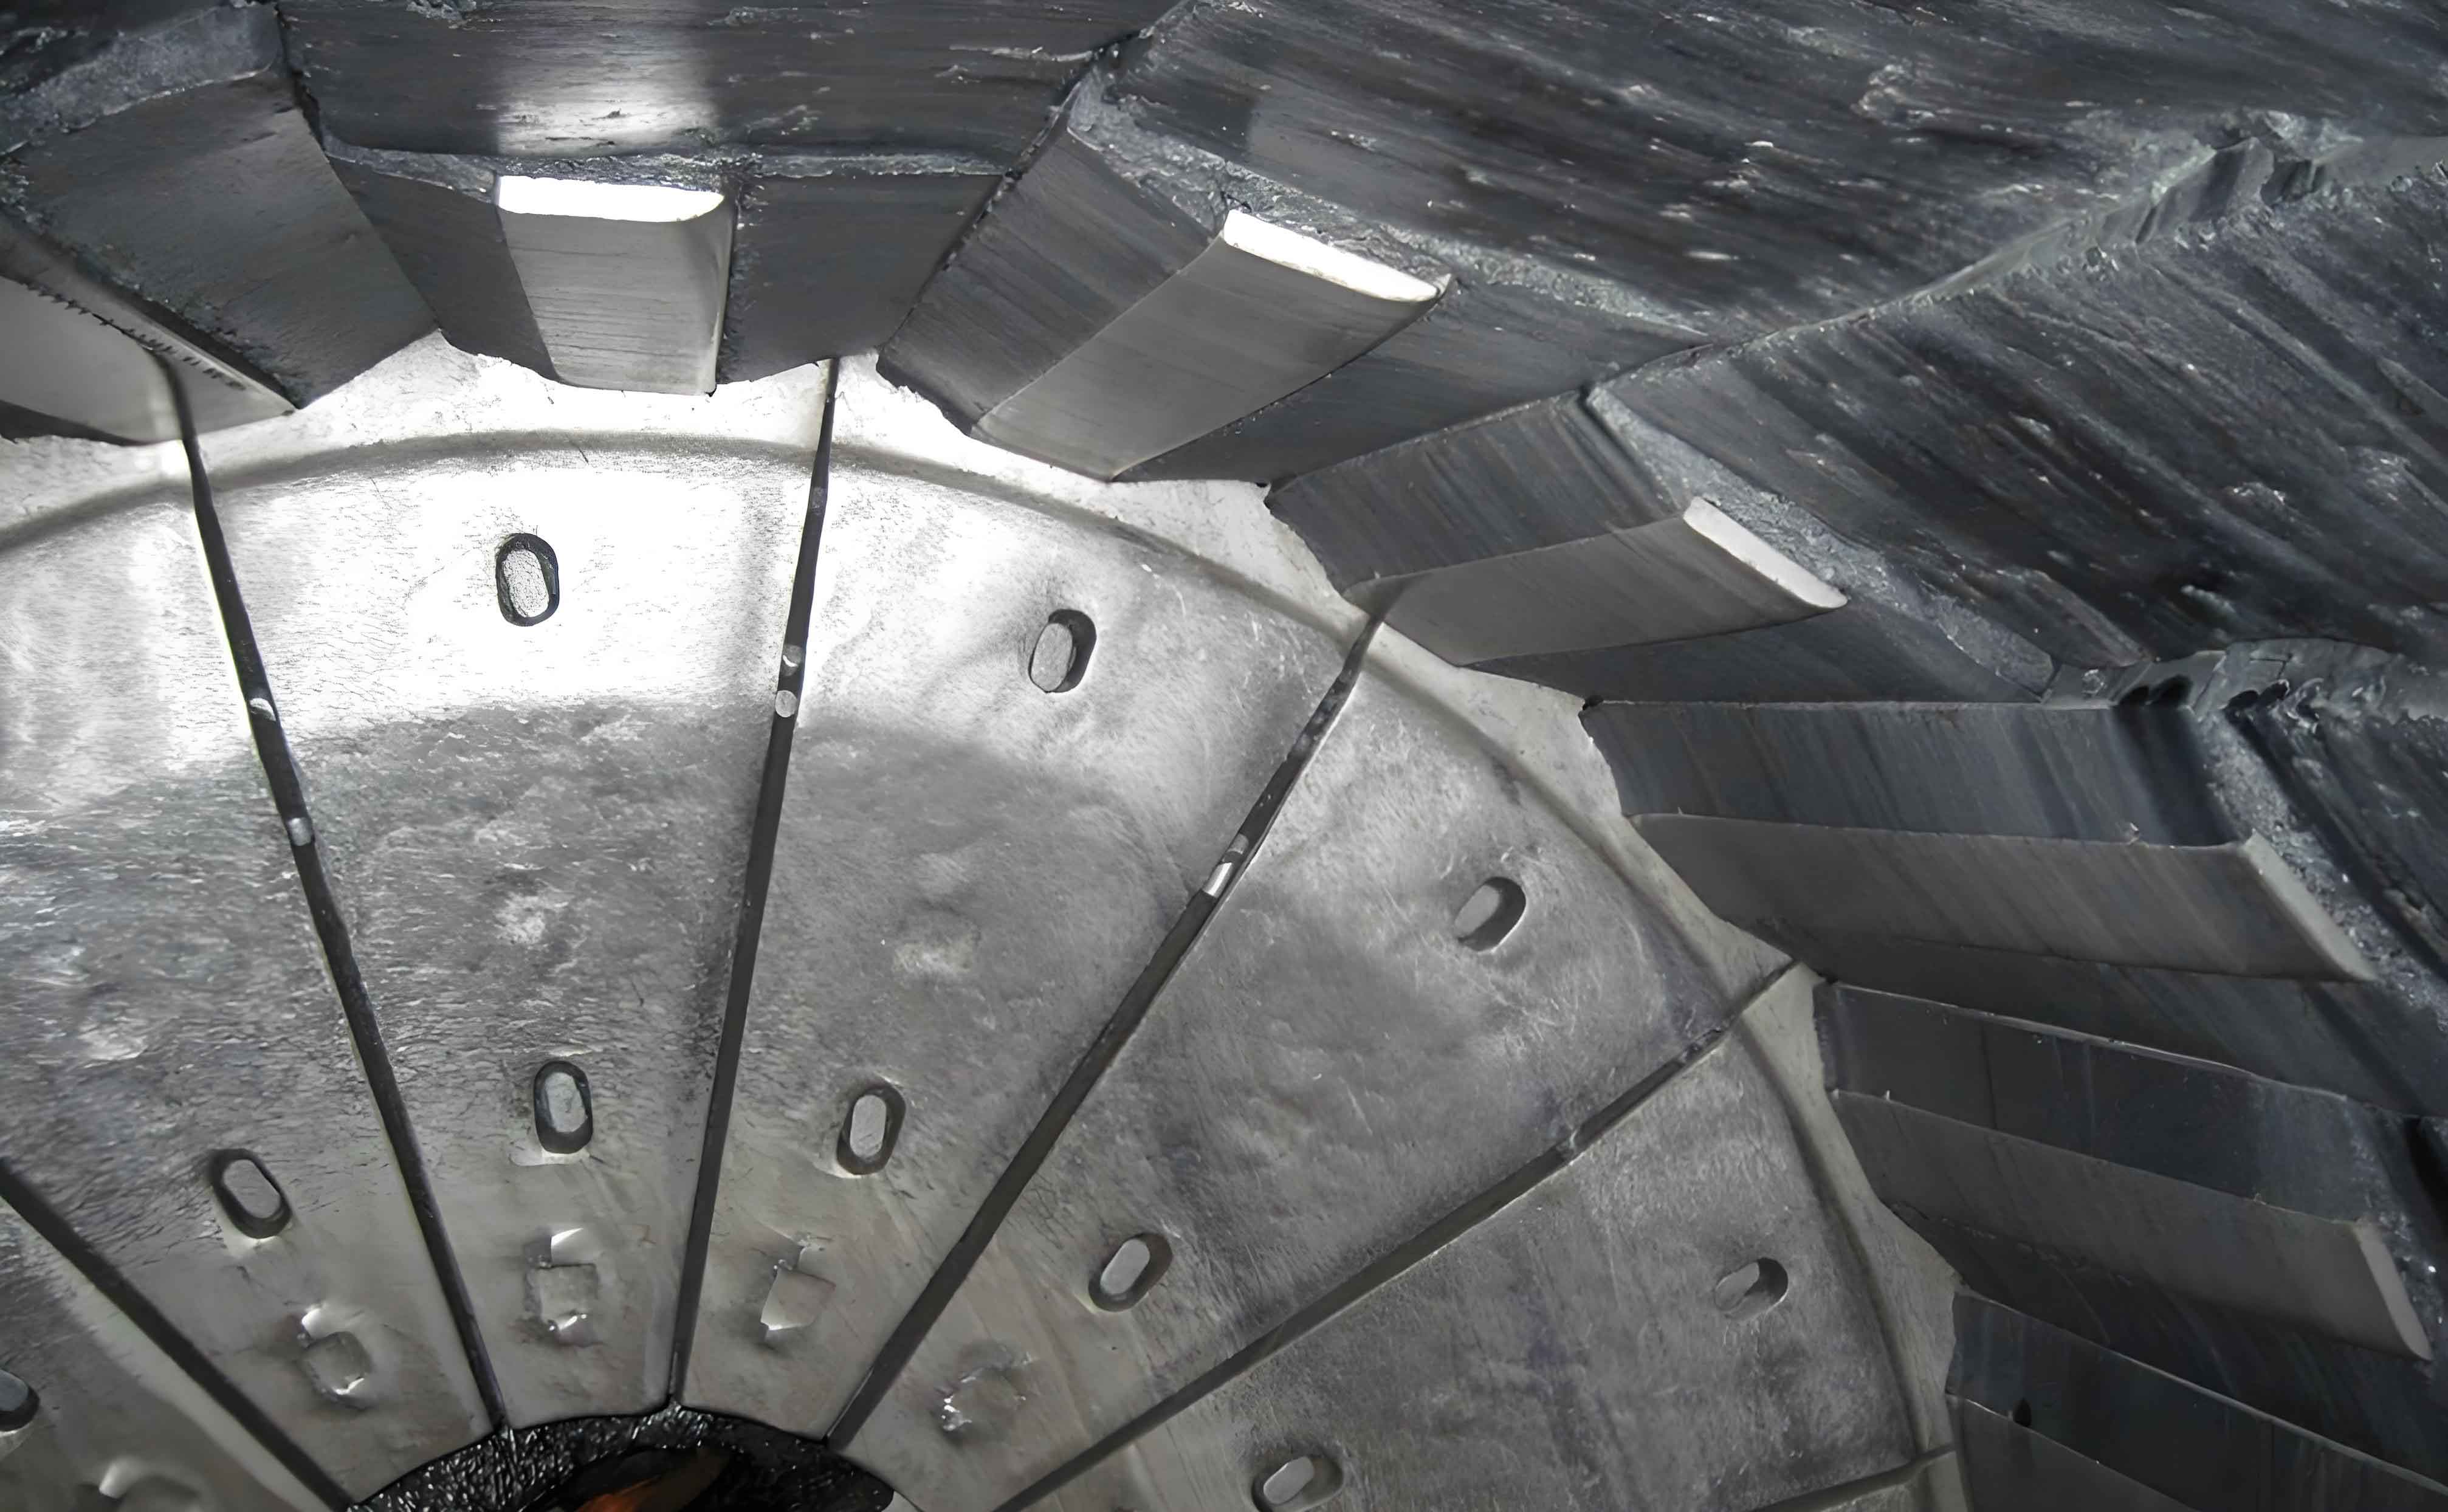
The lining plates of cone crushers, as the most severely worn components, directly interact with ore materials, replacing critical parts such as dynamic and fixed cones. Studying the wear distribution characteristics of lining plates holds theoretical significance for optimizing crusher chamber designs and selecting wear-resistant materials. This research focuses on the CC100 single-cylinder cone crusher at a beneficiation plant in Jiangxi Province. Through theoretical modeling, experimental validation, and EDEM-based simulations, the wear mechanisms (compression and cutting wear) were analyzed, and predictive models were established. Key parameters influencing wear—such as main shaft speed, feed particle size, and precession angle—were investigated. Results indicate that wear rates increase with larger feed sizes and precession angles, while optimal shaft speeds enhance wear uniformity. This study provides foundational insights for designing durable lining plates and improving crusher efficiency.

1. Introduction
1.1 Background and Significance
Cone crushers are pivotal in mineral processing, where lining plates endure extreme abrasive forces. Their wear directly impacts crusher performance, product quality, and operational costs. Traditional methods for assessing lining plate wear rely on empirical observations, which lack precision. This study addresses this gap by developing quantitative models to predict wear distribution and optimize crusher parameters.
1.2 Research Objectives
- Analyze wear mechanisms (compression vs. cutting wear) of lining plates.
- Establish predictive models for wear rates using experimental and simulation data.
- Investigate how operational parameters (e.g., shaft speed, feed size) influence wear uniformity.
2. Literature Review
2.1 Wear Mechanisms in Crushers
Studies by Archard (1953) and Lindqvist (2003) laid the groundwork for understanding abrasive wear. Key findings include:
- Compression wear correlates with contact pressure and particle size.
- Cutting wear depends on sliding distance and tangential forces.
2.2 Advances in Wear Modeling
Recent works integrate discrete element method (DEM) simulations (Cleary, 2001) and experimental validations to predict lining plate wear. For instance, EDEM-based models (Franke, 2015) effectively capture particle-liner interactions.
3. Methodology

3.1 Theoretical Modeling
3.1.1 Crushing Chamber Stratification
The crushing chamber was divided into layers based on ore motion dynamics. Stratification height HH is derived from free-fall kinematics:H=12g(30N)2H=21g(N30)2
where NN = main shaft speed (rpm).
3.1.2 Wear Models
- Compression Wear:
Δω2=∑i=1mcidiPK2Δω2=i=1∑mcidiK2P
- Cutting Wear:
Δω1=K1∫0tP⋅v dtΔω1=K1∫0tP⋅vdt
3.2 Experimental Design
3.2.1 Compression Force Experiments
A universal testing machine measured crushing forces under varying compression ratios (εε) and particle size distributions (σσ). Results were fitted to:P=exp(7.56ε+0.43σ+0.021)P=exp(7.56ε+0.43σ+0.021)
Table 1: Compression Force vs. Particle Size
| Compression Ratio (εε) | Particle Size (σσ) | Crushing Force (MPa) |
|---|---|---|
| 0.05 | 0.12 | 1.57 |
| 0.30 | 0.37 | 11.57 |
3.2.2 Dynamic Particle Size Distribution
A jaw crusher simulated ore fragmentation. Selection (SS) and breakage (BB) functions were derived:Sn=diag(s1,s2,…,si),si=[−0.5998εn2+0.52987εn+0.0012]di0.34Sn=diag(s1,s2,…,si),si=[−0.5998εn2+0.52987εn+0.0012]di0.34
3.3 EDEM Simulation
A Hertz-Mindlin with Archard Wear model simulated lining plate cutting wear. Parameters included:
- Particle density: 2830 kg/m³
- Liner hardness: 535 HBW
4. Results and Discussion
4.1 Compression Wear Analysis
4.1.1 Effect of Shaft Speed
Table 2: Wear Rate vs. Shaft Speed
| Shaft Speed (rpm) | Max Wear Rate (×10−5 mm/s×10−5mm/s) | Uniformity Index |
|---|---|---|
| 350 | 2.2 | 0.68 |
| 450 | 1.5 | 0.92 |
| 550 | 1.8 | 0.75 |
Higher speeds reduced wear rates but improved uniformity.
4.1.2 Effect of Feed Particle Size
Larger particles increased localized wear due to higher stress concentrations.
Table 3: Wear Rate vs. Feed Size
| Feed Size (mm) | Avg. Wear Rate (×10−5 mm/s×10−5mm/s) |
|---|---|
| 25 | 0.8 |
| 45 | 2.4 |
4.2 Cutting Wear Simulation
EDEM results showed:
- Maximum wear occurred at the parallel zone entrance.
- Sliding distance LL correlated with shaft speed:
L∝N0.6L∝N0.6
5. Conclusions
- Lining plate wear is governed by compression and cutting mechanisms, with models validated experimentally and via DEM.
- Optimal shaft speeds (e.g., 450 rpm) balance wear rate and uniformity.
- Smaller feed sizes and precession angles enhance wear distribution homogeneity.
