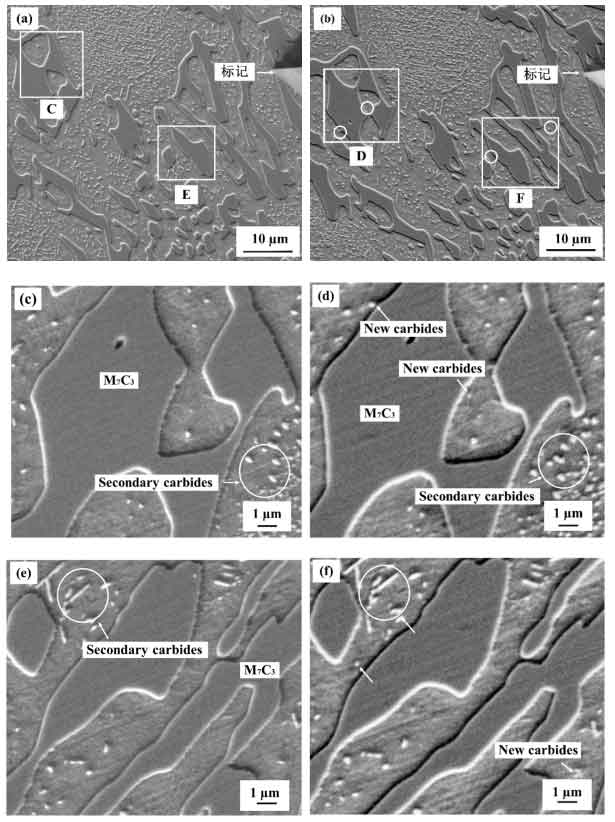
As shown in Fig. 1 (a) and Fig. 2 (a), the SEM images of high chromium cast iron quenched at 950 ℃ and 1000 ℃ are shown respectively. As shown in Fig. 1 (b) and Fig. 2 (b), the SEM images of samples quenched at 950 ℃ and 1000 ℃ after 40 days of natural aging (the room temperature in autumn is about 20 ℃). In order to better observe the tissue changes before and after aging, the change area is locally enlarged. Figure 1 (c), (E) and Figure 2 (c), (E) are the local enlarged views of C and E in Figure 1 (a) and 2 (a) respectively, and figure 1 (d), (f) and 2 (d), (f) are the local enlarged views of D and F in Figure 1 (b) and 2 (b) respectively. According to the analysis in the previous chapter, secondary carbides will precipitate after quenching of high chromium cast iron. Comparing the microstructure before and after aging, it is found that after aging (such as the small circle mark in the box of Fig. 1 (b) and the small circle mark in the box of Fig. 1 (b)), small and dispersed carbides precipitate on the martensitic matrix. The specific precipitation position can be seen in the local enlarged figures 1 (d), (f) and 1 (2) (d), (f). In addition, the size and shape of eutectic carbide M7C3 and secondary carbide obtained after quenching have not changed.
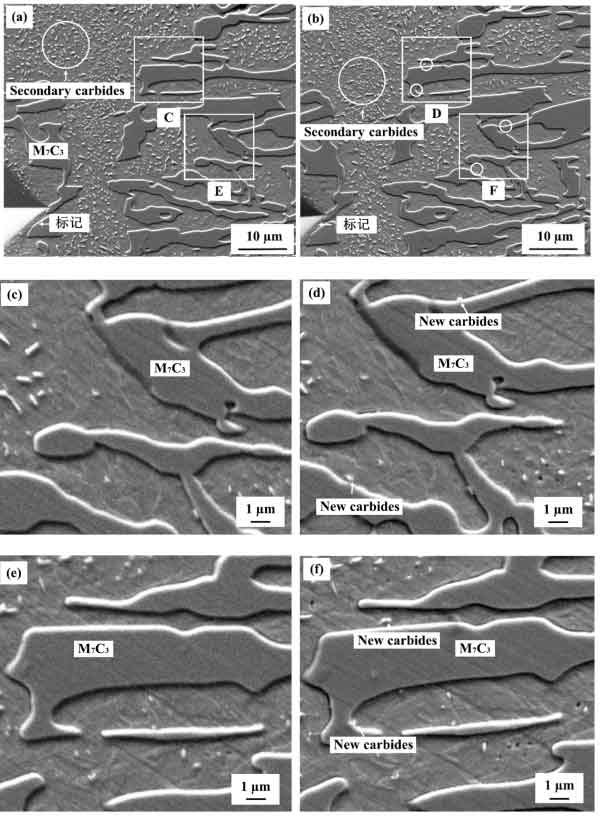
Note: The ” circle inside the box ” marks the newly precipitated carbides in Fig.1 and 2. The “New carbides” represents that the carbides precipitated during the aging process in Fig. (d) and (f)
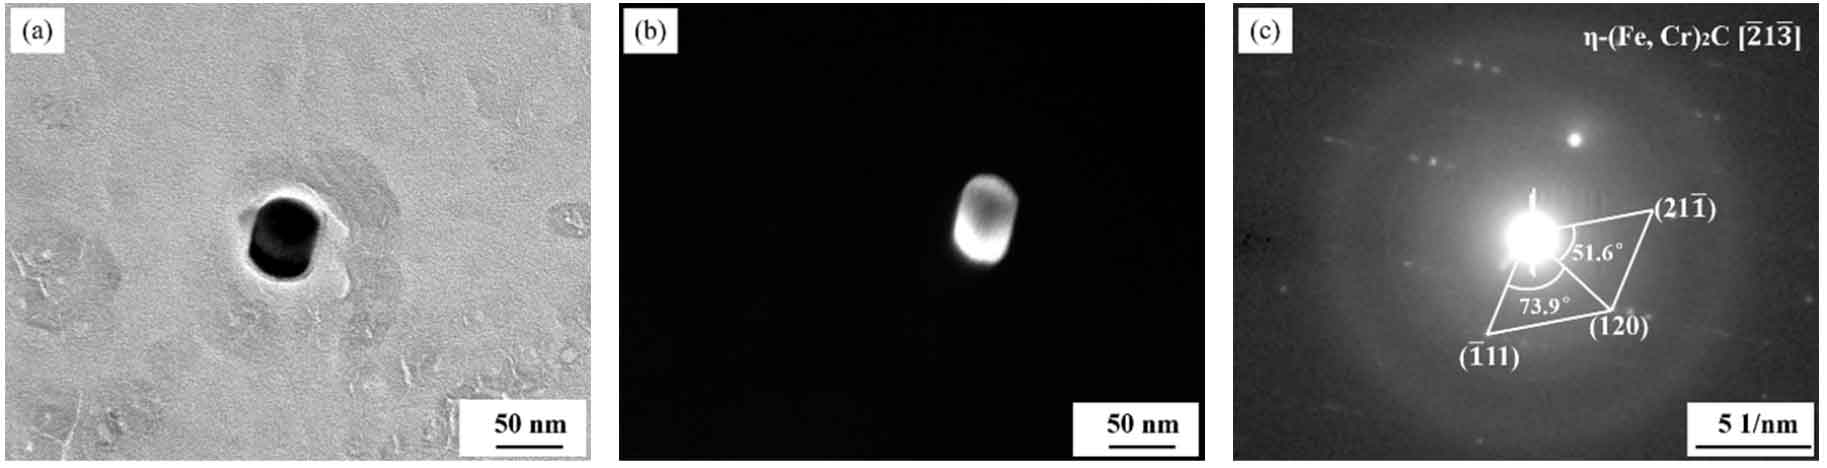
Figure 3 (c) shows the selected area electron diffraction pattern (SAED) of carbides in high chromium cast iron and its calibration. According to the occurrence conditions of diffraction spots, diffraction spots (1 ത 11) (120) and (211 ത) can be quickly identified in the SAED pattern. As shown in Fig. 3 (c), the angles between (1 ത 11) and (120) crystal planes and (120) and (211 ത) crystal planes measured in the experiment are 73.9 ° and 51.6 ° respectively, while the theoretical values are 75.1 ° and 49.7 ° respectively. Comparing the difference between the calculated value and the experimental value, it can be found that the difference is within the error range. According to the characteristics of microstructure and saed calibration analysis of carbide, it is judged that the carbide of high chromium cast iron is η- M2C, the crystal plane cluster is [2 ത 13 ത].