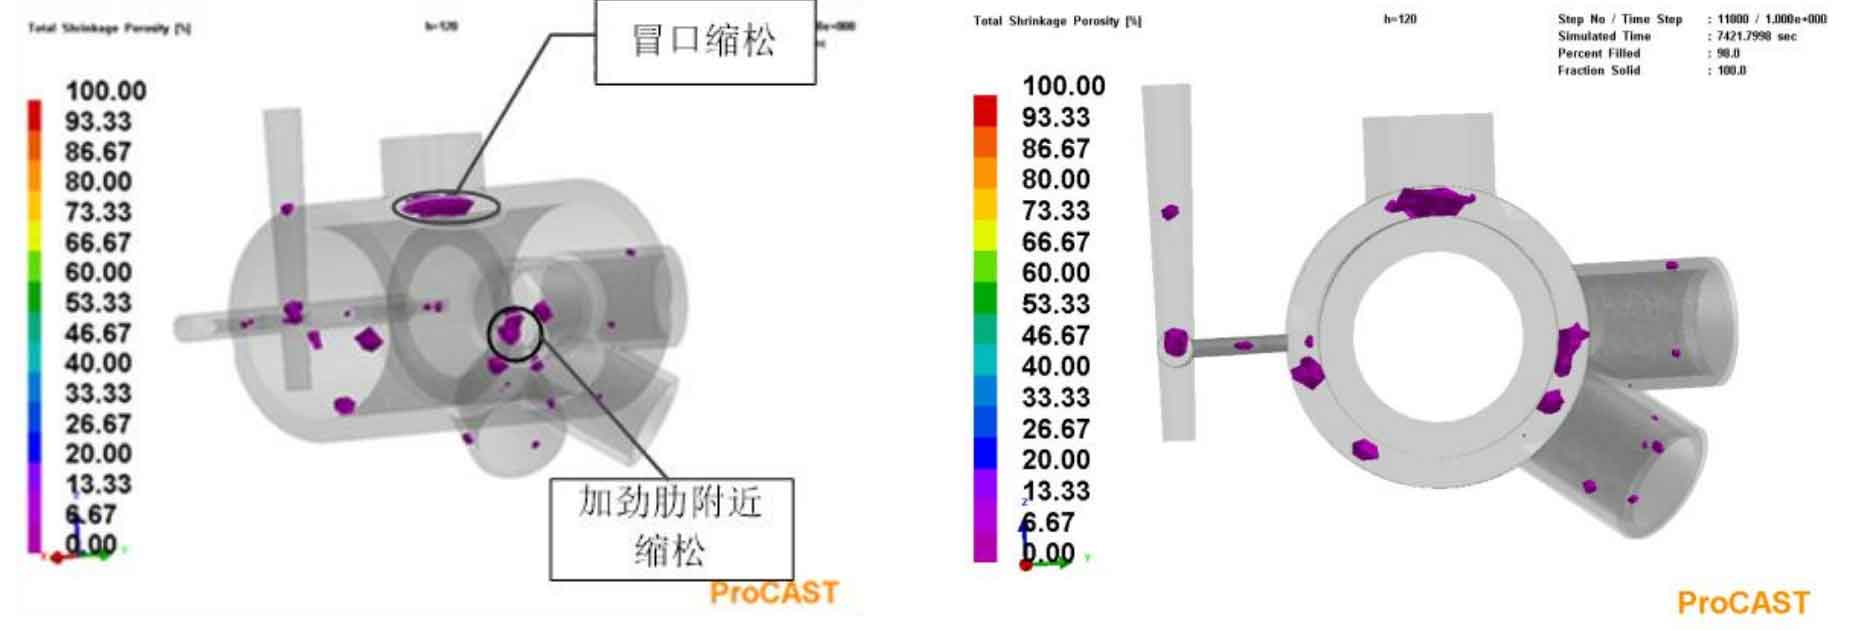
The shrinkage rate prediction module is used to predict the distribution of shrinkage defects. When the simulation results show that there are almost no shrinkage holes at the root of the main pipe and riser under the condition of 1% loose shrinkage, which are similar to the predicted process conditions, these shrinkage holes will be formed at the root of the main pipe and riser.
In addition, the critical value of niyama criterion is affected by the number of grids, the shape of steel castings and the type of alloy, and its critical value needs to be determined according to the actual test. It can be found from Figure 3 that the shrinkage cavity and porosity obtained by niyama criterion in the original process are concentrated in the center of the steel casting, while the shrinkage cavity and porosity defects in other positions (riser center and root) are ignored, so it has certain limitations.
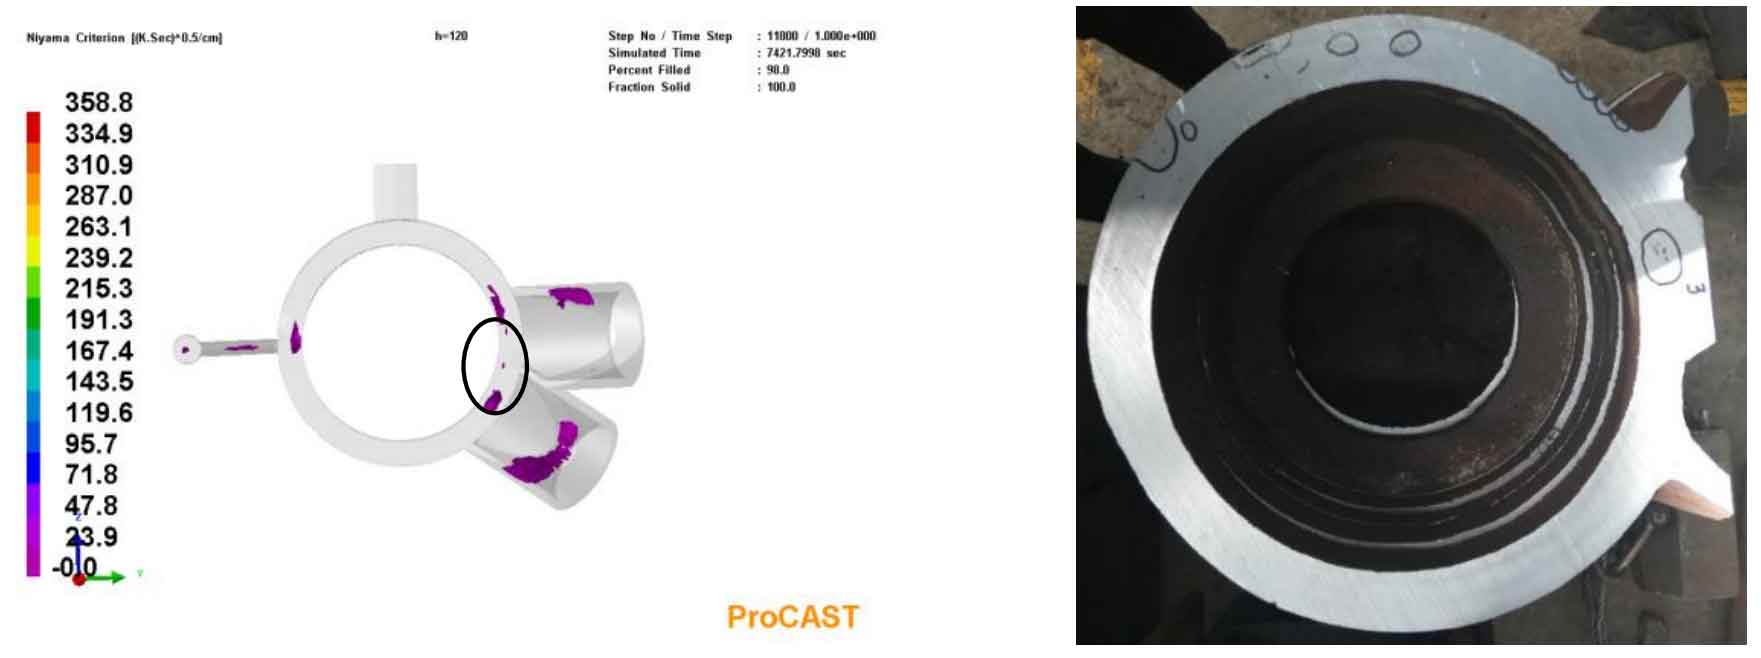
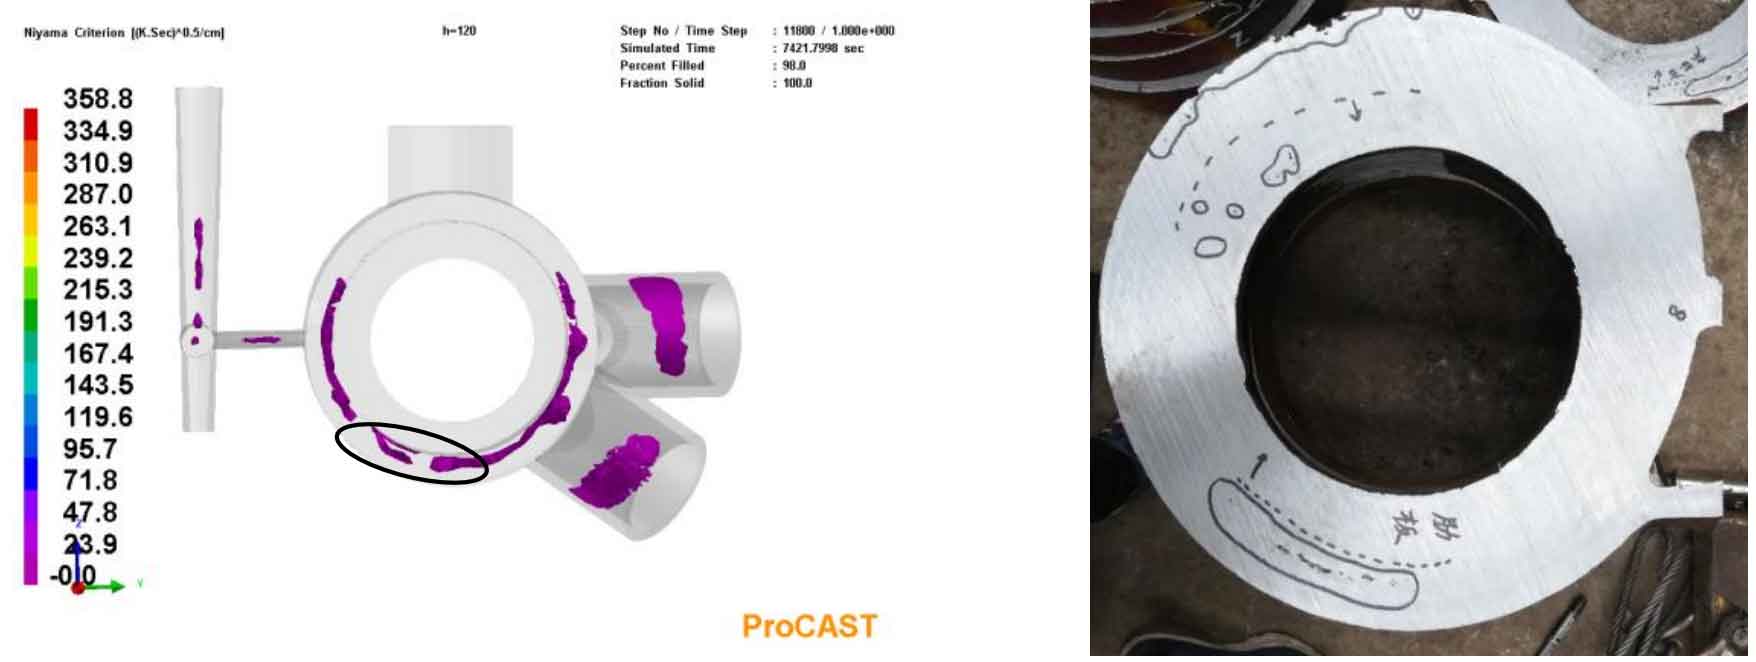
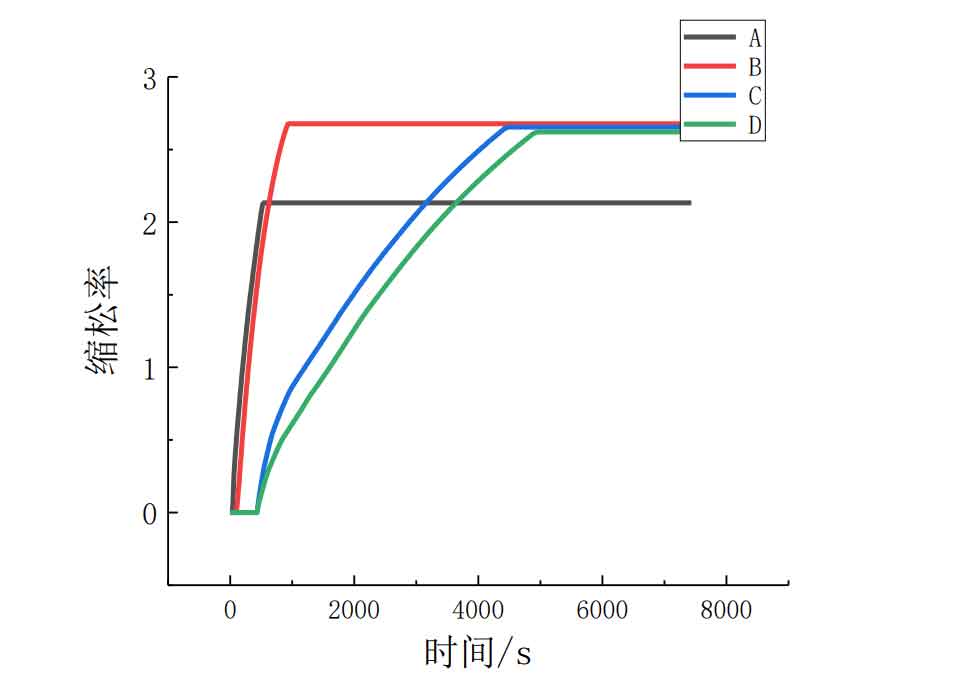
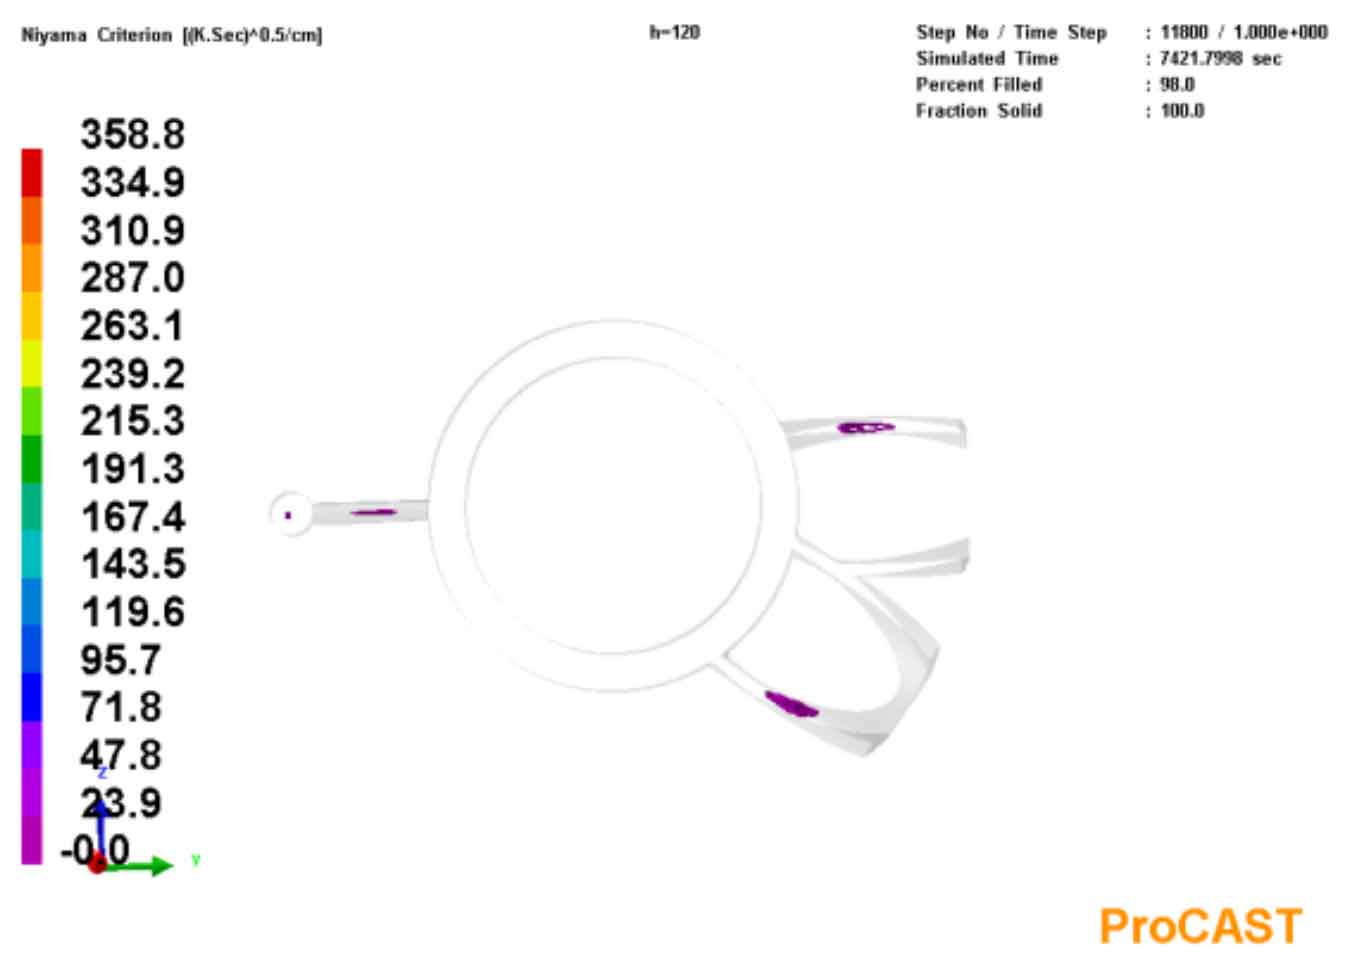
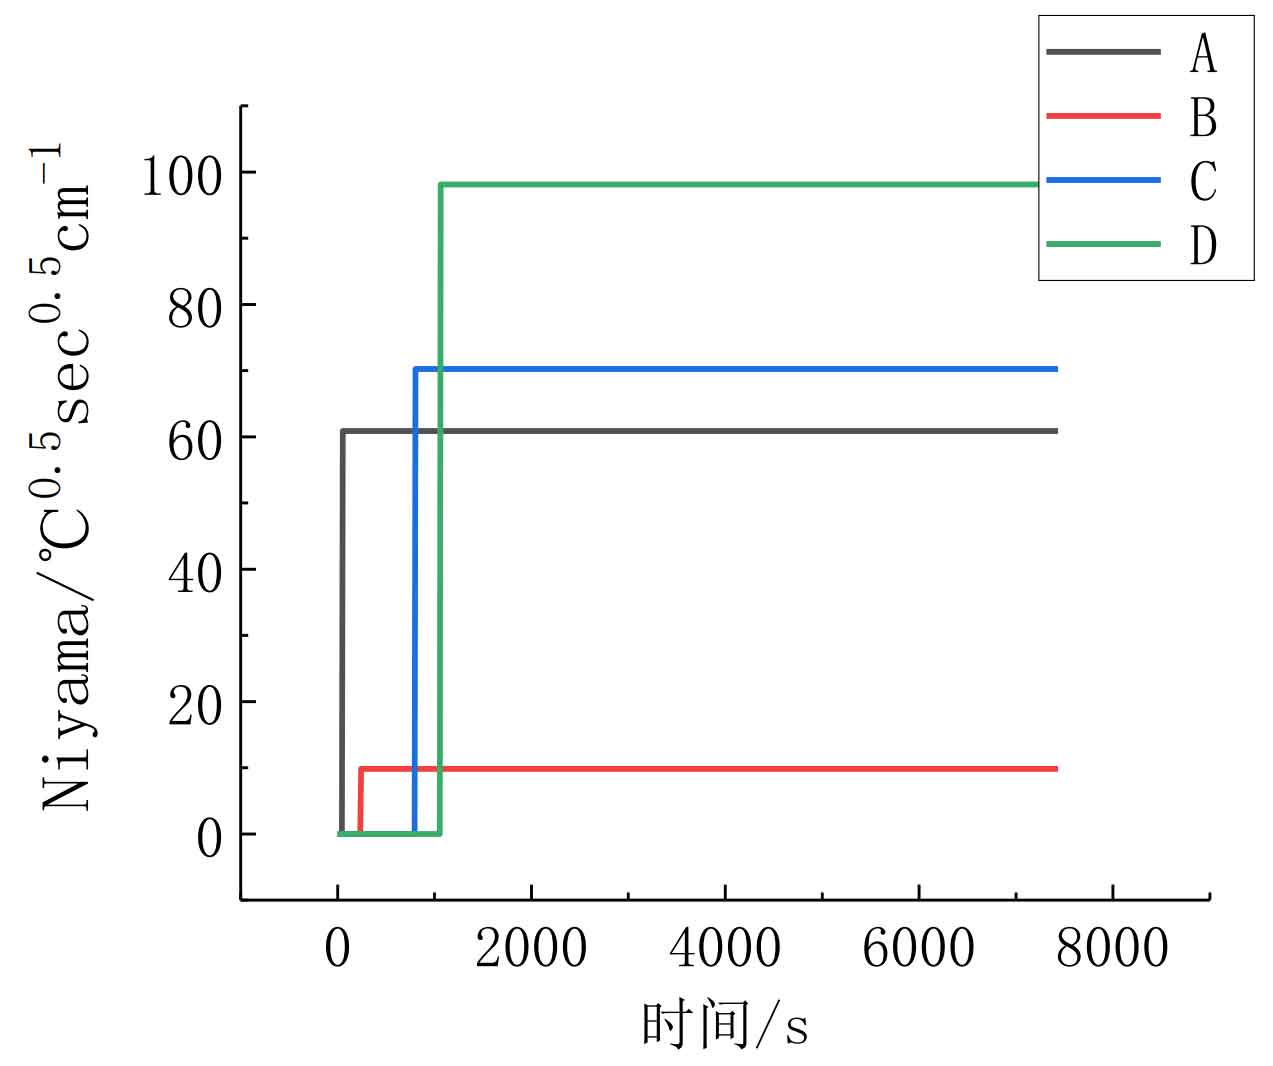
It can be seen from Figure 4 that the niyama criterion is quite accurate in predicting the shrinkage at the bottom of the stiffener of the main pipe and the shrinkage near the branch pipe, but the niyama criterion is distorted in predicting the defects near the riser and the defects in the intersection area of the branch pipe. This part is related to the definition of the niyama criterion itself. The literature points out that the niyama criterion value is different for steel castings with different wall thickness and is greatly affected by the cooling rate, This also verifies that the niyama criterion is not necessarily very accurate in judging the tendency of macro shrinkage and looseness, and can not predict the most serious macro shrinkage and looseness near the riser. On the other hand, the cooling of liquid steel by the dense core support inside the branch pipe is not considered in the modeling, which will reduce the shrinkage and looseness defect of the branch pipe to a certain extent. Similarly, we can focus on four points a, B, C and D to obtain their hot crack and cold crack tendency curves, as shown in Fig. 6 and Fig. 8. The thermal elastic-plastic constitutive model is used to analyze the solidification stress of cast steel joints. The stress curves of a, B, C and D are shown in Fig. 9.
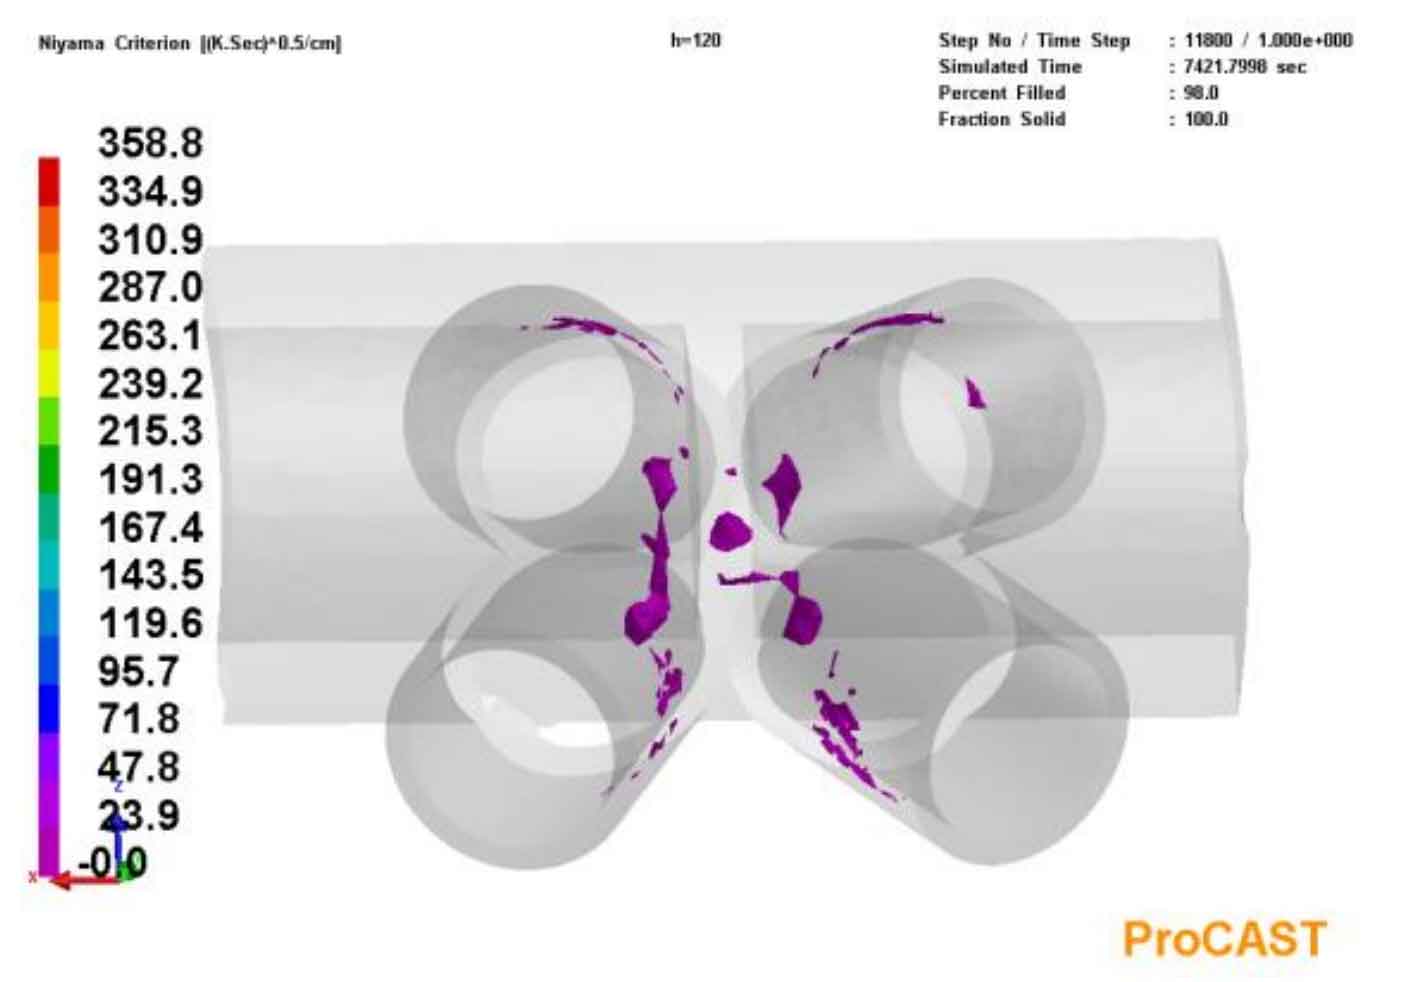
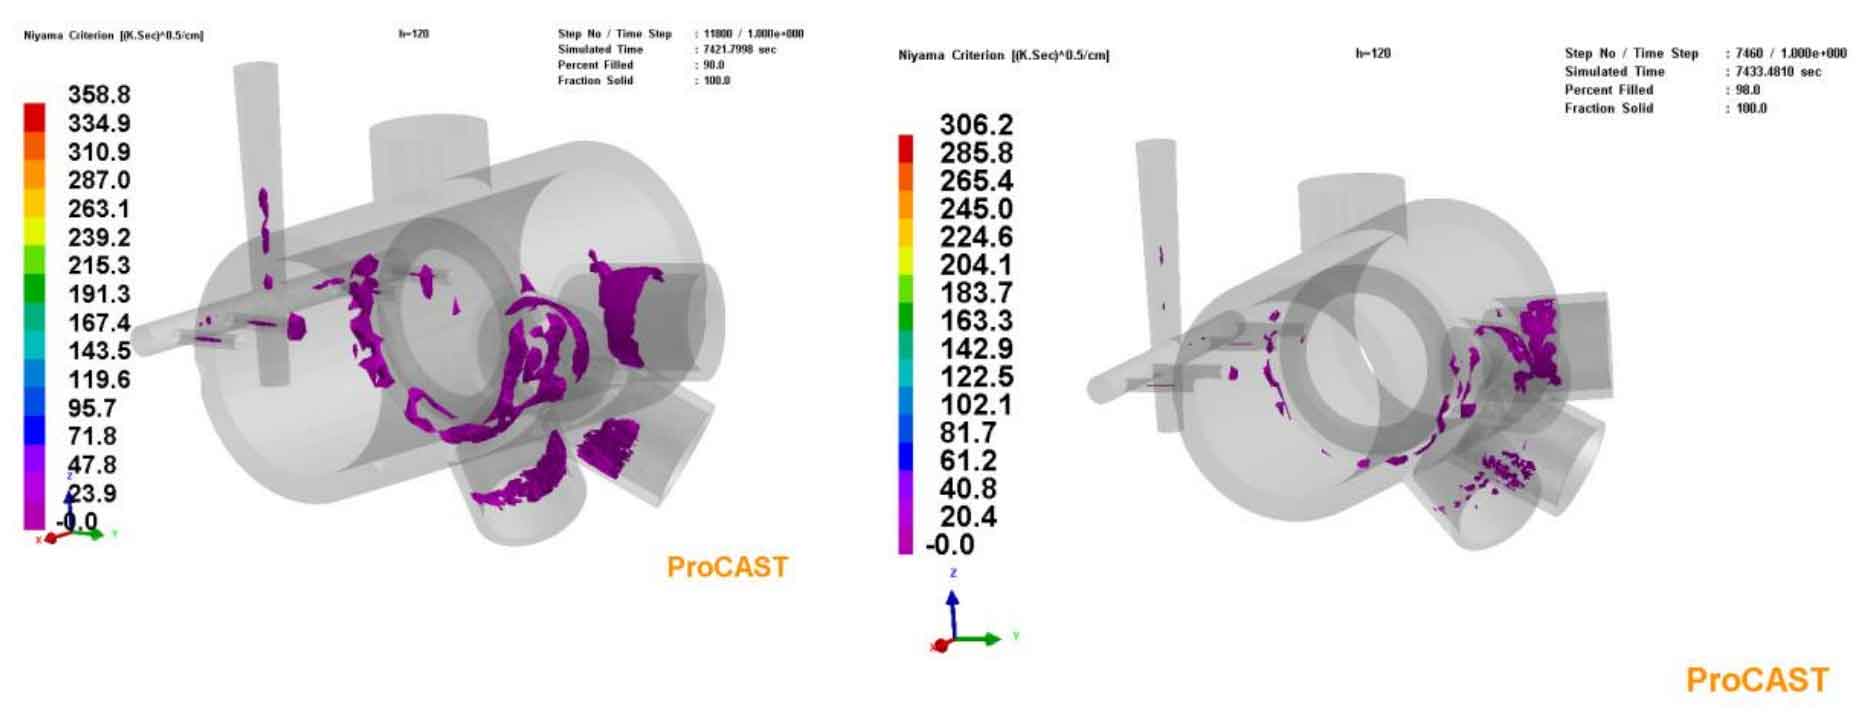
The casting simulation results show that the slow solidification speed will lead to insufficient compactness of the structure and macro shrinkage defects. Moreover, the solidification sequence of steel casting and gating system is: steel casting area → hot joint in the middle of steel casting → riser, which is basically solidified from both sides to the middle, and the solidification sequence from bottom to top is not strictly realized. Because there are still isolated hot joint areas at the intersection of steel casting branch pipes, shrinkage cavities are easy to occur, and the gating system needs to be further improved, but the hot joint has many bifurcations, so it is difficult to set riser or cold iron. According to the shrinkage prediction diagram, there may be serious shrinkage near the riser, and this shrinkage is not only in the riser, but also affects the main pipe area. Niyama criterion indicates that there are many defects near the branch pipe, and shrinkage defects may also appear at the intersection of stiffener, main pipe and branch pipe.
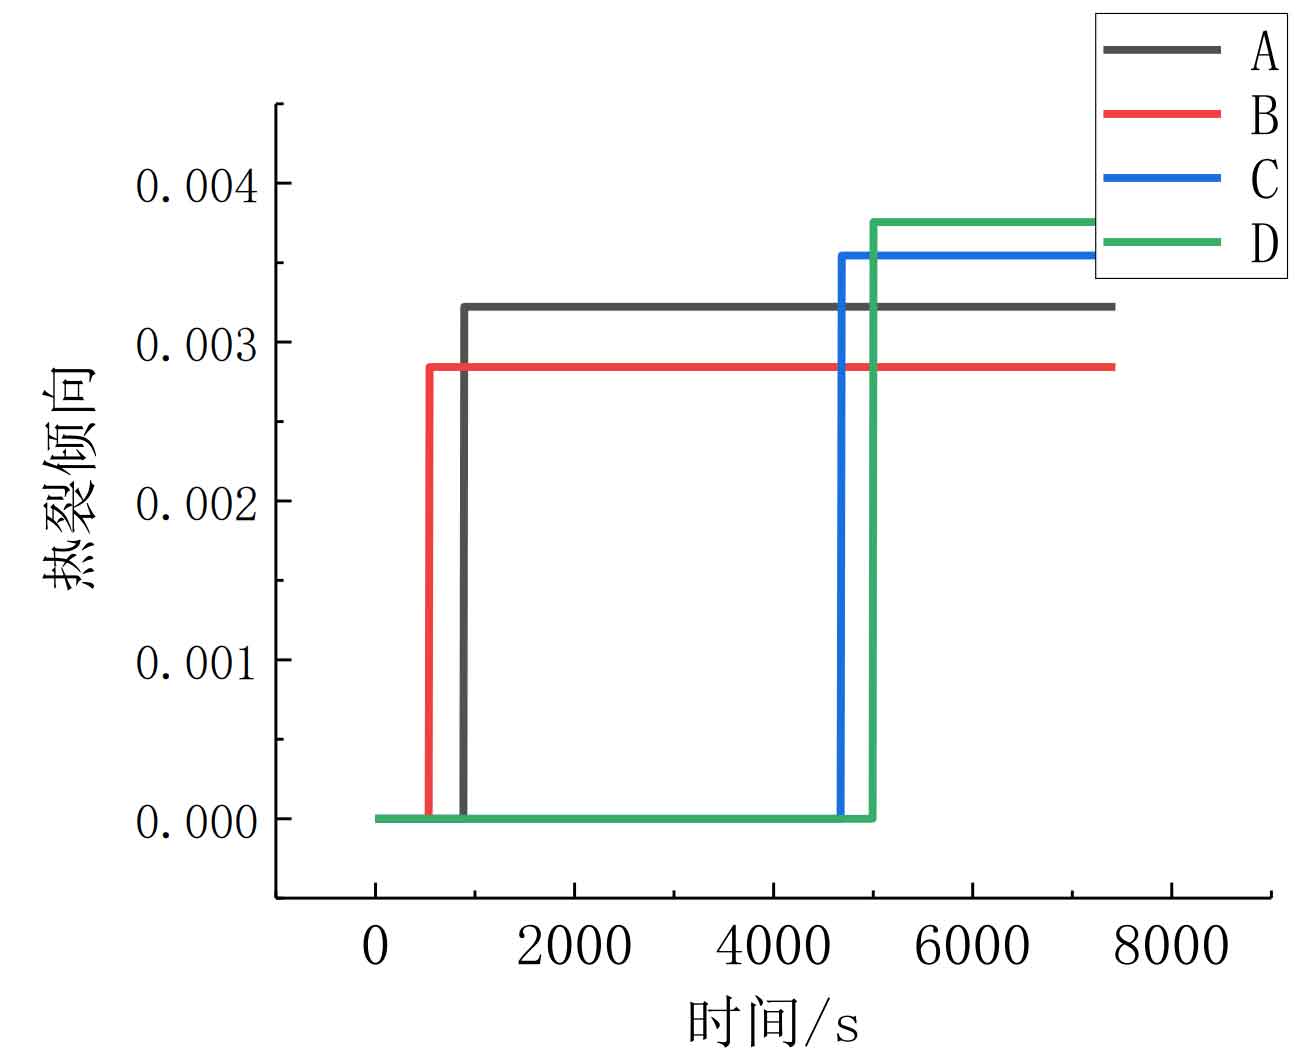
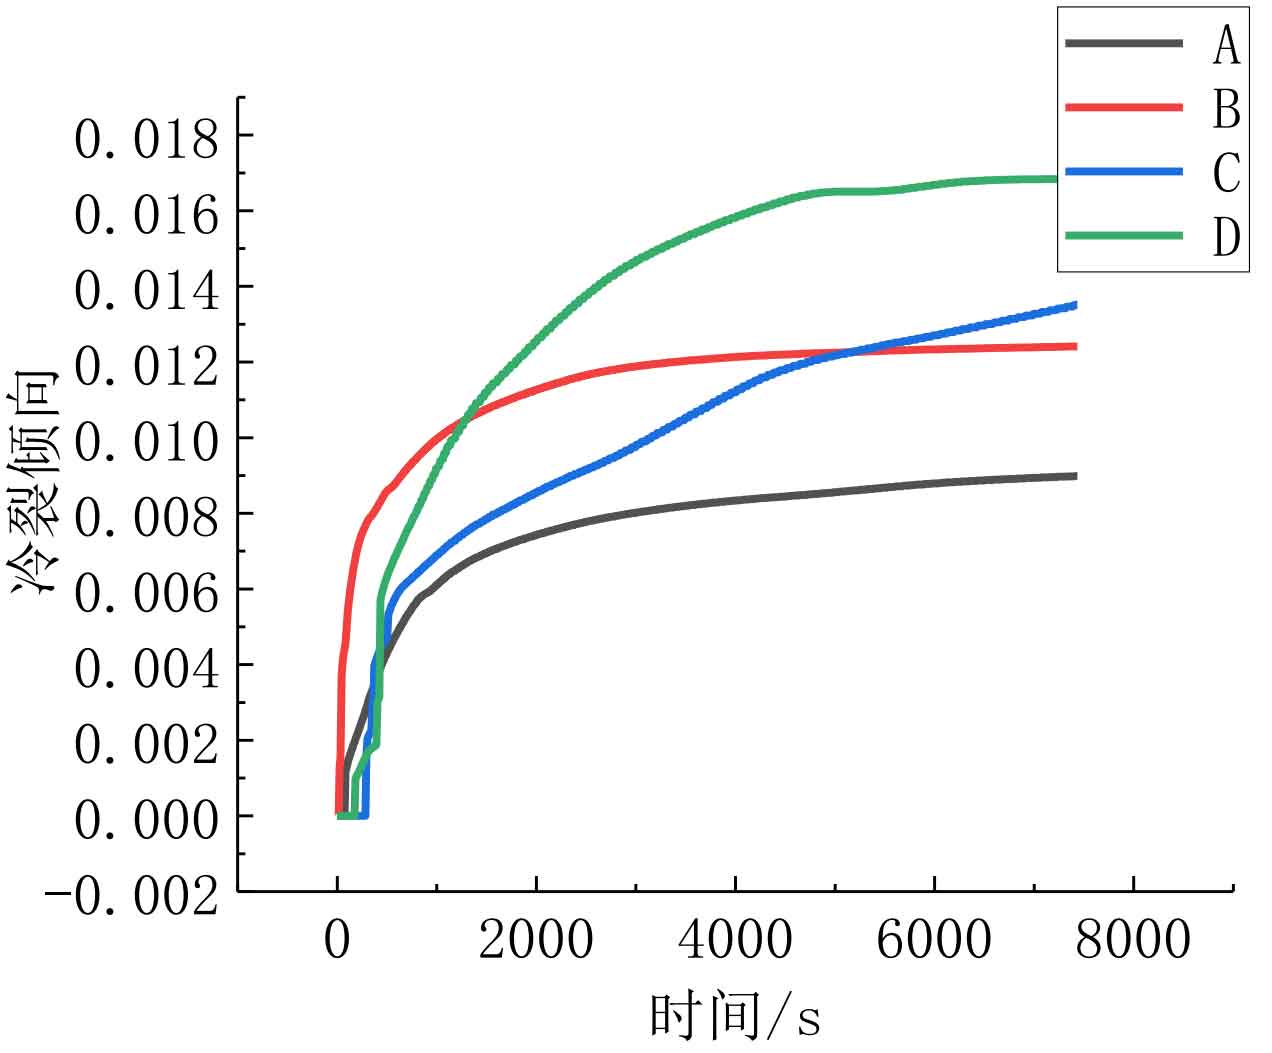
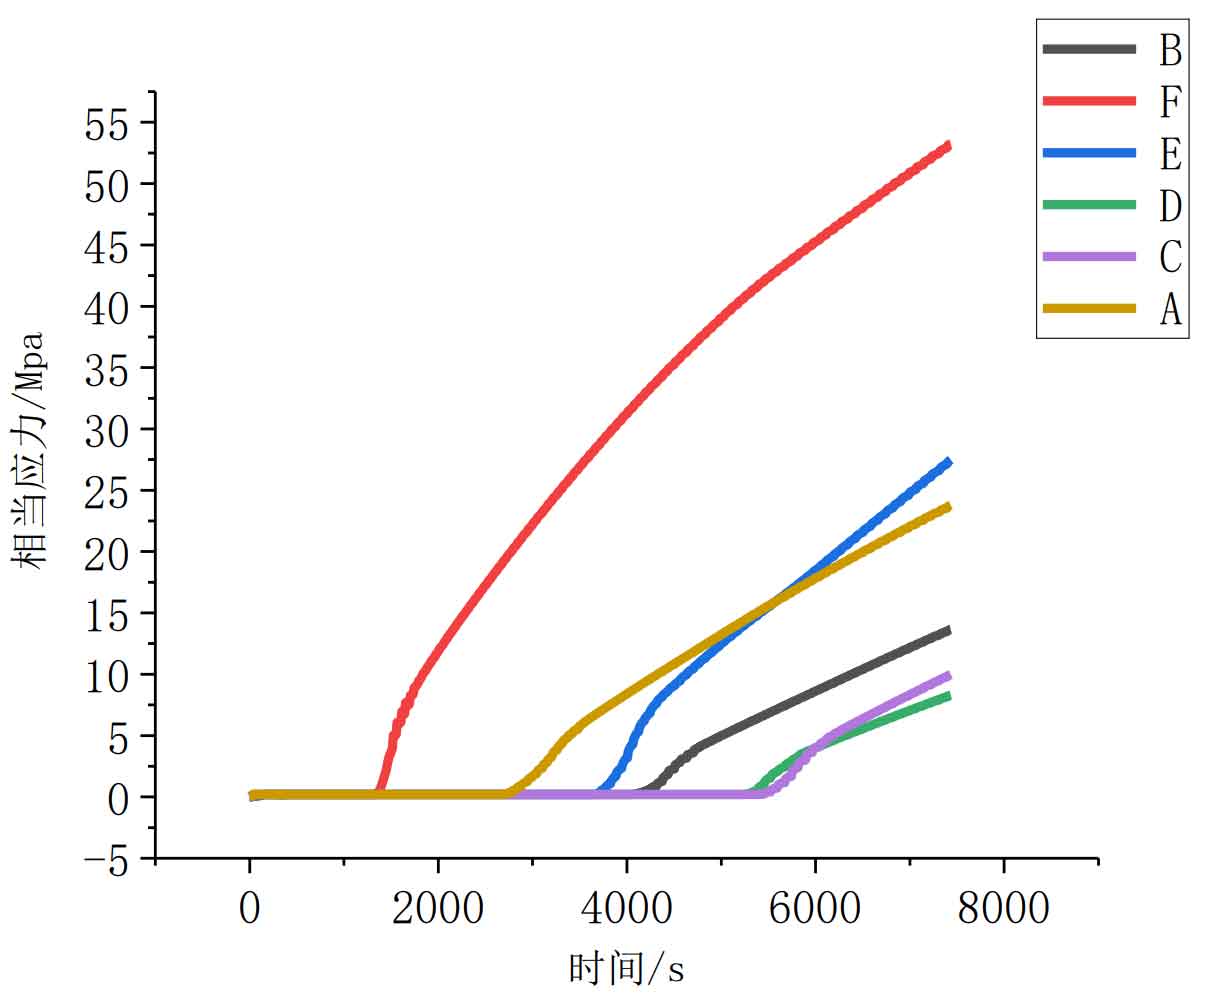
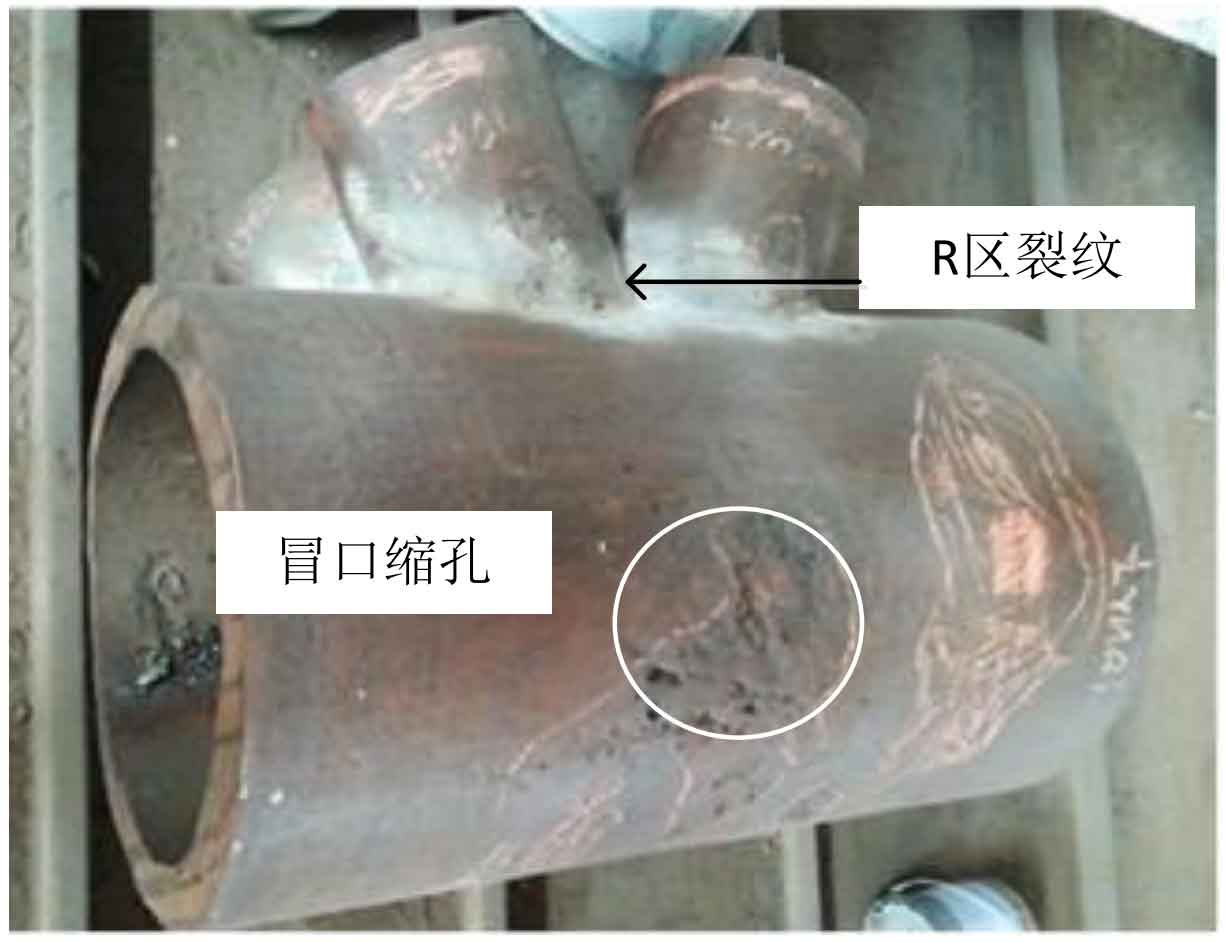
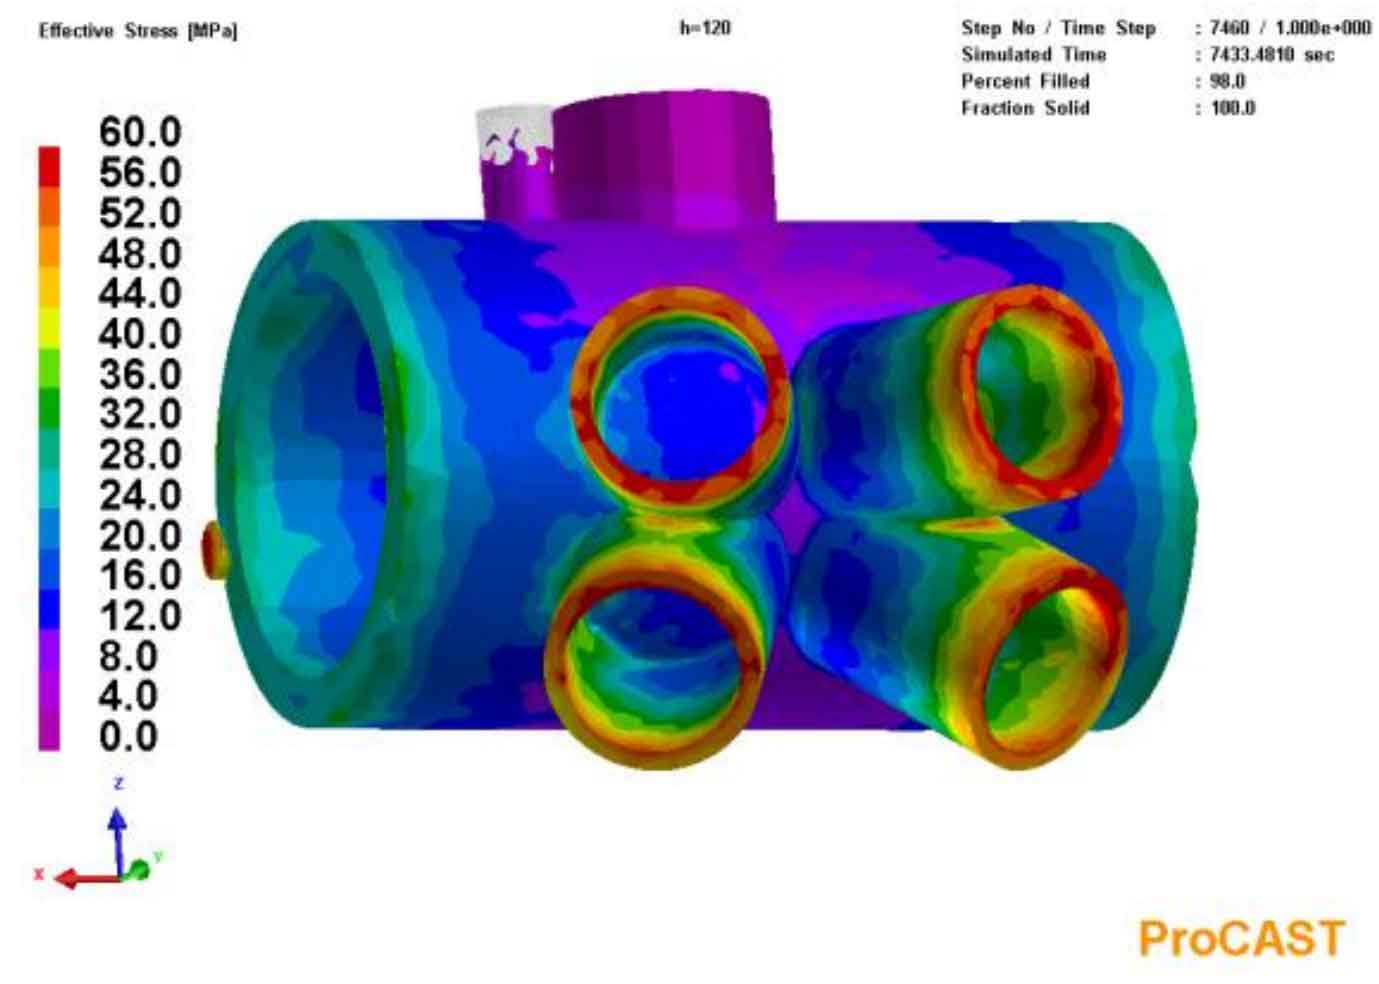
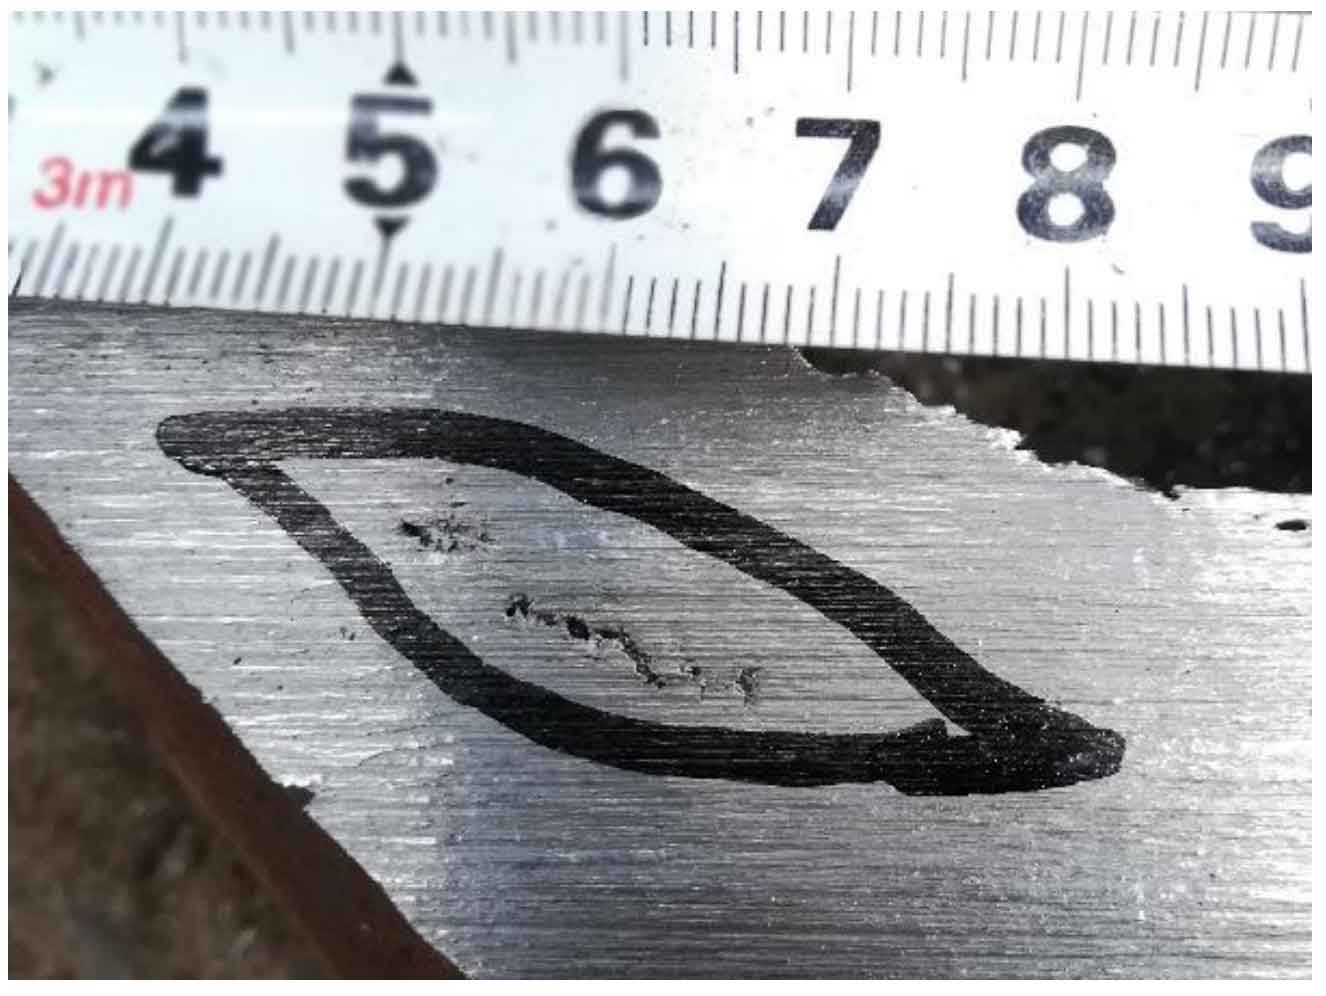
Hot crack and cold crack defects are not allowed in Chinese steel casting quality specification, because cracks will seriously damage the mechanical properties of cast steel joints. According to the analysis of cold crack and hot crack tendency curves of a, B, C and D, point D, that is, the root of the intersection of steel casting branch pipes, is more prone to hot crack and cold crack defects than other positions on the branch pipes. This is consistent with the actual situation (FIG. 10). Cracks were indeed found at d during magnetic particle flaw detection. However, the casting simulation did not simulate the delamination defects in the upper layer of steel castings. It is advisable to select 6 points on the cast steel joint to obtain the stress change curve of each point. At 7433s, the stress at point F in area R is the highest, reaching 53.23mpa, followed by point E in area R, which is 27.48mpa. These two points are the intersection of branch pipes and are located on the intersection line at the root of branch pipes. This also shows that the probability of cracks in this place is greater than that in other places.