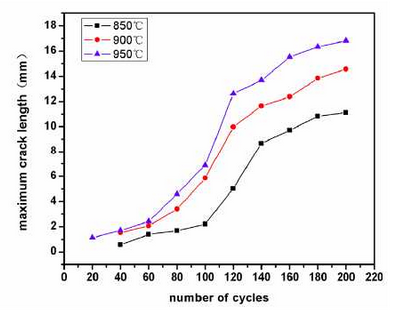
The temperature range of the thermal cycle (T) is equal to the upper limit temperature of the thermal cycle (T) is equal to the difference between the upper limit temperature (Tmax) Max and the lower limit temperature (Tm) and the lower limit temperature (Tmin) min) of the thermal cycle. During the thermal fatigue test, the upper limit temperature of the thermal cycle of high silicon molybdenum ductile iron and high nickel ductile iron is set to800 C, 850 C, 900 C, 950 C, while the lower limit temperature is about 20 C for tap water, which is a fixed value.Therefore, the effect of the temperature range of the thermal cycle studied is essentially the effect of the upper temperature of the thermal cycle.Figures 1 and 2 respectively reflect the relationship between the maximum crack length and the number of thermal cycles of high nickel and high silicon molybdenum ductile iron. According to the test records, high silicon molybdenum ductile iron cracks at 950 C for less than 10 thermal cycles, so it is not reflected in Figure 2.Whether high nickel ductile iron or high silicon molybdenum ductile iron, the relationship curve between the maximum crack length and the number of thermal cycles basically shows the “S” shape, thus the crack growth during the whole thermal cycle can be divided into four processes: crack formation, crack propagation, rapid crack development and stable crack development.
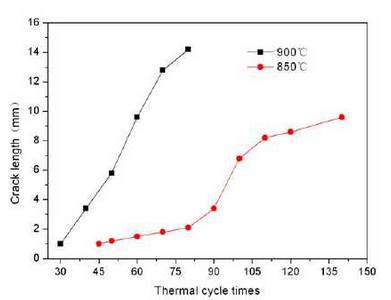
From Figures 1 and 2, it can be seen that the length of the main crack increases with the number of thermal cycles and the growth stage of the main crack decreases with the increase of the thermal cycle temperature, whether it is high silicon-molybdenum ductile iron or high nickel ductile iron.High silicon molybdenum ductile iron has 80 or so thermal cycles at 850 C, 40 at 900 C, and the time of expansion phase decreases by nearly 50%. High nickel ductile iron has 90 or so thermal cycles at 850 C, 60 at 900 C and 40 at 950 C, almost reducing by 25%.At the same thermal cycle temperature, the crack growth period of high nickel ductile iron is significantly higher than that of high silicon molybdenum ductile iron. Taking 900 C as an example, the crack growth period of high nickel ductile iron is more than that of high silicon molybdenum ductile iron for nearly 20 thermal cycles.But beyond this stage, the crack will enter the rapid development period of crack.It is found by comparing and calculating the test results that the crack growth rate da/dN (where a represents the maximum length of the main crack and N represents the number of thermal cycles.)It increases with increasing temperature range of thermal cycle.
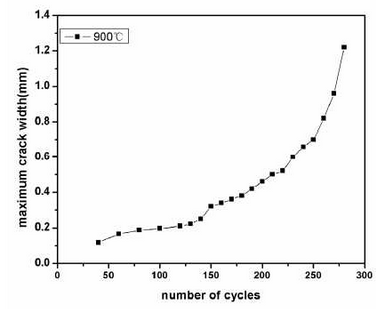
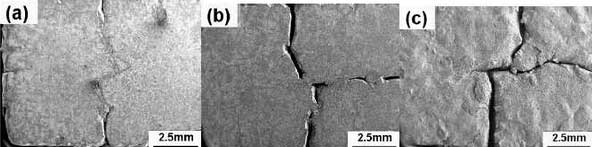
With the growth of the main crack, the crack length and width increase gradually.Figure 3 shows the relationship between crack width and number of thermal cycles of high nickel ductile iron at 900 C. The variation law is basically similar to that of crack length, but the change speed of crack width is obviously lagged behind that of crack length. The change speed of crack width is generally lagged behind that of crack length by about 80 times.Fig. 4 shows the crack pattern of high nickel ductile iron after 200 thermal cycles at 850, 900 and 950 C, respectively.The width of the main crack is only 0.26mm at 850 C and 0.29mm at 900 C. The width of the main crack is close to 0.34mm at 950 C, which is about 10% and 30% higher than that at 850 C and 900 C respectively.For the same material, the width of the thermal fatigue crack increases with the number of cycles.As shown in Figure 4.9, the thermal fatigue crack width of high-nickel ductile iron gradually reaches 0.3-0.4mm for 280 thermal cycles from 3-5um at the upper limit temperature of 900 C for 60 thermal cycles.It can be observed that the width of thermal fatigue crack after 280 thermal cycles is greater than 160 thermal cycles, and the width of thermal fatigue crack after 120 thermal cycles is greater than 80 thermal cycles.
The temperature distribution of all parts of the sample tends to be uniform due to the sufficient heat exchange between the inside and outside of the sample with the holding time of 10 minutes.When heated and cooled, on the cross section of the sample, a different temperature distribution, centered on the symmetric axis and along the thickness, is produced, which is often described by a temperature gradient.