
The sample size for thermal fatigue test is 15 mm x 10 mm x 10 mm.To eliminate the influence of surface defects on the test results, 1000 # sand defect was used to influence the test results. 1000 # sand paper was used to grind and polish the surface of the sample.The thermal fatigue test equipment is box-type resistance furnace. The upper limit temperature (Tm resistance furnace) and the upper limit temperature (Tmax) of thermal fatigue test are selected according to the specific materials used. The holding time is 10 minutes, and then quenched. The quenching medium is tap water. The lower limit temperature (Tm holding time is 1.000 degrees Celsius).Ten minutes later, quenching is performed with tap water as the quenching medium. The lower limit temperature (Tmin) is 20 C and remains constant.
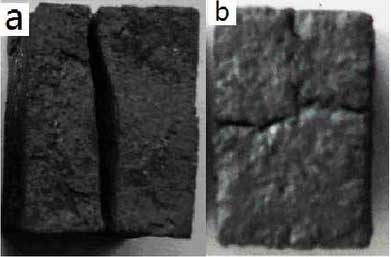
Figure 1 shows the macroscopic changes of samples of high silicon molybdenum ductile iron (Figure 1a) and high nickel ductile iron (Figure 2b) after thermal fatigue testing.It can be found through observation that both high silicon molybdenum ductile iron and high nickel ductile iron form red-black oxide layer on the original polished surface, and a lot of cracks appear on the surface of the sample, resulting in uneven surface of the sample, severe deformation at the center of each observation surface of the sample than at the edge, accompanied by obvious thermal fatigue cracks.However, no micro-cracks were observed on the surface except for the main crack.The path through the surface of the specimen is zigzag and distorted to varying degrees.Under the same test conditions, the developed high silicon molybdenum ductile iron has a much larger deformation than high nickel ductile iron.
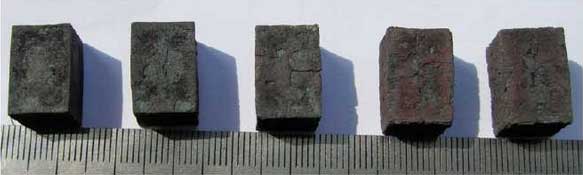
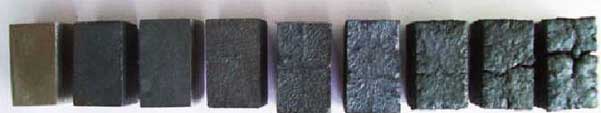
Figures 2 and 3 show the recorded process of taking one sample every 20 cycles during the thermal fatigue test of high silicon molybdenum ductile iron and high nickel ductile iron at 800 and 950 C.The degree of oxidation and deformation increases with the number of thermal cycles throughout the test.During the experiment, it was found that the micro-cracks did not occur at the beginning, but first appeared in the center of the sample after the deformation of the sample to a certain extent, then the number of micro-cracks gradually increased, and then some cracks expanded into main cracks. After the formation of main cracks, they quickly expanded to the edge of the sample, and the remaining micro-cracks remained until the end of the experiment. At the same time, the micro-cracks increased gradually.The number will decrease.Based on the shielding effect of the crack, the small cracks near the main crack hardly propagate and the micro-cracks in the same direction merge.
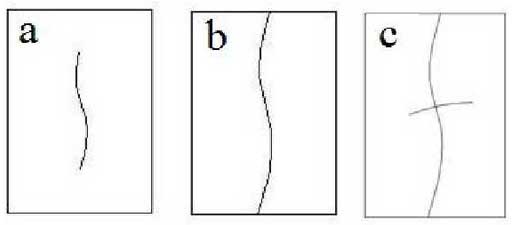
Finally, two main cracks crossed by “cross” or “T” are formed, and the path formation pattern is shown in Figure 4.Usually the crack starts on the surface of the sample and then extends into the interior of the sample, and the crack always appears on a plane with a large surface area.This is also consistent with the research results of some scholars.
During the thermal cycle, after the sample has been heated and kept warm for 10 minutes, the internal and external temperatures of the sample are almost the same, basically eliminating the existence of temperature gradients. Then the instant of quenching causes the temperature of the surface to drop abruptly, while the interior is still near the upper temperature of the thermal cycle. At the same time, the exterior has begun to shrink, while the interior is in an expansion state, and the shrinkage of the surface will occur.Limited by internal expansion.Tensile stress is then generated on the surface and compressive stress on the inner layer; conversely, when heated, the stress state is opposite to that of the quenching cooling stage.When the internal and external temperatures are the same, the temperature gradient disappears.During continuous heating and cooling, the sample will be subjected to this cyclic thermal stress continuously, resulting in certain elastic and plastic deformations, which will lead to the accumulation of such induced deformations and the formation of distortion and micro-cracks in the sample.This is also consistent with the previous research reports of many scholars.