
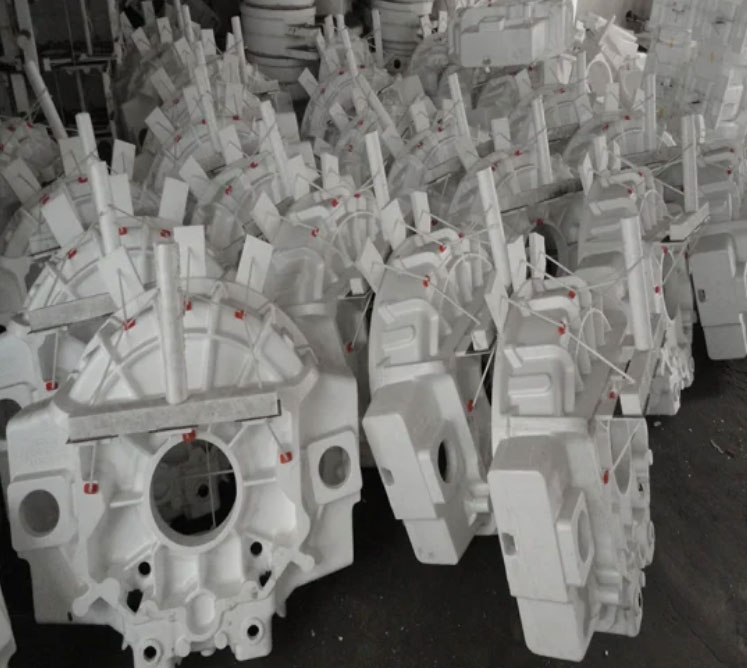
As a foundational technology in modern equipment manufacturing, lost foam casting faces challenges including low yield rates and defect formation during complex component production. This study presents a systematic approach combining numerical simulation and process optimization to address quality issues in turbine rear exhaust pipe casting for Guangxi Guiguan Machinery Co., Ltd.
1. Numerical Simulation Methodology
The thermal-fluid dynamics during lost foam casting can be described by the following governing equations:
Continuity equation:
$$ \nabla \cdot (\rho \mathbf{u}) = 0 $$
Momentum conservation:
$$ \frac{\partial (\rho \mathbf{u})}{\partial t} + \nabla \cdot (\rho \mathbf{u} \mathbf{u}) = -\nabla p + \mu \nabla^2 \mathbf{u} + \mathbf{F} $$
Energy conservation:
$$ \rho C_p \left( \frac{\partial T}{\partial t} + \mathbf{u} \cdot \nabla T \right) = \nabla \cdot (k \nabla T) $$
Where $\rho$ represents density, $\mathbf{u}$ velocity vector, $p$ pressure, $\mu$ dynamic viscosity, $C_p$ specific heat, and $k$ thermal conductivity.
2. Process Parameters and Boundary Conditions
Key parameters for lost foam casting simulation of the turbine exhaust pipe:
| Parameter | Value | Unit |
|---|---|---|
| Pouring temperature | 1400 | °C |
| Mold preheat temperature | 25 | °C |
| Vacuum pressure | 0.04 | MPa |
| Interface heat transfer coefficient | 500 | W/m²K |
| EPS foam density | 28 | kg/m³ |
3. Defect Formation Mechanism
The shrinkage porosity formation criterion can be expressed as:
$$ \frac{G}{\sqrt{R}} \leq C $$
Where $G$ represents temperature gradient (°C/mm), $R$ cooling rate (°C/s), and $C$ material constant.
Simulation results revealed critical issues in original lost foam casting process:
- Maximum porosity concentration: 18.7% at pipe crown
- Solidification time variation: 58-127s across different sections
- Temperature gradient range: 12-45°C/cm
4. Process Optimization Strategy
The modified riser design follows Chvorinov’s rule:
$$ t_s = B \left( \frac{V}{A} \right)^n $$
Where $t_s$ is solidification time, $V$ riser volume, $A$ cooling surface area, and $B,n$ material constants.
Optimization measures for lost foam casting:
- Riser height-diameter ratio optimization: 1.2:1 → 1.5:1
- Gating system redesign with stepped feeding
- Vacuum pressure adjustment from 0.04MPa to 0.055MPa
5. Validation of Improved Process
Comparative analysis of process parameters:
| Metric | Original | Optimized |
|---|---|---|
| Yield rate | 68.2% | 91.7% |
| Solidification time | 127s | 98s |
| Max porosity | 18.7% | 2.1% |
| Energy consumption | 48kWh/unit | 39kWh/unit |
The thermal gradient distribution after optimization shows significant improvement:
$$ \Delta G_{\text{max}} = 32^{\circ}\text{C/cm} \rightarrow 19^{\circ}\text{C/cm} $$
$$ \sigma_G = 14.2 \rightarrow 6.8 $$
6. Industrial Implementation
The optimized lost foam casting process achieved:
- Production cycle reduction: 22 days → 14 days
- Material utilization rate improvement: 71% → 89%
- Annual cost saving: \$142,000
This case study demonstrates the effectiveness of numerical simulation in optimizing lost foam casting processes for complex automotive components. The methodology provides a systematic approach for defect prediction and process parameter optimization, significantly reducing trial-and-error costs in foundry production.