
The lost foam casting (LFC) process has revolutionized metal component production through its unique pattern vaporization mechanism. This paper details our systematic approach to manufacturing HT250 alloy flywheels using LFC, achieving an 85% qualification rate through rigorous process optimization.
1. Process Fundamentals and Material Specifications
The LFC process follows these critical stages:
$$t_{cycle} = t_{foam} + t_{coating} + t_{casting} + t_{cooling}$$
Where:
- $t_{foam}$ = Pattern preparation time (72-120 hrs)
- $t_{coating}$ = Coating/drying cycle (8-12 hrs)
- $t_{casting}$ = Metal pouring duration (30-35 s)
- $t_{cooling}$ = Solidification period (≥60 min)
| Element | Range (%) | Control Tolerance |
|---|---|---|
| C | 3.10-3.30 | ±0.05 |
| Si | 1.85-2.40 | ±0.10 |
| Mn | 0.60-0.95 | ±0.05 |
| P | ≤0.10 | – |
| S | ≤0.10 | – |
2. Critical Process Parameters
Key parameters in lost foam casting flywheel production:
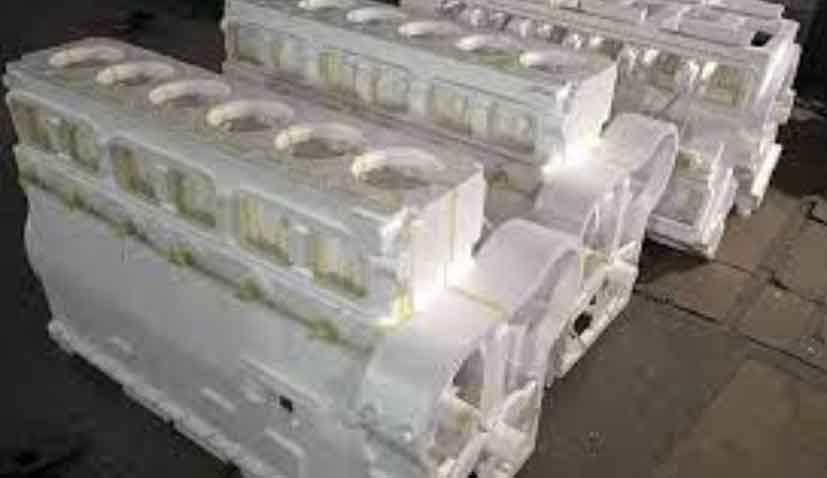
2.1 EPS Pattern Control
The density-stress relationship for EPS patterns:
$$\sigma = k\rho^n$$
Where:
- $\sigma$ = Compressive strength (MPa)
- $\rho$ = Pattern density (g/L)
- $k$ = Material constant (0.012-0.015)
- $n$ = Exponent (1.8-2.2)
| Process Stage | Temperature (°C) | Time | Density Target |
|---|---|---|---|
| Pre-expansion | 100-110 | 90-120 s | 18-20 g/L |
| Maturation | 25-30 | 4-8 hrs | 20-22 g/L |
| Final Aging | Ambient | 240-360 hrs | ≤0.5% dimensional change |
2.2 Coating System Optimization
The coating thickness ($\delta$) calculation:
$$\delta = \frac{\mu Q}{A\sqrt{t}}$$
Where:
- $\mu$ = Coating viscosity (1.8-2.2 Pa·s)
- $Q$ = Coating volume (0.8-1.2 L)
- $A$ = Pattern surface area (0.25-0.35 m²)
- $t$ = Drying time (4-6 hrs)
3. Gating System Design
The optimized gating ratio for 16-cavity molds:
$$F_{sprue}:F_{runner}:F_{gate} = 1:1.2:1.5$$
With critical velocity constraints:
$$v_{max} = \sqrt{\frac{2gH}{1 + f\frac{L}{D}}} \leq 2.5\ \text{m/s}$$
Where:
- $g$ = Gravitational acceleration (9.81 m/s²)
- $H$ = Metallostatic head (0.35 m)
- $f$ = Friction factor (0.02-0.03)
- $L$ = Flow length (1.2 m)
- $D$ = Sprue diameter (0.04 m)
4. Process Validation Results
Key quality metrics achieved through lost foam casting optimization:
| Defect Type | Initial Rate (%) | Optimized Rate (%) | Improvement |
|---|---|---|---|
| Deformation | 18.7 | 3.2 | 82.9% |
| Slag Inclusion | 12.5 | 1.8 | 85.6% |
| Sand Burn-on | 9.3 | 1.5 | 83.9% |
| Others | 4.5 | 0.5 | 88.9% |
| Total Rejects | 45.0 | 7.0 | 84.4% |
5. Metallurgical Control
The cooling rate equation for pearlitic formation:
$$\frac{dT}{dt} = \frac{\lambda}{\rho c_p}\left(\frac{\partial^2 T}{\partial x^2}\right) \geq 30\ \text{°C/min}$$
Where:
- $\lambda$ = Thermal conductivity (42 W/m·K)
- $\rho$ = Density (7200 kg/m³)
- $c_p$ = Specific heat (620 J/kg·K)
6. Process Implementation Strategy
Our implementation framework for successful lost foam casting production:
- Pattern Quality Assurance
- Dimensional tolerance: ±0.3%
- Surface roughness: Ra ≤ 12.5 μm
- Coating Process Control
- Viscosity: 45-50 s (Ford #4 cup)
- Permeability: ≥2.0 cm³/(cm·min·mmHg)
- Molding Parameters
- Vibration frequency: 50-60 Hz
- Compaction time: 20-25 s
7. Conclusion
The lost foam casting process demonstrates exceptional capability for precision flywheel manufacturing when implementing:
- Strict EPS density control (20-22 g/L)
- Optimized coating thickness (0.7-1.0 mm)
- Scientific gating design ($F_{sprue}:F_{runner}:F_{gate} = 1:1.2:1.5$)
- Controlled cooling rate (≥30 °C/min)
This systematic approach enables production of high-quality flywheels meeting stringent automotive requirements while maintaining 85%+ yield rates in industrial applications.