
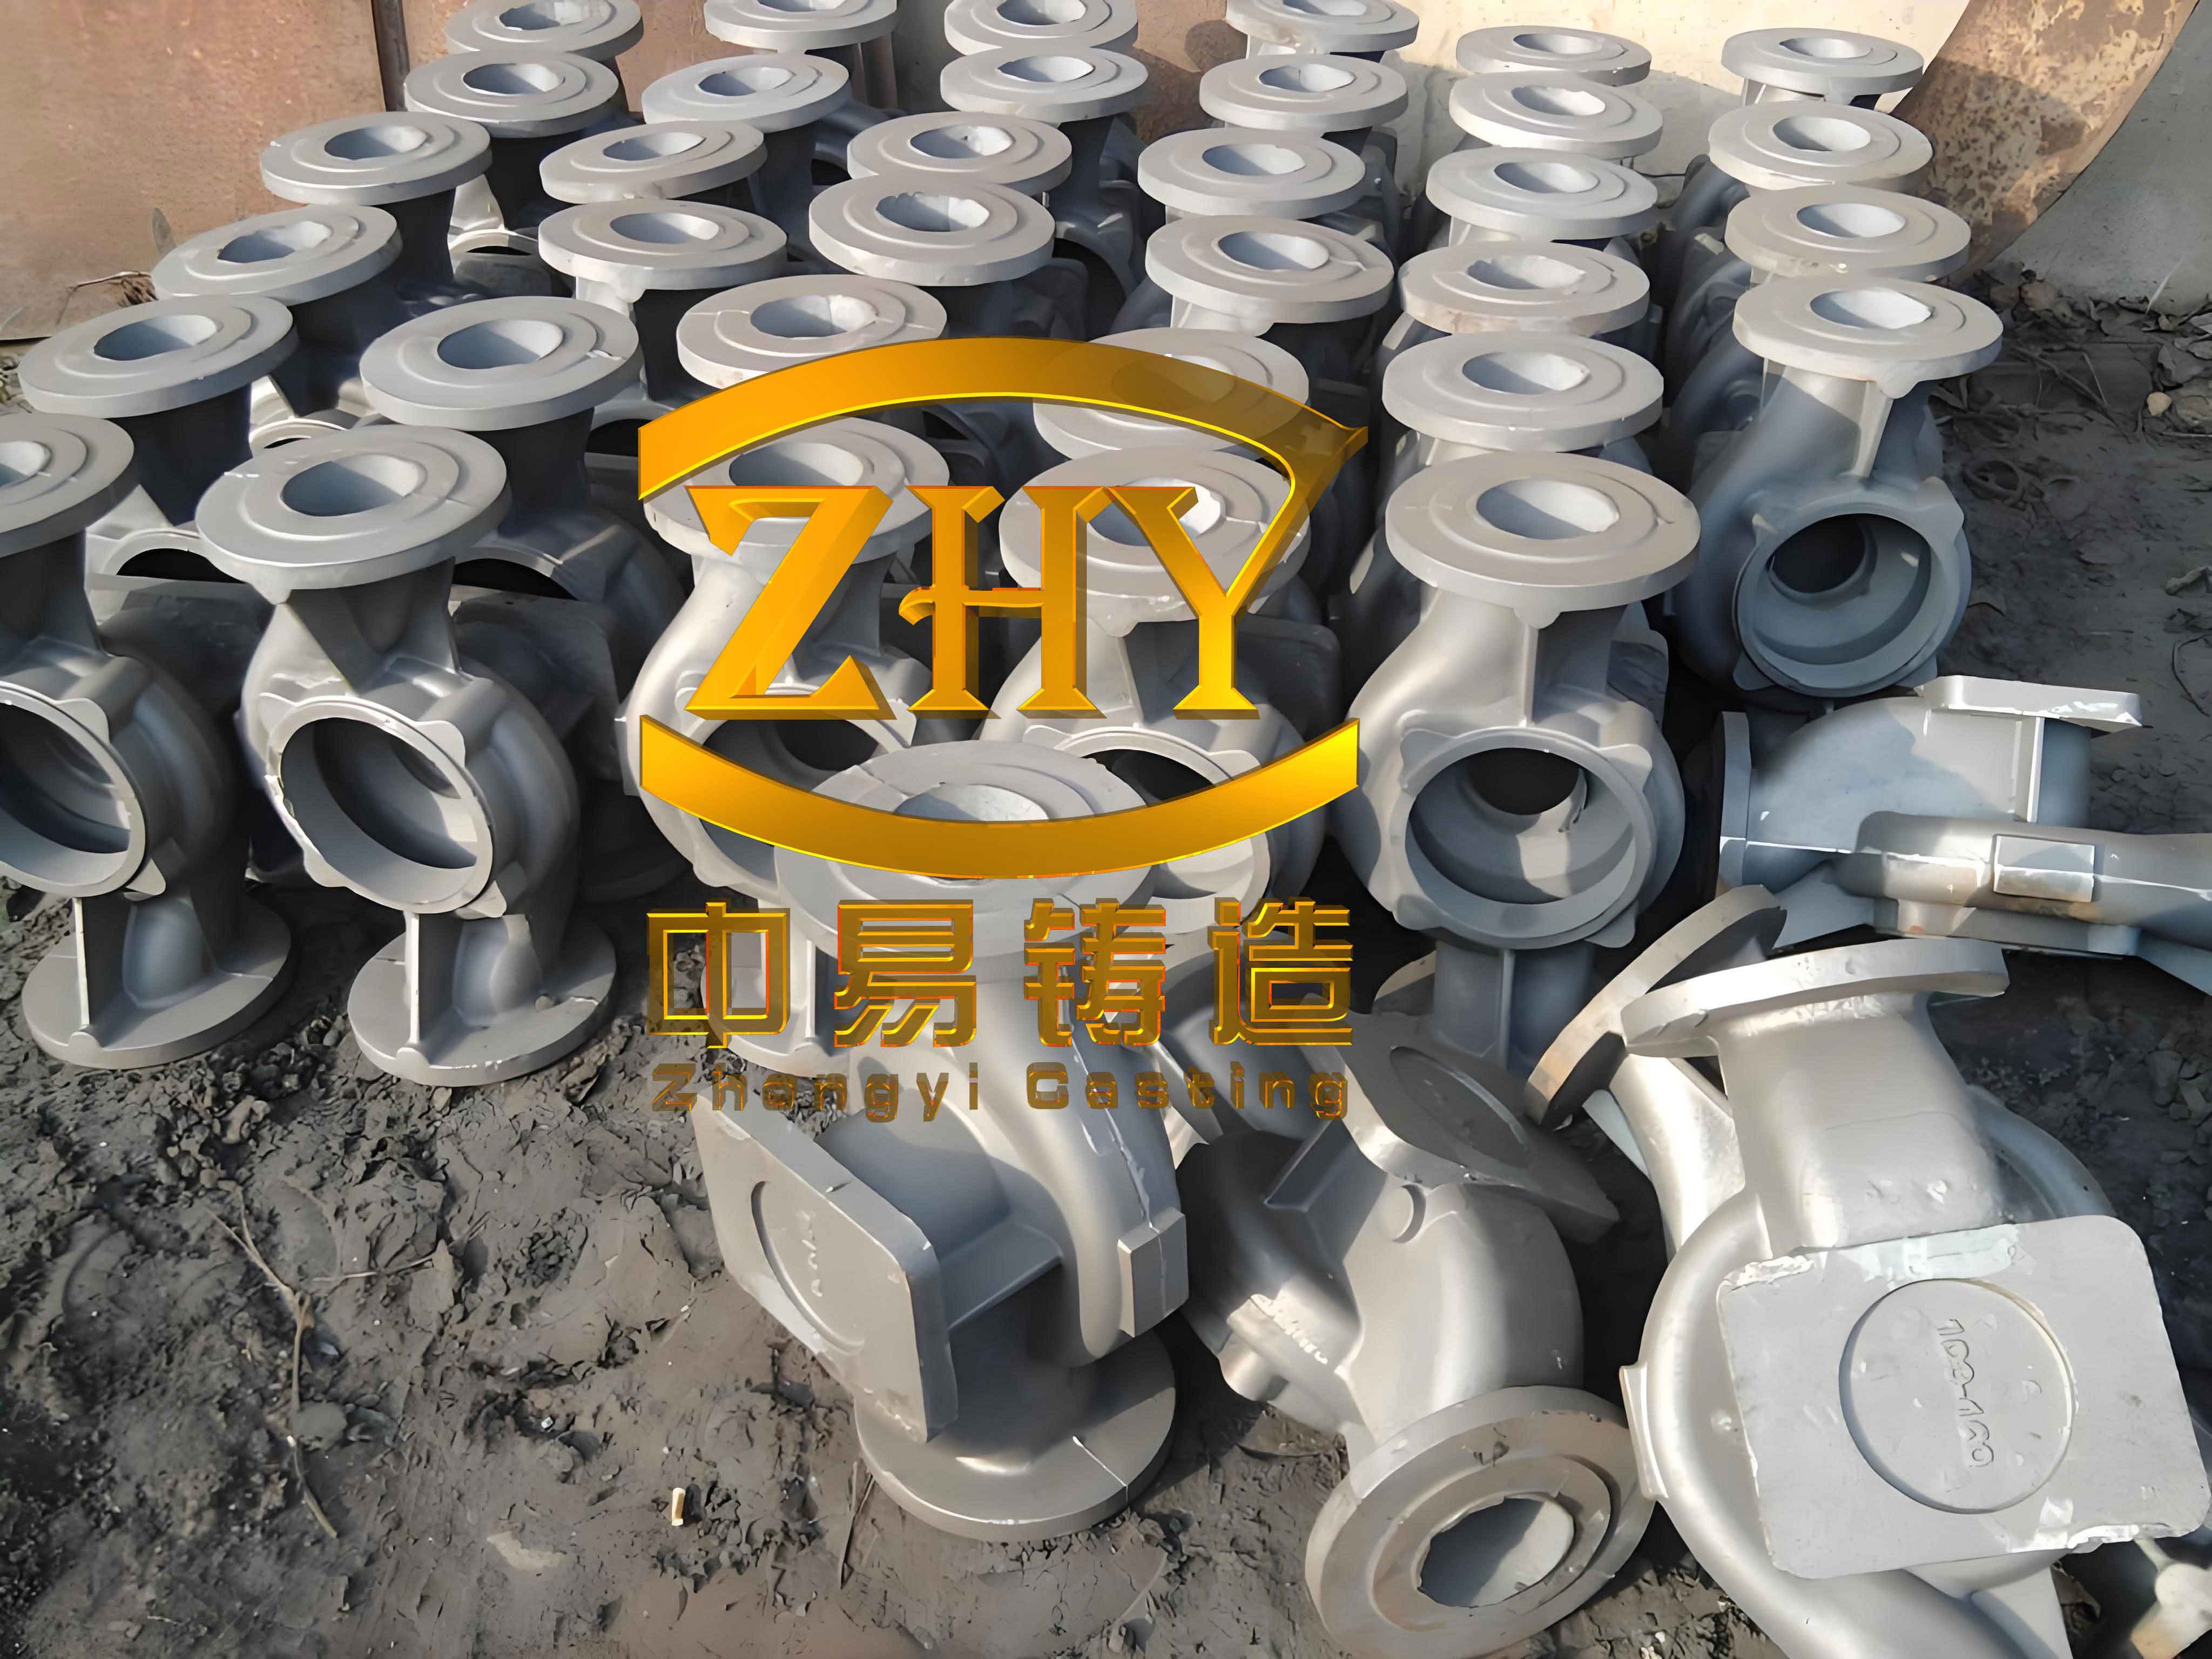
In recent years, the increasing quality consciousness among consumers has led to higher demands from purchasers of gray iron castings. The inspection process has evolved from no testing to batch sampling and finally to individual piece inspection, forming a transition from extensive to intensive production and inspection methods. This progression not only enhances the technical capabilities of foundry enterprises but also improves the intrinsic quality of castings. Attached test blocks are commonly used to assess the performance of gray iron castings. For critical components, there has been a shift from using separately cast test blocks to attached test blocks, as the cooling conditions of attached test blocks closely resemble those of the actual casting, thereby more accurately reflecting the inherent properties of the gray iron casting. However, the positioning of these test blocks is often overlooked by both purchasers and manufacturers. In this study, we examine the impact of the position of attached test blocks on the performance of a 10-ton reciprocating compressor body made of HT250 gray iron, produced in our facility.
The performance of attached test blocks in gray iron castings is influenced not only by chemical composition, inoculation treatment methods, and pouring temperature but also by their location on the casting. Variations in performance across different sections of the same gray iron casting primarily arise from differences in wall thickness, which lead to disparate cooling conditions. These differences result in varying degrees of undercooling at each test block location, ultimately causing variations in pearlite content. Provided that cementite formation is avoided, the performance of test blocks located in thinner sections of the gray iron casting is significantly superior to those in thicker sections.
To investigate this, we selected three compressor bodies of the same model. On each gray iron casting, two attached test blocks were cast at specific wall thicknesses: 45 mm, 80 mm, and 150 mm. The test blocks were labeled as follows: A1 and A2 for the 45 mm wall thickness, B1 and B2 for the 80 mm wall thickness, and C1 and C2 for the 150 mm wall thickness. This setup allowed us to systematically analyze the effects of position on the properties of the gray iron casting.
| Element | C | Si | Mn | P | S |
|---|---|---|---|---|---|
| Content | 3.1 | 1.8 | 0.85 | 0.035 | 0.073 |
The chemical composition of the gray iron casting was carefully controlled to prevent graphite flotation and reduce the risk of shrinkage porosity, especially in thicker sections. The composition is summarized in Table 1. Key elements such as carbon and silicon play a critical role in determining the microstructure and mechanical properties of gray iron. The carbon equivalent (CE) can be calculated using the formula:
$$ CE = C + \frac{Si}{3} $$
For our gray iron casting, the carbon equivalent is approximately 3.7, which is typical for HT250 grade gray iron. This value influences the graphite morphology and matrix structure, ultimately affecting the performance of the gray iron casting.
Temperature control during melting and pouring is crucial for achieving high-quality gray iron castings. Excessive pouring temperatures can lead to mold expansion and defects, particularly in complex sand mold systems. In our process, we utilized induction furnace melting to precisely control the temperature. The tapping temperature was set at 1430°C, while the pouring temperature was maintained at 1368°C. This approach of high-temperature tapping and low-temperature pouring helps minimize defects such as misruns and cold shuts, ensuring the integrity of the gray iron casting.
Inoculation treatment is another vital step in the production of gray iron castings. It reduces the chilling tendency, promotes graphite nucleation, and enhances mechanical properties. We employed stream inoculation at the spout using 75% ferrosilicon (75SiFe) at an addition rate of 0.4%. The effectiveness of inoculation can be described by the inoculation efficiency factor, which relates to the undercooling degree:
$$ \Delta T = T_{eutectic} – T_{actual} $$
where $\Delta T$ is the undercooling, $T_{eutectic}$ is the equilibrium eutectic temperature, and $T_{actual}$ is the actual solidification temperature. Lower undercooling due to effective inoculation results in finer graphite and higher pearlite content, improving the strength and hardness of the gray iron casting.
The wall thickness of the gray iron casting varies significantly, with primary sections at 45 mm, and local areas at 80 mm and 150 mm. These variations directly impact the cooling rate, which can be modeled using the Fourier number for transient heat conduction:
$$ Fo = \frac{\alpha t}{L^2} $$
where $Fo$ is the Fourier number, $\alpha$ is the thermal diffusivity, $t$ is time, and $L$ is the characteristic length (wall thickness). Thicker sections exhibit slower cooling rates, leading to coarser microstructures and lower mechanical properties in the gray iron casting.
The microstructure of the attached test blocks was examined to assess the pearlite content. For the 45 mm wall thickness sections (test blocks A1 and A2), the pearlite content ranged from 75% to 85%. In the 80 mm sections (B1 and B2), the pearlite content decreased to 65%-75%, while in the 150 mm sections (C1 and C2), it further dropped to 55%-65%. This decline in pearlite content with increasing wall thickness is attributed to slower cooling rates, which reduce the undercooling and promote ferrite formation. The relationship between cooling rate and pearlite content can be expressed as:
$$ P = k \cdot \ln\left(\frac{dT}{dt}\right) + C $$
where $P$ is the pearlite content, $k$ is a material constant, $\frac{dT}{dt}$ is the cooling rate, and $C$ is an integration constant. This equation highlights how higher cooling rates in thinner sections of the gray iron casting lead to increased pearlite, enhancing strength and hardness.
| Test Block | Wall Thickness (mm) | Tensile Strength (MPa) | Brinell Hardness (HBW) |
|---|---|---|---|
| A1 | 45 | 235 | 178 |
| A2 | 45 | 242 | 185 |
| B1 | 80 | 199 | 162 |
| B2 | 80 | 193 | 161 |
| C1 | 150 | 152 | 135 |
| C2 | 150 | 147 | 129 |
The mechanical properties of the test blocks, as summarized in Table 2, confirm the direct influence of pearlite content on the performance of the gray iron casting. Tensile strength and hardness decrease with increasing wall thickness, demonstrating the significant effect of cooling conditions. The tensile strength ($R_m$) can be correlated with pearlite content ($P$) using a linear approximation:
$$ R_m = a \cdot P + b $$
where $a$ and $b$ are constants derived from experimental data. For instance, in our gray iron casting, the data suggests that a 10% increase in pearlite content results in approximately a 20-30 MPa increase in tensile strength. Similarly, Brinell hardness ($HB$) follows a similar trend, as hardness is closely related to the matrix strength in gray iron.
To further analyze the cooling behavior, we can consider the solidification time for different wall thicknesses. The solidification time ($t_s$) for a gray iron casting can be estimated using Chvorinov’s rule:
$$ t_s = k \cdot V^n $$
where $V$ is the volume of the casting section, and $k$ and $n$ are constants dependent on the mold material and casting conditions. For sand molds, $n$ is typically around 2. Thicker sections have larger volumes, leading to longer solidification times and slower cooling rates. This results in coarser graphite flakes and lower pearlite content, adversely affecting the mechanical properties of the gray iron casting.
In addition to wall thickness, other factors such as mold material and geometry influence the cooling rate. However, in this study, we focused on the position of the attached test blocks relative to the wall thickness of the gray iron casting. The data clearly shows that test blocks in thinner sections exhibit superior performance due to faster cooling and higher pearlite content. This is critical for applications where high strength and wear resistance are required, such as in compressor bodies made of gray iron.
The implications of these findings are substantial for the production and quality control of gray iron castings. When drafting supply contracts, foundries and purchasers must specify the location of attached test blocks to avoid disputes during performance verification. For example, if test blocks are placed only in thick sections, the measured properties may not represent the overall performance of the gray iron casting, leading to potential rejections or misunderstandings.
Moreover, the use of attached test blocks in gray iron castings provides a more accurate assessment of the casting’s behavior under service conditions. By simulating the cooling environment of specific sections, these test blocks help in predicting the performance of critical areas. This is particularly important for gray iron castings with varying wall thicknesses, as it ensures that the material meets the required specifications throughout the component.
In conclusion, the position of attached test blocks has a profound impact on the performance evaluation of gray iron castings. Variations in wall thickness lead to different cooling conditions, which in turn affect the microstructure and mechanical properties. Thin-walled sections of gray iron castings exhibit higher pearlite content, resulting in improved tensile strength and hardness compared to thick-walled sections. Therefore, it is essential to standardize the placement of attached test blocks in gray iron castings to ensure consistent quality and performance assessment. Future work could explore the effects of alloying elements and advanced inoculation techniques on minimizing property variations in gray iron castings with complex geometries.
To summarize the key relationships, we can derive a comprehensive model for the performance of gray iron castings based on cooling rate and composition. The ultimate tensile strength (UTS) can be expressed as a function of cooling rate ($\dot{T}$) and carbon equivalent (CE):
$$ UTS = A \cdot \ln(\dot{T}) + B \cdot CE + C $$
where $A$, $B$, and $C$ are constants specific to the gray iron grade. Similarly, hardness can be modeled using empirical equations that account for microstructure and cooling parameters. These models aid in optimizing the production process for gray iron castings, ensuring that they meet the demanding requirements of modern applications.
In practice, foundries should implement rigorous process controls, including real-time monitoring of pouring temperatures and cooling rates, to enhance the consistency of gray iron castings. By leveraging data from attached test blocks and advanced simulation tools, manufacturers can predict and mitigate performance variations, leading to higher quality gray iron products. This proactive approach aligns with the industry’s move towards intelligent foundry practices and sustainable manufacturing.
Overall, this study underscores the importance of considering test block position in the quality assurance of gray iron castings. As the industry continues to evolve, such insights will play a pivotal role in advancing the technology and application of gray iron in critical components. The gray iron casting process, when optimized with attention to detail, can yield components with exceptional performance and reliability, meeting the ever-increasing standards of purchasers and end-users alike.