
In this extensive study, we explore the intricacies of the lost foam casting process through numerical simulation, focusing on reducer housings—a critical component in mechanical transmission systems. The lost foam casting process is a modern manufacturing technique that has revolutionized the production of complex metal parts by using expendable foam patterns. However, defects such as gas porosity, misruns, and slag inclusions often arise, compromising product quality and yield. To address these challenges, we employ computational fluid dynamics (CFD) simulations to model the filling stage, providing insights into flow behavior and defect formation. This article details the methodology, mathematical foundations, simulation setup, and results, emphasizing the role of numerical tools in optimizing the lost foam casting process for industrial applications.
The lost foam casting process involves several sequential steps, each influencing the final casting quality. We begin by outlining these steps to contextualize the simulation work. First, foam patterns are fabricated using expandable polystyrene beads in molding machines, precisely replicating the reducer housing geometry. These patterns are then assembled into clusters to form the complete casting model. Next, a refractory coating is applied to the cluster via dipping, brushing, or spraying to enhance surface finish and prevent metal penetration. The coated cluster is placed in a sand flask on a vibration table, where sand is added and compacted to create a rigid mold. A vacuum is applied to evacuate air, consolidating the sand and facilitating metal flow. Finally, molten metal is poured into the mold, followed by cooling and casting removal. Throughout this process, controlling foam decomposition and metal flow is paramount, which is where numerical simulation becomes invaluable.
| Process Step | Description | Key Parameters and Considerations |
|---|---|---|
| Pattern Making | Creation of foam patterns using expandable polystyrene (EPS) beads in specialized molds. The patterns match the exact dimensions of the desired casting, including gating systems. | Foam density (typically 16-24 kg/m³), bead size, molding temperature and pressure, pattern geometry complexity. |
| Cluster Assembly | Multiple foam patterns are bonded together using adhesives to form a cluster, ensuring proper alignment and integrity for casting. | Adhesive type (e.g., hot melt or water-based), curing time, cluster size and weight, assembly precision to avoid gaps. |
| Coating Application | A refractory coating is applied to the cluster to create a barrier between the foam and metal, improving surface quality and reducing gas penetration. | Coating composition (e.g., ceramic, graphite), viscosity, thickness (0.2-0.5 mm), drying method and time, permeability. |
| Vibration Molding | The coated cluster is placed in a flask, and sand is added while vibrating to compact the sand around the pattern, ensuring mold stability. | Vibration frequency (50-100 Hz), amplitude, sand type (e.g., silica sand), sand compaction density, flask design. |
| Vacuum Application | A vacuum pump evacuates air from the sand mold, creating a pressure differential that helps hold the sand in place and aids metal flow. | Vacuum pressure (0.04-0.06 MPa), duration (throughout pouring and initial cooling), vacuum system efficiency. |
| Pouring and Solidification | Molten metal is poured into the mold through the gating system. The foam decomposes upon contact, and the metal fills the cavity, followed by cooling and solidification. | Pouring temperature (e.g., 700-750°C for aluminum alloys), pouring speed, metal composition, cooling rate, defect monitoring. |
To simulate the filling stage in the lost foam casting process, we must first establish the governing equations of fluid dynamics. The molten metal is treated as an incompressible Newtonian fluid, obeying conservation laws of mass, momentum, and energy. These equations form the backbone of our numerical model, allowing us to predict flow patterns and thermal behavior.
The mass conservation equation, or continuity equation, ensures that mass is neither created nor destroyed within a control volume. For an incompressible fluid, where density ρ is constant, the equation simplifies to:
$$ \frac{\partial u}{\partial x} + \frac{\partial v}{\partial y} + \frac{\partial w}{\partial z} = 0 $$
Here, u, v, and w represent the velocity components in the x, y, and z directions, respectively. This equation is fundamental to modeling the flow in the lost foam casting process, as it enforces volume conservation during metal advancement.
Momentum conservation is described by the Navier-Stokes equations, which account for inertial, pressure, gravitational, and viscous forces. In three dimensions, these equations are expressed as:
$$ \rho \left( \frac{\partial u}{\partial t} + u \frac{\partial u}{\partial x} + v \frac{\partial u}{\partial y} + w \frac{\partial u}{\partial z} \right) = -\frac{\partial p}{\partial x} + \rho g_x + \mu \left( \frac{\partial^2 u}{\partial x^2} + \frac{\partial^2 u}{\partial y^2} + \frac{\partial^2 u}{\partial z^2} \right) $$
$$ \rho \left( \frac{\partial v}{\partial t} + u \frac{\partial v}{\partial x} + v \frac{\partial v}{\partial y} + w \frac{\partial v}{\partial z} \right) = -\frac{\partial p}{\partial y} + \rho g_y + \mu \left( \frac{\partial^2 v}{\partial x^2} + \frac{\partial^2 v}{\partial y^2} + \frac{\partial^2 v}{\partial z^2} \right) $$
$$ \rho \left( \frac{\partial w}{\partial t} + u \frac{\partial w}{\partial x} + v \frac{\partial w}{\partial y} + w \frac{\partial w}{\partial z} \right) = -\frac{\partial p}{\partial z} + \rho g_z + \mu \left( \frac{\partial^2 w}{\partial x^2} + \frac{\partial^2 w}{\partial y^2} + \frac{\partial^2 w}{\partial z^2} \right) $$
In these equations, ρ is the fluid density, p is the pressure, g_x, g_y, g_z are gravitational accelerations, and μ is the dynamic viscosity. The terms on the left represent convective acceleration, while those on the right account for pressure gradients, body forces, and viscous diffusion. These equations are crucial for simulating velocity fields and pressure distributions in the lost foam casting process.
Energy conservation is vital for modeling heat transfer during casting, as the metal loses heat to the mold and foam. The energy equation incorporates conduction, convection, and source terms:
$$ \rho c \left( \frac{\partial T}{\partial t} + u \frac{\partial T}{\partial x} + v \frac{\partial T}{\partial y} + w \frac{\partial T}{\partial z} \right) = \frac{\partial}{\partial x} \left( k \frac{\partial T}{\partial x} \right) + \frac{\partial}{\partial y} \left( k \frac{\partial T}{\partial y} \right) + \frac{\partial}{\partial z} \left( k \frac{\partial T}{\partial z} \right) + S $$
Here, c is the specific heat capacity, k is the thermal conductivity, T is the temperature, and S is a source term that may include latent heat release during solidification or heat generation from foam decomposition. This equation enables us to track temperature gradients and predict solidification fronts in the lost foam casting process.
A key aspect of the lost foam casting process is the generation of gases from foam decomposition, which occupy the gap between the metal and foam surfaces. This gas layer exerts pressure on the metal front, influencing flow dynamics and defect formation. The pressure P in the gap is a function of temperature T, volume V, and the number of moles n of gas, as described by the ideal gas law:
$$ P V = n R T $$
where R is the universal gas constant. However, under high-temperature conditions and with complex gas compositions, deviations from ideality may occur. Therefore, we use a generalized formulation:
$$ P = f(T, V, n) $$
To compute P dynamically, we track T, V, and n using auxiliary equations. The gas volume V is derived from the geometry of the metal-foam interface, which is captured by the Volume of Fluid (VOF) method. The temperature T is obtained from energy conservation, and n is calculated from foam decomposition rates. The foam decomposition rate can be modeled as:
$$ \frac{dn}{dt} = A \cdot k_0 \cdot e^{-E_a / (R T)} $$
where A is the surface area, k_0 is a pre-exponential factor, and E_a is the activation energy for decomposition. This integrated approach allows us to simulate the transient pressure variations in the lost foam casting process.
For numerical implementation, we employ the SOLA-VOF (Solution Algorithm-Volume of Fluid) method, which is well-suited for free-surface flows with moving boundaries. The VOF function F(x, y, t) represents the volume fraction of metal in each computational cell: F = 1 for cells full of metal, F = 0 for empty cells, and 0 < F < 1 for cells containing the interface. The evolution of F is governed by:
$$ \frac{\partial F}{\partial t} + \nabla \cdot (F \mathbf{u}) = 0 $$
where \(\mathbf{u}\) is the velocity vector. This equation ensures that the interface is accurately tracked as metal advances through the foam. The SOLA algorithm solves the pressure-velocity coupling iteratively, ensuring mass and momentum conservation. In our simulation, we incorporate a two-dimensional model that includes heat transfer and foam decomposition, with boundary conditions tailored to the lost foam casting process.
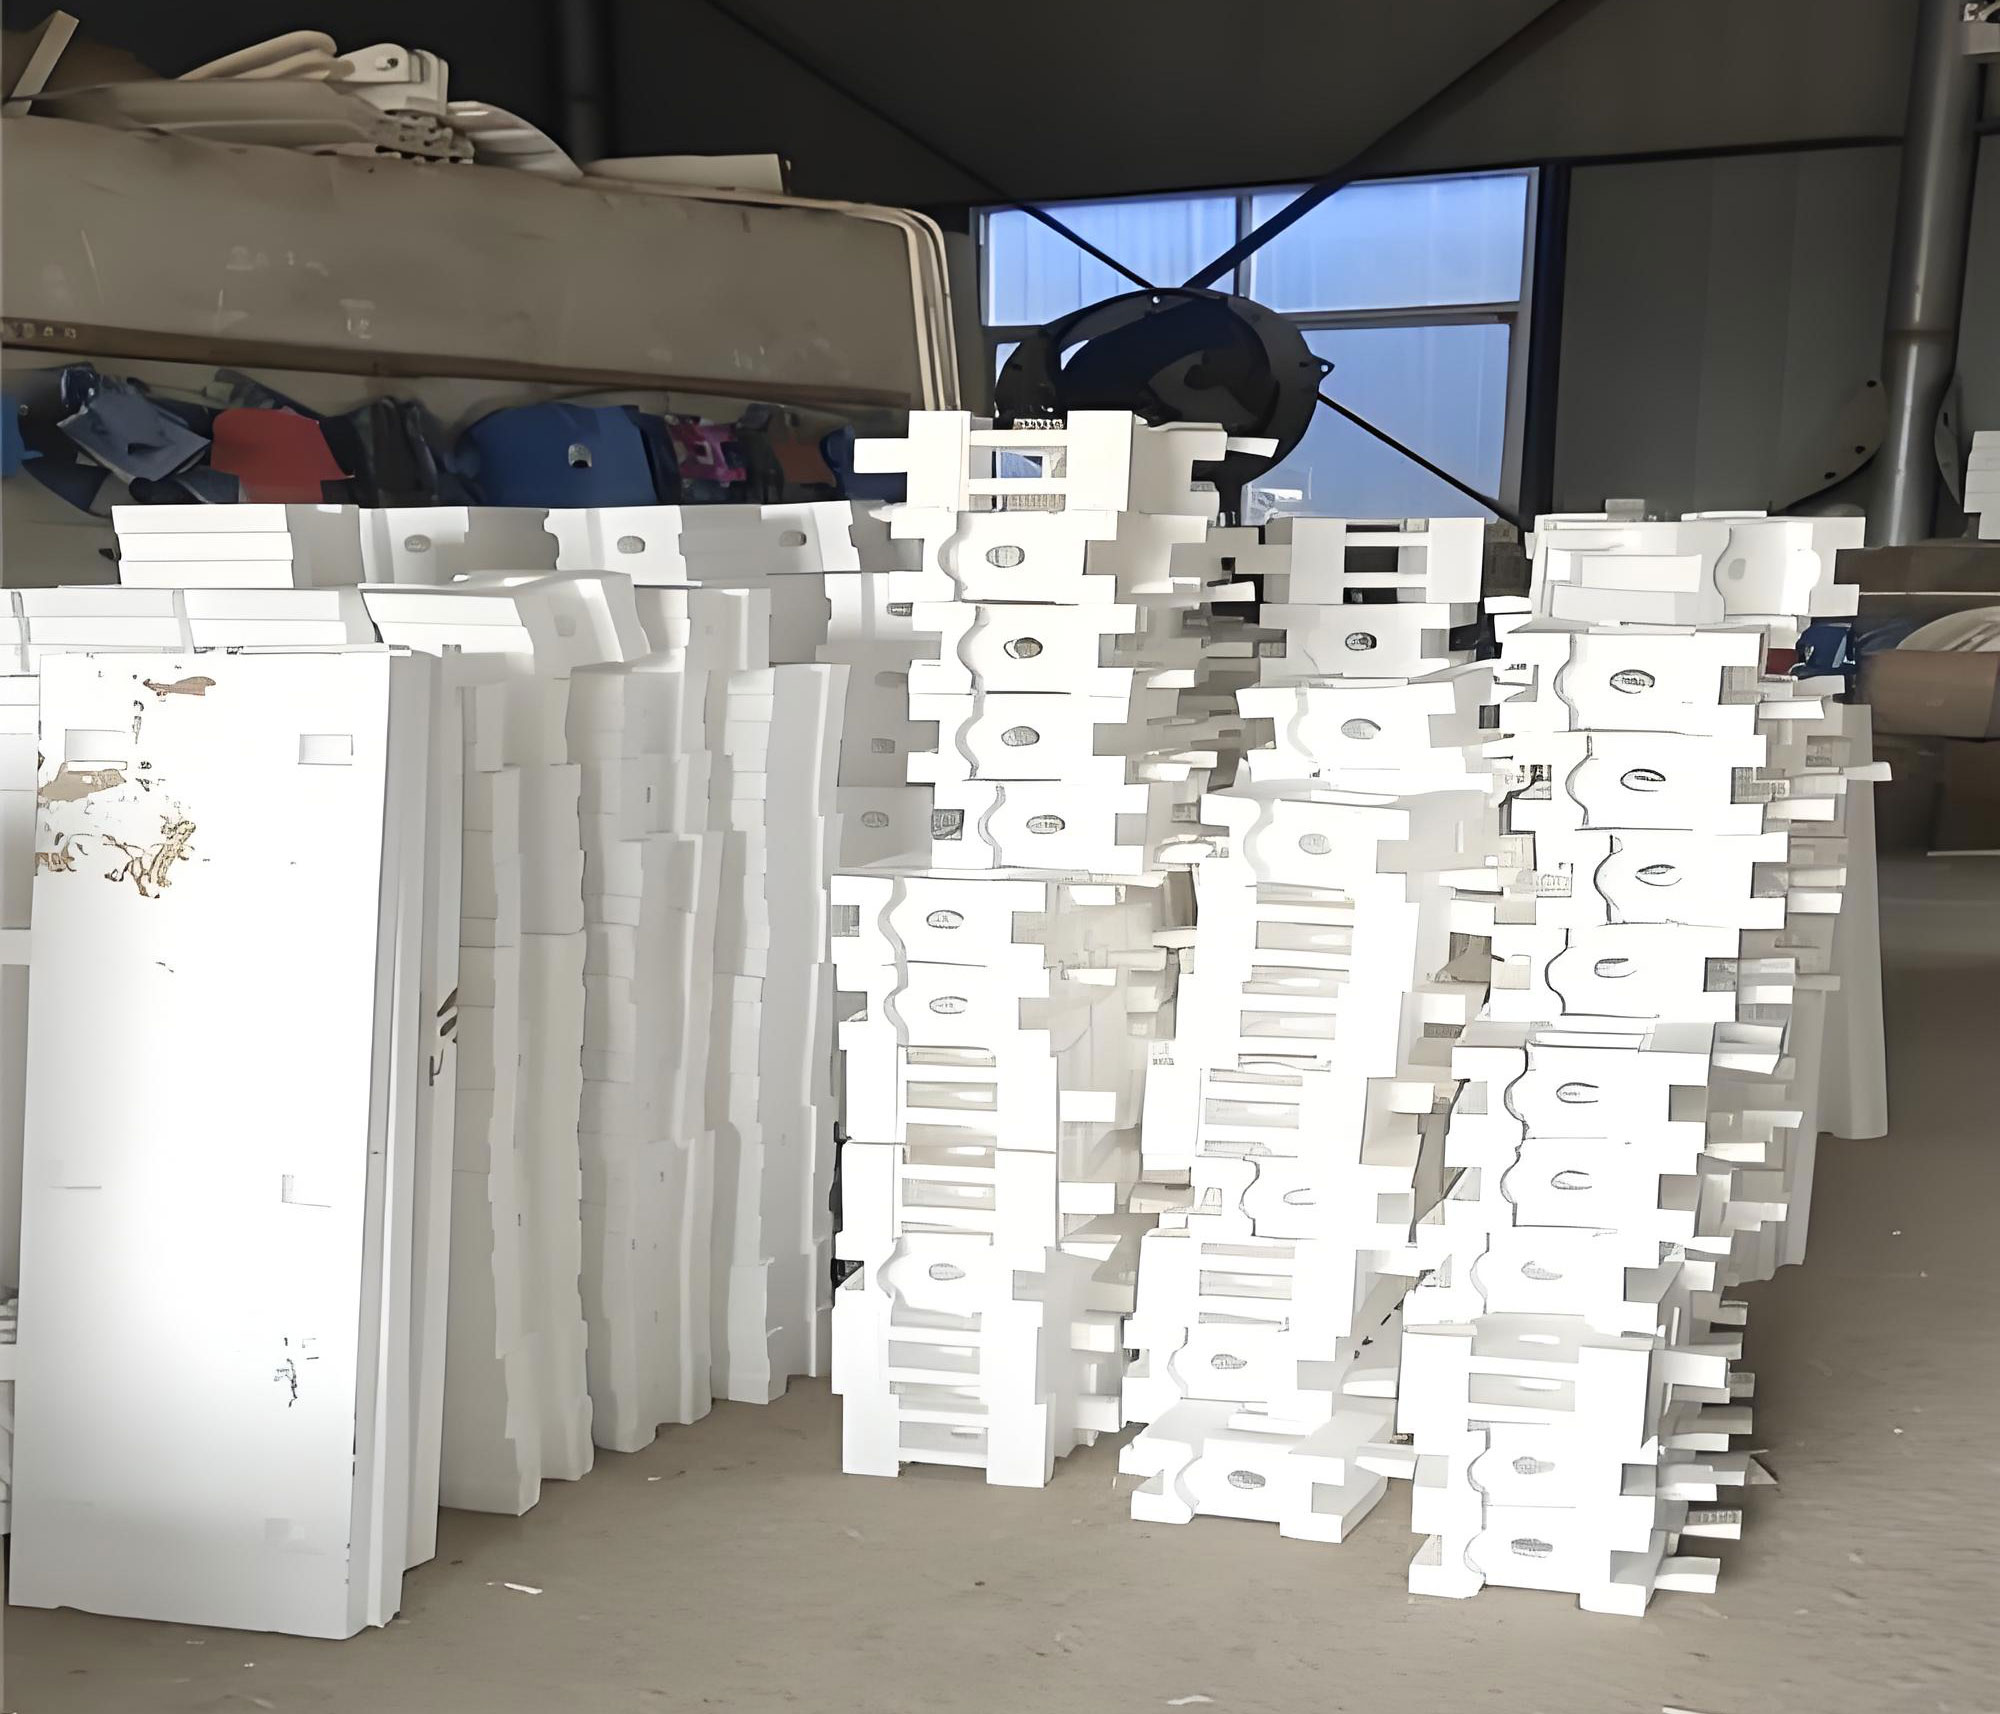
The image above illustrates a typical setup in the lost foam casting process, showing a foam pattern embedded in sand with a gating system. Such visual aids help in understanding the physical context of our simulations. For our numerical study, we define a simplified 2D geometry representing a vertical section of the reducer housing mold, with a gating inlet at the bottom. The inlet velocity is calculated using Bernoulli’s equation to account for pressure differences:
$$ u_{in} = \sqrt{ \frac{2}{K} \left( \frac{P_0 – P_s}{\rho} + g (z_0 – z_s) \right) } $$
where P_0 and z_0 are the pressure and height at the inlet, P_s and z_s are the pressure and height inside the domain, and K is a loss coefficient accounting for friction and turbulence. This boundary condition ensures realistic inflow conditions for the lost foam casting process simulation.
We now present the simulation parameters used in our study, which are based on typical values for aluminum alloy castings in the lost foam casting process. These parameters are summarized in the table below.
| Parameter | Symbol | Value | Unit | Remarks |
|---|---|---|---|---|
| Initial Gas Temperature | T_1 | 150 | °C | Assumed based on pre-heating conditions |
| Gas Dynamic Viscosity | μ_g | 0.8 | m²/s | Approximated for decomposition gases |
| Coating Thickness | Z_c | 0.3 × 10⁻³ | m | Typical range for refractory coatings |
| Foam Density | ρ_F | 16 | kg/m³ | For expandable polystyrene patterns |
| Metal Density | ρ | 7.3 × 10³ | kg/m³ | Aluminum alloy density |
| Filling Velocity | v_c | 0.5 | m/s | Controlled pouring speed |
| Filling Time | t_f | 22 | s | Total simulated filling duration |
| Contact Surface Area | A_c | 0.13 | m² | Estimated from pattern geometry |
| Metal Flow Depth | L | 142 | mm | Depth of the cavity in 2D model |
| Thermal Conductivity of Metal | k_m | 150 | W/(m·K) | For aluminum alloy |
| Specific Heat of Metal | c_m | 900 | J/(kg·K) | Typical value for aluminum |
| Foam Deactivation Energy | E_a | 1.5 × 10⁵ | J/mol | From kinetic studies of EPS decomposition |
Using these parameters, we conducted transient simulations to analyze the filling behavior in the lost foam casting process. The results reveal dynamic changes in the gap between the metal and foam surfaces. Initially, as molten metal contacts the foam, rapid decomposition occurs, generating gases that expand the gap. The gap volume V_g increases with time due to high metal velocity and limited contact area. Mathematically, this can be expressed as:
$$ \frac{dV_g}{dt} = k_1 \cdot A_c \cdot (T_m – T_d) \quad \text{for} \quad t < t_c $$
where k_1 is a proportionality constant, A_c is the contact area, T_m is the metal temperature, T_d is the foam decomposition temperature, and t_c is a critical time. As filling progresses, the foam is progressively consumed, and the gap volume begins to decrease in the later stages because the metal front envelops the remaining foam, reducing the available space for gas accumulation. This phase is described by:
$$ \frac{dV_g}{dt} = -k_2 \cdot V_g \cdot \frac{1}{t} \quad \text{for} \quad t > t_c $$
where k_2 is another constant. These dynamics directly impact the gas pressure P in the gap, which we calculate using the ideal gas law. The pressure variations influence metal flow, potentially causing turbulence or gas entrapment, leading to defects in the lost foam casting process.
To quantify these effects, we monitored key variables over time. The table below summarizes the simulation outcomes at selected time intervals, highlighting the interplay between gap volume, pressure, and metal front position.
| Time (s) | Metal Front Position (mm) | Gap Volume V_g (cm³) | Gas Pressure P (kPa) | Observations |
|---|---|---|---|---|
| 0 | 0 | 0 | 101.3 | Initial state, atmospheric pressure |
| 5 | 25 | 12.5 | 125.6 | Gap volume increasing, pressure rising |
| 10 | 55 | 28.3 | 142.7 | Peak gap volume approached |
| 15 | 90 | 22.1 | 135.2 | Gap volume decreasing, pressure stabilizing |
| 20 | 130 | 10.8 | 118.9 | Near complete filling, gap diminishing |
| 22 | 142 | 5.2 | 110.5 | Filling completed, residual gas trapped |
The data indicates that the gap volume peaks around 10 seconds, coinciding with intense foam decomposition. Subsequently, as the metal covers more foam surface, the gap shrinks, reducing pressure. These trends are critical for understanding defect mechanisms in the lost foam casting process. For instance, if the gap volume remains large near the end of filling, gas may be trapped, forming porosity. Conversely, rapid pressure drops can cause mistruns due to inadequate metal flow.
Furthermore, we analyzed velocity vectors and temperature contours to assess flow uniformity and cooling patterns. The simulations showed that in the lost foam casting process, the metal front advances unevenly, with faster flow along the walls due to gravity and pressure gradients. This can lead to vortex formation, which may entrain gas or coating particles, resulting in slag inclusions. Temperature plots revealed that the metal cools faster near the mold walls, potentially causing premature solidification and shrinkage defects. These insights underscore the complexity of the lost foam casting process and the need for precise control.
Based on our findings, we propose several optimization strategies for the lost foam casting process. First, adjusting the pouring speed can modulate the gap dynamics: a slower initial pour may reduce gas generation, while a faster later pour can ensure complete filling. Second, modifying the foam density or coating permeability can alter gas escape routes, minimizing pressure buildup. Third, optimizing the gating design—such as using multiple ingates or risers—can promote laminar flow and reduce turbulence. These improvements can be tested virtually through further simulations, reducing trial-and-error in actual production.
In addition to filling simulation, we extended our model to include solidification analysis, which is integral to the lost foam casting process. The energy equation coupled with a phase-change model allows us to predict shrinkage and microporosity. The governing equation for solidification incorporates latent heat release:
$$ \rho L \frac{\partial f_s}{\partial t} = \nabla \cdot (k \nabla T) $$
where L is the latent heat of fusion, and f_s is the solid fraction. By solving this alongside the flow equations, we can identify regions prone to shrinkage defects, enabling targeted use of chills or risers. This holistic approach enhances the predictive capability of simulations for the lost foam casting process.
Comparing our work with existing literature, we note that while many studies focus on traditional casting methods, few delve deeply into numerical simulation of the lost foam casting process for complex parts like reducer housings. Our use of SOLA-VOF with integrated foam decomposition models advances the state of the art, providing a more accurate representation of the metal-foam interaction. Future research could explore three-dimensional simulations, advanced turbulence models, and coupled structural analysis to predict residual stresses and distortion in the lost foam casting process.
In conclusion, this comprehensive study demonstrates the efficacy of numerical simulation in analyzing and optimizing the lost foam casting process for reducer housings. Through detailed mathematical modeling and computational analysis, we have elucidated the dynamics of gap volume and pressure during filling, linking them to defect formation. The SOLA-VOF method proved robust in tracking free surfaces and incorporating foam decomposition effects. Our results highlight that in the initial stage, gap volume increases with time, while in the final stage, it decreases, a behavior that must be managed to ensure casting quality. By leveraging such simulations, manufacturers can preemptively address issues, reduce scrap rates, and enhance the efficiency of the lost foam casting process. As computational power grows, so too will the fidelity and applicability of these tools, paving the way for smarter, more sustainable casting practices.
To further aid practitioners, we recommend regular validation of simulation models with experimental data, such as flow visualization or pressure measurements in actual lost foam casting process setups. Additionally, sensitivity analyses on key parameters like coating thickness or foam density can reveal optimal operating windows. Ultimately, the integration of numerical simulation into the design and production cycle holds immense potential for advancing the lost foam casting process across various industries, from automotive to aerospace, where high-integrity castings are paramount.