
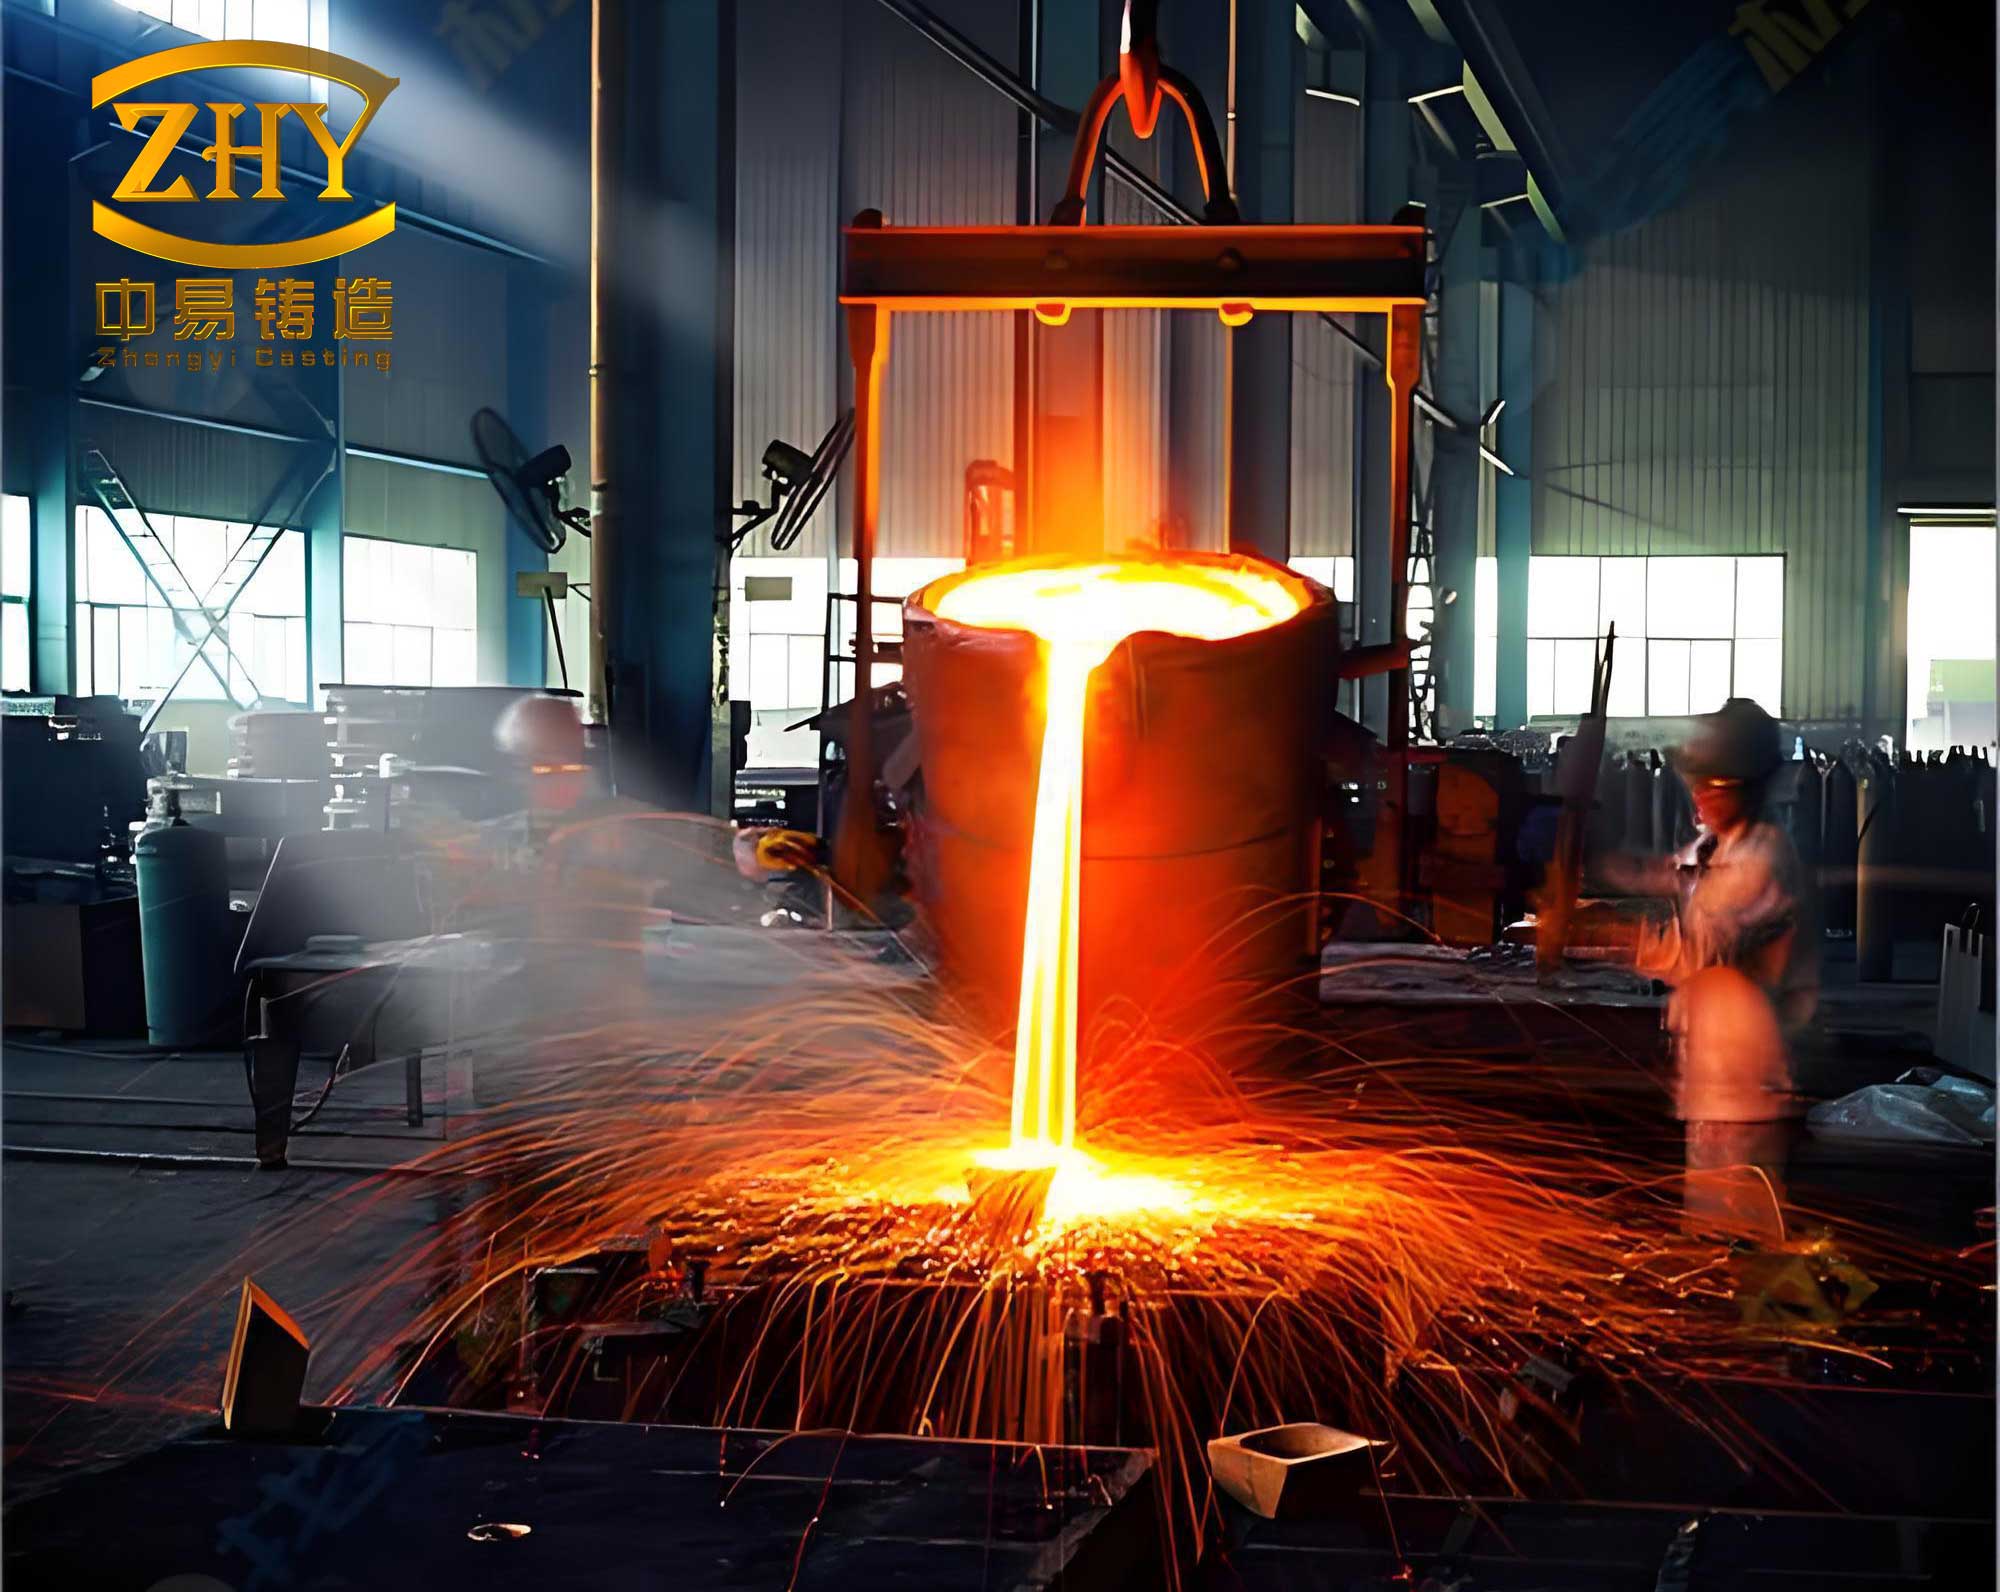
In the competitive landscape of modern manufacturing, the imperative for operational excellence and stringent quality control is paramount. Our foundry, like many others, operates under the constant pressure to reduce costs and enhance efficiency. A significant obstacle to achieving these goals was the persistently high scrap rate of a critical cylinder head casting part. This component is essential for engine assembly, and its failure not only incurred substantial direct costs through material and labor waste but also threatened production schedules and customer satisfaction. The baseline scrap rate for this complex casting part stood at an unacceptable 9.3%, signaling a deep-rooted process inefficiency that demanded a structured, data-driven approach for resolution. We turned to the Six Sigma DMAIC (Define, Measure, Analyze, Improve, Control) methodology to systematically diagnose and cure the ailments plaguing our production line for this specific casting part.
The Define Phase: Clarifying the Problem and Setting the Target
The first step in our journey was to precisely define the problem. A vague notion of “high scrap” is insufficient for a Six Sigma project. We needed to identify the specific failure modes affecting our casting part. We collected historical defect data from several production batches and performed a Pareto analysis. The Pareto principle, often called the 80/20 rule, was instrumental in focusing our efforts. The analysis clearly revealed that two defect types were responsible for the majority of losses in this casting part.
| Defect Type | Count | Percentage (%) | Cumulative Percentage (%) |
|---|---|---|---|
| Sand Inclusion (Y1) | 19 | 54.3 | 54.3 |
| Slag Inclusion (Y2) | 10 | 28.6 | 82.9 |
| Broken Core | 2 | 5.7 | 88.6 |
| Sand Expansion | 2 | 5.7 | 94.3 |
| Core Shift | 1 | 2.9 | 97.1 |
| Other | 1 | 2.9 | 100.0 |
The table above shows that Sand Inclusions (cavities in the casting part filled with sand) and Slag Inclusions (non-metallic impurities trapped within or on the surface) together accounted for 82.9% of all rejected casting parts. Therefore, we defined our project’s Critical-to-Quality (CTQ) characteristic as the reduction of these two specific defects. Our project goal was formally established: to reduce the overall scrap rate of the cylinder head casting part from the baseline of 9.3% to below 2.0%.
The Measure Phase: Ensuring Accuracy and Identifying Potential Causes
Before analyzing root causes, we had to ensure our measurement system was reliable. Defect identification for this casting part was primarily visual. We conducted a Measurement System Analysis (MSA) for attribute data, specifically an Attribute Agreement Analysis. Three inspectors independently evaluated 30 casting parts (25 known good, 5 borderline) twice in a randomized sequence. The assessment looked at agreement between each inspector’s repeated assessments (within-appraiser), agreement between different inspectors (between-appraiser), and agreement of each inspector with a known standard. The results are summarized by the Kappa statistic (κ), a measure of agreement beyond chance. For a measurement system to be considered acceptable, κ should be greater than 0.8.
| Agreement Type | Kappa (κ) Statistic | Assessment |
|---|---|---|
| Within-Appraiser | 0.92, 0.89, 0.94 | Acceptable |
| Between-Appraiser | 0.87 | Acceptable |
| Appraiser vs. Standard | 0.91, 0.85, 0.93 | Acceptable |
With a validated measurement system, we proceeded to map the entire production process for the cylinder head casting part. Using tools like Process Flow Diagrams and Cause & Effect matrices, we brainstormed and listed over 70 potential input factors (X’s) from the categories of Man, Machine, Material, Method, and Environment that could influence our output defects (Y’s: Sand and Slag Inclusion). A Failure Mode and Effects Analysis (FMEA) helped us prioritize these based on Severity, Occurrence, and Detectability. This rigorous screening narrowed the list down to seven key process input variables (KPIVs) for further investigation.
| Factor Code | Process Step | Input Factor (X) | Potential Impact on Defect (Y) | Action Plan |
|---|---|---|---|---|
| X1 | Core Making | Sand Core Curing Time | Sand Inclusion (Y1) | Analyze in Detail |
| X2 | Mold Assembly | Chill Coat Cleanliness | Y1 & Y2 | Immediate “Quick Win” |
| X3 | Mold Assembly | Gating System Coating | Y1 & Y2 | Immediate “Quick Win” |
| X4 | Pouring | Pouring Temperature | Slag Inclusion (Y2) | Analyze in Detail |
| X5 | Pouring | Pouring Time | Slag Inclusion (Y2) | Analyze in Detail |
| X6 | Pouring | Sprue Basin Design | Slag Inclusion (Y2) | Analyze in Detail |
| X7 | Pouring | Sprue Basin Tilt Height | Slag Inclusion (Y2) | Analyze in Detail |
We implemented two “Quick Win” improvements immediately. For X2, we enhanced the procedure for cleaning the chill coat before mold assembly. For X3, we added a step to apply a protective refractory wash to vulnerable areas of the gating system in the mold for this casting part. These simple changes yielded initial results, reducing the scrap rate slightly from 9.3% to approximately 8.3%, proving that focused attention on process steps could improve the quality of the casting part.
The Analyze Phase: Statistical Validation of Root Causes
This phase aimed to statistically verify which of the remaining five factors (X1, X4, X5, X6, X7) had a significant effect on the scrap rate of our casting part. We employed hypothesis testing and designed experiments.
For X1 (Core Curing Time): We hypothesized that curing time affects core strength, which influences sand washout (Y1). We performed a Chi-Square test comparing scrap rates across different curing time brackets. The test statistic is calculated as:
$$ \chi^2 = \sum \frac{(O_i – E_i)^2}{E_i} $$
where $O_i$ is the observed frequency of defective casting parts and $E_i$ is the expected frequency. The resulting p-value was 0.036, which is less than the standard alpha level of 0.05. This provided statistical evidence that sand core curing time significantly impacts the sand inclusion defect in the final casting part.
For X4 (Pouring Temperature) & X5 (Pouring Time): We initially analyzed these separately. A Chi-Square test for pouring temperature (comparing scrap counts between 1370-1375°C and 1376-1380°C) yielded a p-value of 0.048, indicating significance for slag formation and inclusion in the casting part. Pouring time was analyzed based on engineering principles: too fast could cause turbulence and erosion, too slow could lead to premature freezing and trapped slag.
For X6 (Sprue Basin Design) & X7 (Sprue Basin Tilt Height): We tested a new sprue basin with a filter (X6) versus the old design. A Chi-Square test showed no significant difference (p-value = 0.830). For X7, we tested different tilt heights (0mm, 30mm) during pouring. The Chi-Square test yielded a p-value of 0.037, confirming that the tilt height during the pour significantly affects slag inclusion rates in the casting part.
After the Analyze phase, we had strong evidence that four key factors were critical for the quality of this casting part: X1 (Core Curing Time), X4 (Pouring Temperature), X5 (Pouring Time), and X7 (Sprue Basin Tilt Height).
The Improve Phase: Optimizing the Critical Parameters
Now we needed to find the optimal settings for these significant factors to minimize defects in the casting part.
Optimizing X1 (Core Curing Time): We conducted a one-factor experiment, testing different curing time windows. The data revealed that a curing time between 100 and 160 seconds produced cores with optimal strength and minimal gas generation, leading to the lowest incidence of sand-related defects in the subsequent casting part.
Optimizing X4 & X5 (Pouring Temperature and Time): Since these two factors likely interact (e.g., higher temperature might allow for a slightly longer pour), we designed a two-level factorial Design of Experiments (DOE). We defined low and high levels for each factor and included center points to check for curvature.
| Factor | Low Level (-1) | High Level (+1) |
|---|---|---|
| X4: Pouring Temperature | 1370 – 1375 °C | 1376 – 1380 °C |
| X5: Pouring Time | 25 – 30 seconds | 31 – 36 seconds |
The response variable (Y) was the proportion of defective casting parts. We used Minitab to analyze the DOE data. The analysis of variance (ANOVA) showed significant main effects and a significant interaction. The model can be represented as:
$$ y = \beta_0 + \beta_1 x_1 + \beta_2 x_2 + \beta_{12} x_1 x_2 + \epsilon $$
where $y$ is the defect rate, $x_1$ and $x_2$ are coded units for temperature and time, and $\beta_{12}$ is the interaction coefficient. The response optimizer tool pinpointed the best combination: a Pouring Temperature of 1376-1380°C and a Pouring Time of 31-36 seconds. This combination minimized turbulence and promoted smooth, slag-free filling of the mold cavity for this specific casting part geometry.
Optimizing X7 (Sprue Basin Tilt Height): We conducted a one-way ANOVA experiment comparing four tilt heights: 0mm, 30mm, 50mm, and 80mm. The ANOVA result (p-value = 0.016) confirmed a statistically significant difference in the mean defect rate of the casting part across the levels. A subsequent multiple comparisons test (like Tukey’s HSD) and boxplot analysis clearly indicated that an 80mm tilt height provided the best performance, likely by creating a smoother, more controlled metal entry that reduced slag entrainment.
The Control Phase: Sustaining the Gains
The final phase ensures that the improvements are institutionalized and the new scrap rate for the casting part is maintained. We developed a comprehensive control plan detailing the optimized parameters, measurement methods, and reaction plans should the process drift.
- Updated Standard Operating Procedures (SOPs): All work instructions for core making, mold assembly, and pouring were revised to reflect the new optimal parameters: curing time (100-160s), pouring temperature (1376-1380°C), pouring time (31-36s), and sprue basin tilt (80mm).
- Statistical Process Control (SPC): Control charts, specifically p-charts for the overall scrap rate of the casting part and Xbar-R charts for critical process variables like pouring temperature, were implemented for ongoing monitoring.
- Regular Audits: Scheduled audits were established to verify adherence to the new procedures and the control plan.
The results were dramatic and sustained. We tracked the performance of the cylinder head casting part for five months following implementation. The overall scrap rate plummeted and stabilized.
| Performance Metric | Baseline (Before DMAIC) | Result (After DMAIC & Control) |
|---|---|---|
| Overall Scrap Rate | 9.30% | 1.92% |
| Scrap Rate due to Sand Inclusion (Y1) | ~5.04% | <0.8% |
| Scrap Rate due to Slag Inclusion (Y2) | ~4.26% | <0.7% |
The project not only achieved but surpassed its goal of reducing the scrap rate below 2.0%. This translated into direct financial savings from reduced waste and rework. More importantly, it led to intangible benefits: reliable production flow, on-time delivery to customers, and enhanced reputation for producing high-quality, reliable casting parts. The systematic DMAIC approach provided a robust framework that moved our team from fighting symptoms to understanding and controlling the fundamental process variables that dictate the quality of a complex casting part. This methodology has since become a blueprint for tackling other quality challenges within our foundry operations.