
In my experience with ductile iron casting production, achieving defect-free components, especially for large thin-walled structures, remains a significant challenge. This article details a case where I addressed shrinkage cavities in a ductile iron box cover through computer-aided engineering (CAE) simulation and targeted process modifications. The focus is on leveraging simulation to understand defect formation and implement corrective measures, emphasizing the critical role of controlled solidification in ductile iron casting.
The subject component was a large box cover for a power locomotive, manufactured from ductile iron grade QT400-15. Its dimensions were approximately 1500 mm in diameter and 700 mm in height, with an average wall thickness of 20 mm and a final casting weight of 680 kg. Quality specifications mandated ultrasonic non-destructive testing with no allowance for shrinkage porosity or cavities, and the radiographic testing (RT) classification had to be CC2 or better across the entire casting.
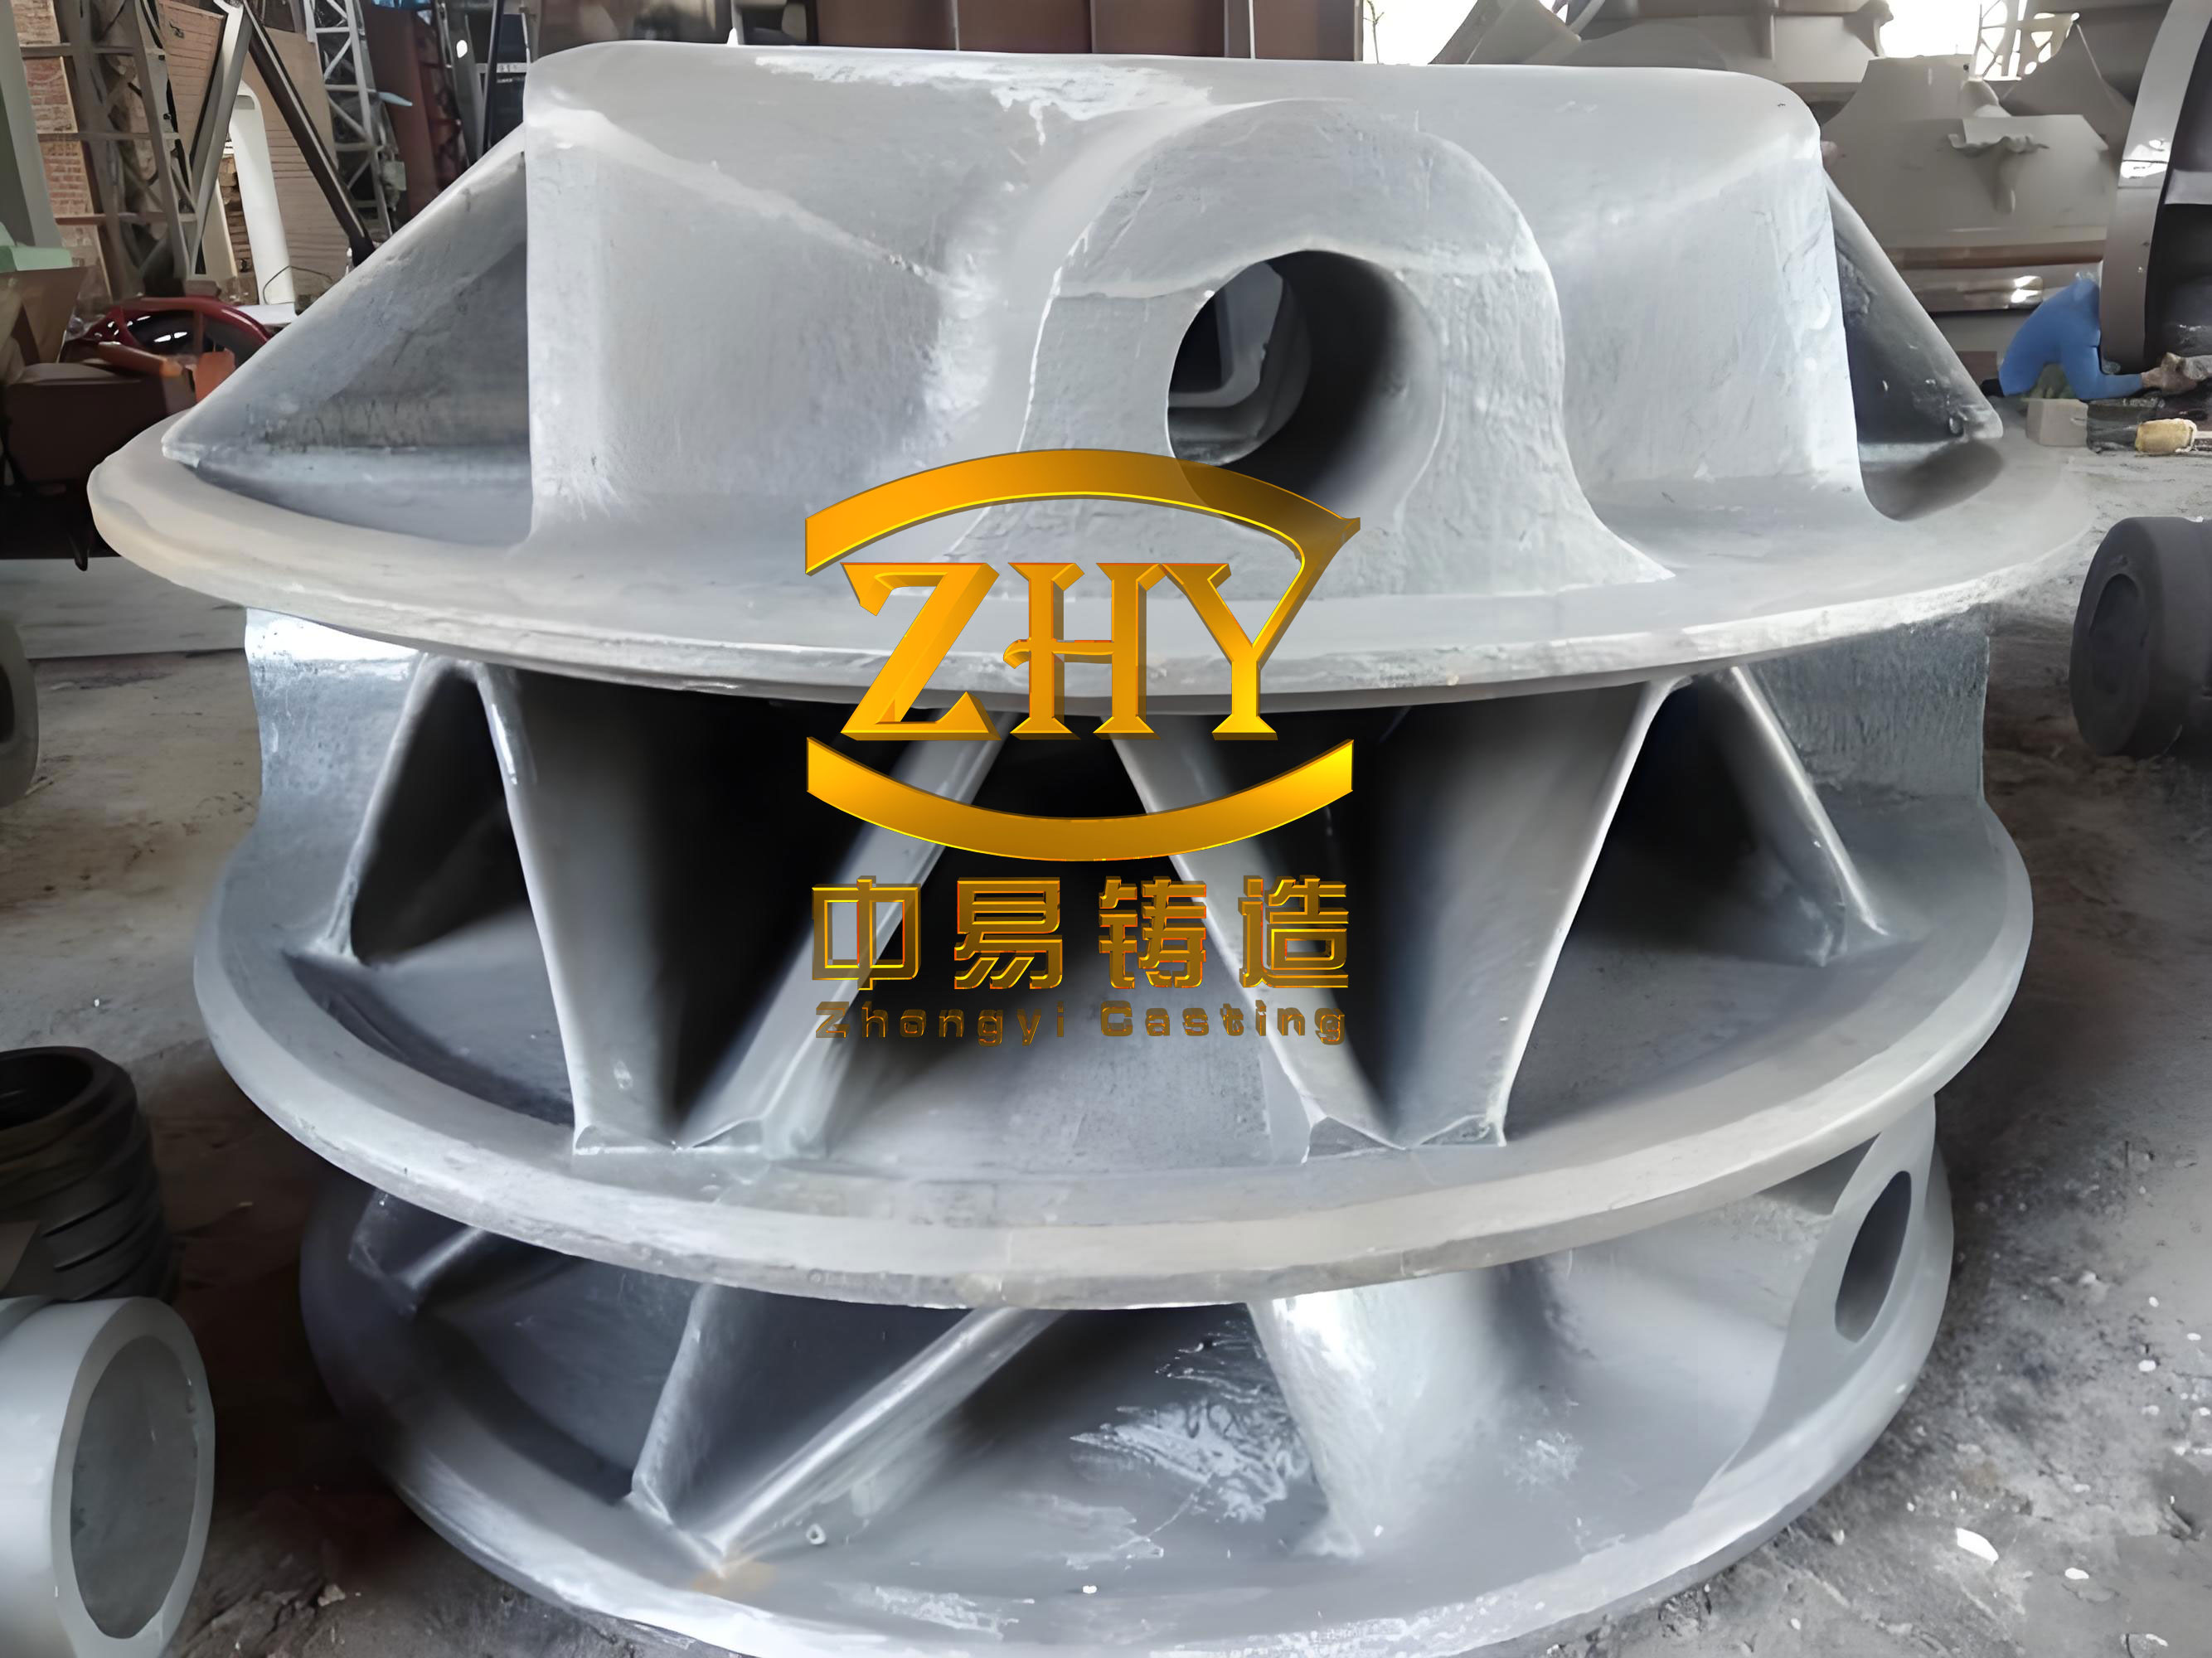
The initial ductile iron casting process utilized a furan resin sand molding system. A single casting was produced per mold box. The gating system was designed as semi-choked, with a ratio of total cross-sectional areas for sprue, runner, and ingate set at 1.6:2:1. Pouring temperature was maintained between 1360°C and 1390°C, with a pour time of approximately 35 seconds. The melting was conducted in a 6-ton medium-frequency induction furnace, with a charge composition of 55% pig iron, 30% steel scrap, and 10-20% returns. The target chemical composition for the ductile iron is summarized in Table 1.
| Element | Range |
|---|---|
| Carbon (C) | 3.6 – 4.0 |
| Silicon (Si) | 2.2 – 2.5 |
| Manganese (Mn) | < 0.35 |
| Phosphorus (P) | < 0.05 |
| Sulfur (S) | < 0.015 |
| Magnesium (Mg) | 0.03 – 0.05 |
Nodulization was performed using the sandwich method in the ladle, with a rare-earth magnesium ferrosilicon alloy addition of 1.0%. Inoculation involved a primary addition of 0.8% YFY-4 inoculant (5-15 mm) and a secondary stream inoculation with 0.15% YFY-2 inoculant (0.2-0.8 mm). Despite these standardized procedures for ductile iron casting, the initial trial productions revealed unacceptable shrinkage defects upon ultrasonic inspection.
The defects were primarily located in thicker sections and at junction areas of the box cover. To systematically analyze the problem, the casting was divided into zones for inspection. Key defect locations with RT ratings exceeding CC2 are listed in Table 2.
| Inspection Zone Number | RT Rating (Exceeded CC2) |
|---|---|
| #52 | CC5 |
| #55 | CC4 |
| #79 | CC5 |
| #93 | CC5 |
| #104 | CC5 |
| #172, #175, #176 | CC5/CC4 |
To understand the root cause, I employed CAE simulation software. The simulation of the original ductile iron casting process predicted shrinkage porosity in areas matching the actual defect locations. The fundamental issue in ductile iron casting is the interplay between solidification shrinkage and graphite expansion. The total volume change during solidification ($\Delta V_{total}$) can be expressed as a combination of liquid contraction, austenitic contraction, and graphite expansion:
$$ \Delta V_{total} = \Delta V_{liquid} + \Delta V_{austenite} – \Delta V_{graphite} $$
Where $\Delta V_{liquid}$ is negative (shrinkage), $\Delta V_{austenite}$ is negative (shrinkage), and $\Delta V_{graphite}$ is positive (expansion). For a sound ductile iron casting, the graphite expansion must adequately compensate for the preceding shrinkage phases. The expansion pressure generated by graphite precipitation, $P_g$, can be modeled as:
$$ P_g = f(G_v, T, C_{eq}) $$
where $G_v$ is the volumetric graphite growth rate, $T$ is temperature, and $C_{eq}$ is the carbon equivalent. The simulation revealed that in the original design, the thicker sections at the cover junctions and adjacent walls solidified last. The graphite expansion from earlier-solidifying thinner areas provided liquid feed to these hot spots initially. However, when these massive sections themselves entered the late stage of eutectic solidification and required feeding for their own secondary shrinkage, the graphite precipitated within them could not generate sufficient pressure to draw back the already diminished residual liquid from the surroundings. This sequential failure in feeding led to the formation of macro-shrinkage cavities. The solidification time gradient is critical; if the difference between the solidification time of a hot spot ($t_{hot}$) and that of its feeding source ($t_{feed}$) is too large, defects occur. A simplified condition for soundness can be stated as:
$$ \frac{t_{hot}}{t_{feed}} \leq K $$
where $K$ is a process-dependent constant. In our case, this ratio was excessively high at the defect locations.
The CAE analysis clearly pinpointed the problem: an imbalance in solidification timing. The solution was to accelerate solidification at the identified hot spots to synchronize them with the rest of the casting. This was achieved by applying chills. The design and placement of chills are paramount in ductile iron casting. The chill’s ability to extract heat is governed by its thermal diffusivity ($\alpha$) and the interfacial heat transfer coefficient ($h$). The heat extracted $Q$ can be approximated by:
$$ Q = h \cdot A \cdot (T_{melt} – T_{chill}) \cdot \sqrt{\frac{\alpha_{chill} \cdot t}{\pi}} $$
where $A$ is the contact area, $T_{melt}$ is the metal temperature, $T_{chill}$ is the initial chill temperature, and $t$ is time. Based on the simulation, I designed and placed steel chills at five key thick locations on the cover’s top plane and at the critical junction areas between the cover and the side walls. The positioning was optimized to ensure directional solidification towards the risers without creating new thermal centers. Table 3 summarizes the chill specifications used in the modified ductile iron casting process.
| Chill Location (Relative to Zone) | Chill Material | Dimensions (mm) | Approx. Contact Area (cm²) |
|---|---|---|---|
| Near Zones #52, #55 | Mild Steel | 150 x 100 x 25 | 375 |
| Near Zones #79, #93 | Mild Steel | 120 x 80 x 20 | 192 |
| Junction near #104 | Mild Steel | 200 x 50 x 30 | 300 |
| Junction near #172, #175, #176 | Mild Steel | 180 x 60 x 25 | 270 |
Re-simulating the ductile iron casting process with the incorporated chills showed a dramatic improvement. The solidification isotherm maps became more uniform, and the predicted shrinkage volume was reduced to negligible levels. The modified process was put into production. The subsequent ultrasonic inspection of castings produced with the new method showed that all critical areas now met the RT CC2 requirement. No shrinkage cavities were detected, validating the CAE-based optimization.
This exercise underscores several key principles in ductile iron casting. First, the feeding dynamics in ductile iron are unique due to graphite expansion. The net usable expansion for feeding depends on mold wall movement and the timing of pressure development relative to pore formation. The Niyama criterion, often used for shrinkage prediction in steel castings, is less directly applicable. A more relevant approach for ductile iron casting involves analyzing the pressure drop in the liquid during solidification. The pressure $P$ at a point in the mushy zone can be described by Darcy’s law modified for a porous medium:
$$ \nabla P = – \frac{\mu}{K} \cdot v_l $$
where $\mu$ is the dynamic viscosity of the liquid, $K$ is the permeability of the mushy zone (which is a function of fraction solid $f_s$, often following the Kozeny-Carman relation $K \propto (1-f_s)^3 / f_s^2$), and $v_l$ is the superficial liquid velocity. Defects form when $P$ falls below a critical value necessary to suppress pore nucleation. The chills effectively increased the local solidification rate, raising $f_s$ and reducing $K$ more rapidly, which altered the pressure field to maintain positive feeding pressure for a longer duration.
Furthermore, the success of this ductile iron casting project highlights the importance of a systems approach. The chemical composition, particularly the carbon equivalent ($CE = C + 0.33Si$), must be optimized for the section size. For this 20-mm average section, the chosen CE range of approximately 4.3-4.5 was appropriate to ensure sufficient graphite expansion while avoiding excessive primary graphite. The mold rigidity provided by the resin sand was also crucial to harness the expansion effectively. The entire process chain—melting, treatment, molding, and gating—must be coordinated to produce a high-integrity ductile iron casting.
In conclusion, the integration of CAE simulation into the development and troubleshooting of ductile iron casting processes is invaluable. By digitally prototyping the solidification sequence, I was able to diagnose the precise mechanism of shrinkage formation in a complex box cover casting. The solution, involving strategically placed chills to balance solidification times, was designed and verified in silico before physical trials, saving significant time and cost. This case serves as a testament to how modern simulation tools can deepen our understanding of metallurgical phenomena like graphite expansion and enable the production of reliable, high-quality ductile iron castings for demanding applications. Future work could involve optimizing the chill design using thermodynamic and stress simulation to further enhance performance and longevity in ductile iron casting production.