
In the evolving landscape of the iron casting industry, while the proportion of ductile iron and vermicular graphite iron continues to rise, mainstream grey iron castings still hold the highest share due to their excellent casting properties, such as good fluidity and machinability. In my current production facility, grey iron castings dominate, with primary grades concentrated on high-strength specifications like HT280 and HT300, analogous to international standards such as Grade 275. Traditionally, we have employed a high carbon equivalent alloying route, incorporating specific types and amounts of alloys to enhance the strength and hardness of the castings. However, in recent years, the prices of alloys have surged significantly, particularly ferromolybdenum, which now accounts for over 60% of the total alloy cost. This economic pressure has urgently driven the search for alternative methods to reduce or eliminate the use of ferromolybdenum while maintaining performance. One promising approach is adjusting the silicon-to-carbon ratio, a concept explored in this study to achieve cost savings without compromising the integrity of grey iron castings.
The production of grey iron castings involves precise control over metallurgical parameters. Our foundry utilizes medium-frequency induction melting furnaces, typically of 8-ton capacity. Raw materials primarily include pig iron, steel scrap, and returns, with additional additions such as lump ferrosilicon, ferromanganese, and carburizers to adjust the molten iron composition. The melting process follows a standard charging sequence: 5% to 10% pig iron, 50% to 60% steel scrap, and the remainder as returns. During melting, ferrosilicon, ferromanganese, and carburizers are added to tune the base iron composition to the ranges shown in Table 1.
| C | Si | Mn | P | S |
|---|---|---|---|---|
| 3.20–3.30 | 1.50–1.65 | 0.40–0.80 | < 0.06 | 0.08–0.12 |
Post-melting, ladle treatment is critical. Inoculants and alloys are added to the bottom of the ladle to ensure the desired properties for different grades. The tapping temperature is controlled between 1,480 and 1,540 °C to promote effective absorption. We use barium-bearing siliceous inoculants, along with alloys like electrolytic copper, tin granules, ferromolybdenum, and ferrochromium. For grades HT280 and above, all four alloys are typically added to guarantee performance across varying section thicknesses. The roles of these alloys are well-documented: copper refines and homogenizes pearlite and graphite, reducing chill in thin sections and improving section sensitivity; tin minimizes or eliminates ferrite, stabilizing and refining pearlite; chromium refines graphite and pearlite; and molybdenum enhances pearlite formation, promotes carbide formation, and improves uniformity in heavy sections. The final chemical composition control for HT280 grey iron castings is outlined in Table 2, with elements like C, S, Mn, and P adhering to the base iron composition without adjustment during ladle treatment.
| Si | Cu | Cr | Sn | Mo |
|---|---|---|---|---|
| 1.70–2.00 | 0.30–0.50 | 0.20–0.40 | 0.03–0.05 | 0.10–0.20 |
The molding process employs alkaline phenolic resin self-hardening sand for both test bars and castings. During pouring, a secondary inoculation is performed using a zirconium-bearing siliceous inoculant with a grain size of 0.4–0.8 mm, added at 0.08%–0.12% via a pneumatic dispensing device on the pouring machine to ensure uniform absorption. Pouring temperatures are maintained between 1,360 and 1,400 °C to achieve complete mold filling.
To address the high cost of alloys, we devised an experimental process focusing on the silicon-carbon ratio. Under identical carbon equivalent conditions, we aimed to switch from a Cu-Cr-Mo-Sn alloyed grey iron casting to a Cu-Cr-Sn alloyed grey iron casting, eliminating ferromolybdenum use. This adjustment involved increasing the Si/C ratio from approximately 0.55 to 0.7, with carbon content reduced by about 0.1% and silicon content increased by about 0.4%. The chemical composition ranges for the conventional and high Si/C ratio grey iron castings are compared in Table 3.
| Material | Base Iron C | Base Iron Si | Final Si | Cu | Cr | Sn | Mo |
|---|---|---|---|---|---|---|---|
| Cu-Cr-Mo-Sn Alloy | 3.20–3.30 | 1.50–1.65 | 1.70–2.00 | 0.30–0.50 | 0.20–0.40 | 0.03–0.05 | 0.10–0.20 |
| Cu-Cr-Sn (High Si/C 0.70) Alloy | 3.10–3.20 | 1.50–1.65 | 2.10–2.20 | 0.30–0.50 | 0.20–0.40 | 0.03–0.05 | – |
The carbon equivalent (CE) is a crucial parameter in grey iron casting, defined as: $$CE = C + \frac{Si + P}{3}$$ For our trials, CE was kept constant to isolate the effect of Si/C ratio. Increasing the Si/C ratio at constant CE alters solidification characteristics and microstructure: the volume of primary austenite increases, strengthening the matrix; overall graphite content decreases due to lower carbon, reducing the embrittling effect of graphite flakes; the eutectoid transformation temperature rises, potentially coarsening pearlite; and higher silicon solubility in ferrite strengthens it, including the ferrite in pearlite. The Si/C ratio is expressed as: $$Si/C = \frac{\text{Si}}{\text{C}}$$ where Si and C are mass fractions.
We conducted four experimental runs, adjusting the base iron carbon content to 3.10%–3.20% while keeping other elements unchanged. During ladle treatment, the amount of barium-bearing siliceous inoculant was increased, and ferromolybdenum was omitted. Using a 1-ton ladle, we poured separately cast test bars and actual castings at temperatures of 1,360–1,400 °C. The test bars were evaluated for chemical composition, metallographic structure, and mechanical properties, while key sections of the castings were dissected for similar analyses.
The results for the Cu-Cr-Sn alloy grey iron castings with a Si/C ratio of 0.7 are summarized in Table 4. All properties met the HT280 requirements, which specify a tensile strength ≥ 280 MPa and a hardness of 190–260 HBW.
| Grade | Si/C | C (mass %) | Si (mass %) | Cu (mass %) | Cr (mass %) | Sn (mass %) | Graphite Structure | Matrix | Tensile Strength (MPa) | Hardness (HBW) |
|---|---|---|---|---|---|---|---|---|---|---|
| HT280 | 0.70 | 3.11 | 2.18 | 0.47 | 0.29 | 0.047 | Type A, Length 4 | 98% Pearlite | 295 | 209 |
| HT280 | 0.67 | 3.15 | 2.11 | 0.45 | 0.25 | 0.040 | Type A, Length 4 | 98% Pearlite | 290 | 221 |
| HT280 | 0.68 | 3.18 | 2.17 | 0.43 | 0.30 | 0.043 | Type A, Length 4 | 98% Pearlite | 300 | 211 |
| HT280 | 0.69 | 3.12 | 2.16 | 0.40 | 0.24 | 0.043 | Type A, Length 4 | 98% Pearlite | 310 | 220 |
| Average | 0.69 | – | 2.15 | 0.44 | 0.27 | 0.043 | – | – | 299 | 215 |
Dissection of the castings, specifically at the main bolt location in the bearing cap (approximately 50 mm thick), yielded the properties shown in Table 5. These results confirm that the high Si/C ratio grey iron castings perform satisfactorily in actual components.
| Sample | Grade | Graphite Structure | Matrix | Tensile Strength (MPa) | Hardness (HBW) |
|---|---|---|---|---|---|
| 1# | HT280 | Type A, Length 4 | 98% Pearlite | 262 | 183 |
| 2# | HT280 | Type A, Length 4 | 98% Pearlite | 245 | 193 |
For comparison, Table 6 presents data from conventional Cu-Cr-Mo-Sn alloy grey iron castings with a Si/C ratio around 0.55. Additionally, to bolster the comparison, we conducted four extra trials with Cu-Cr-Sn alloy grey iron castings at the same Si/C ratio of 0.55 (without Mo), with the molten iron reverted after testing to avoid production issues; results are in Table 7.
| Grade | Si/C | C (mass %) | Si (mass %) | Cu (mass %) | Cr (mass %) | Sn (mass %) | Mo (mass %) | Graphite Structure | Matrix | Tensile Strength (MPa) | Hardness (HBW) |
|---|---|---|---|---|---|---|---|---|---|---|---|
| HT280 | 0.58 | 3.25 | 1.89 | 0.46 | 0.25 | 0.046 | 0.15 | Type A, Length 4 | 98% Pearlite | 335 | 246 |
| HT280 | 0.57 | 3.24 | 1.85 | 0.46 | 0.28 | 0.047 | 0.12 | Type A, Length 4 | 98% Pearlite | 325 | 246 |
| HT280 | 0.55 | 3.26 | 1.79 | 0.47 | 0.29 | 0.045 | 0.12 | Type A, Length 4 | 98% Pearlite | 285 | 263 |
| HT280 | 0.55 | 3.30 | 1.80 | 0.47 | 0.30 | 0.047 | 0.13 | Type A, Length 4 | 98% Pearlite | 310 | 245 |
| Average | 0.56 | – | 1.83 | 0.47 | 0.28 | 0.046 | 0.13 | – | – | 314 | 250 |
| Grade | Si/C | C (mass %) | Si (mass %) | Cu (mass %) | Cr (mass %) | Sn (mass %) | Graphite Structure | Matrix | Tensile Strength (MPa) | Hardness (HBW) |
|---|---|---|---|---|---|---|---|---|---|---|
| HT280 | 0.57 | 3.25 | 1.85 | 0.48 | 0.26 | 0.045 | Type A, Length 4 | 98% Pearlite | 275 | 200 |
| HT280 | 0.57 | 3.26 | 1.85 | 0.45 | 0.26 | 0.042 | Type A, Length 4 | 98% Pearlite | 295 | 210 |
| HT280 | 0.54 | 3.30 | 1.79 | 0.45 | 0.25 | 0.041 | Type A, Length 4 | 98% Pearlite | 280 | 208 |
| HT280 | 0.56 | 3.26 | 1.83 | 0.44 | 0.29 | 0.042 | Type A, Length 4 | 98% Pearlite | 285 | 195 |
| Average | 0.56 | – | 1.83 | 0.46 | 0.27 | 0.043 | – | – | 284 | 203 |
The comparative analysis reveals significant insights. At a Si/C ratio of about 0.55, the Cu-Cr-Mo-Sn alloy grey iron castings exhibit an average tensile strength of 314 MPa and hardness of 250 HBW, whereas the Cu-Cr-Sn alloy grey iron castings at the same Si/C ratio show averages of 284 MPa and 203 HBW. This indicates that without molybdenum, the tensile strength is approximately 10.6% lower, and hardness is about 23% lower, highlighting the risk of not meeting specifications if ferromolybdenum is simply removed. However, when the Si/C ratio is increased to 0.7 while maintaining the same carbon equivalent and using the Cu-Cr-Sn alloy, the average tensile strength rises to 299 MPa and hardness to 215 HBW. This represents a 5.3% increase in tensile strength and a 5.9% increase in hardness compared to the Cu-Cr-Sn alloy at Si/C 0.55. Notably, the high Si/C ratio grey iron casting achieves a tensile strength well above the 280 MPa requirement for HT280, demonstrating the efficacy of this adjustment.
The relationship between tensile strength (σ) and composition can be approximated by empirical formulas for grey iron castings, such as: $$\sigma = A \cdot (CE) + B \cdot (Si/C) + C$$ where A, B, and C are constants derived from regression analysis. Our data suggests that increasing Si/C positively influences strength, albeit less than molybdenum addition, but sufficiently for cost-reduction goals.
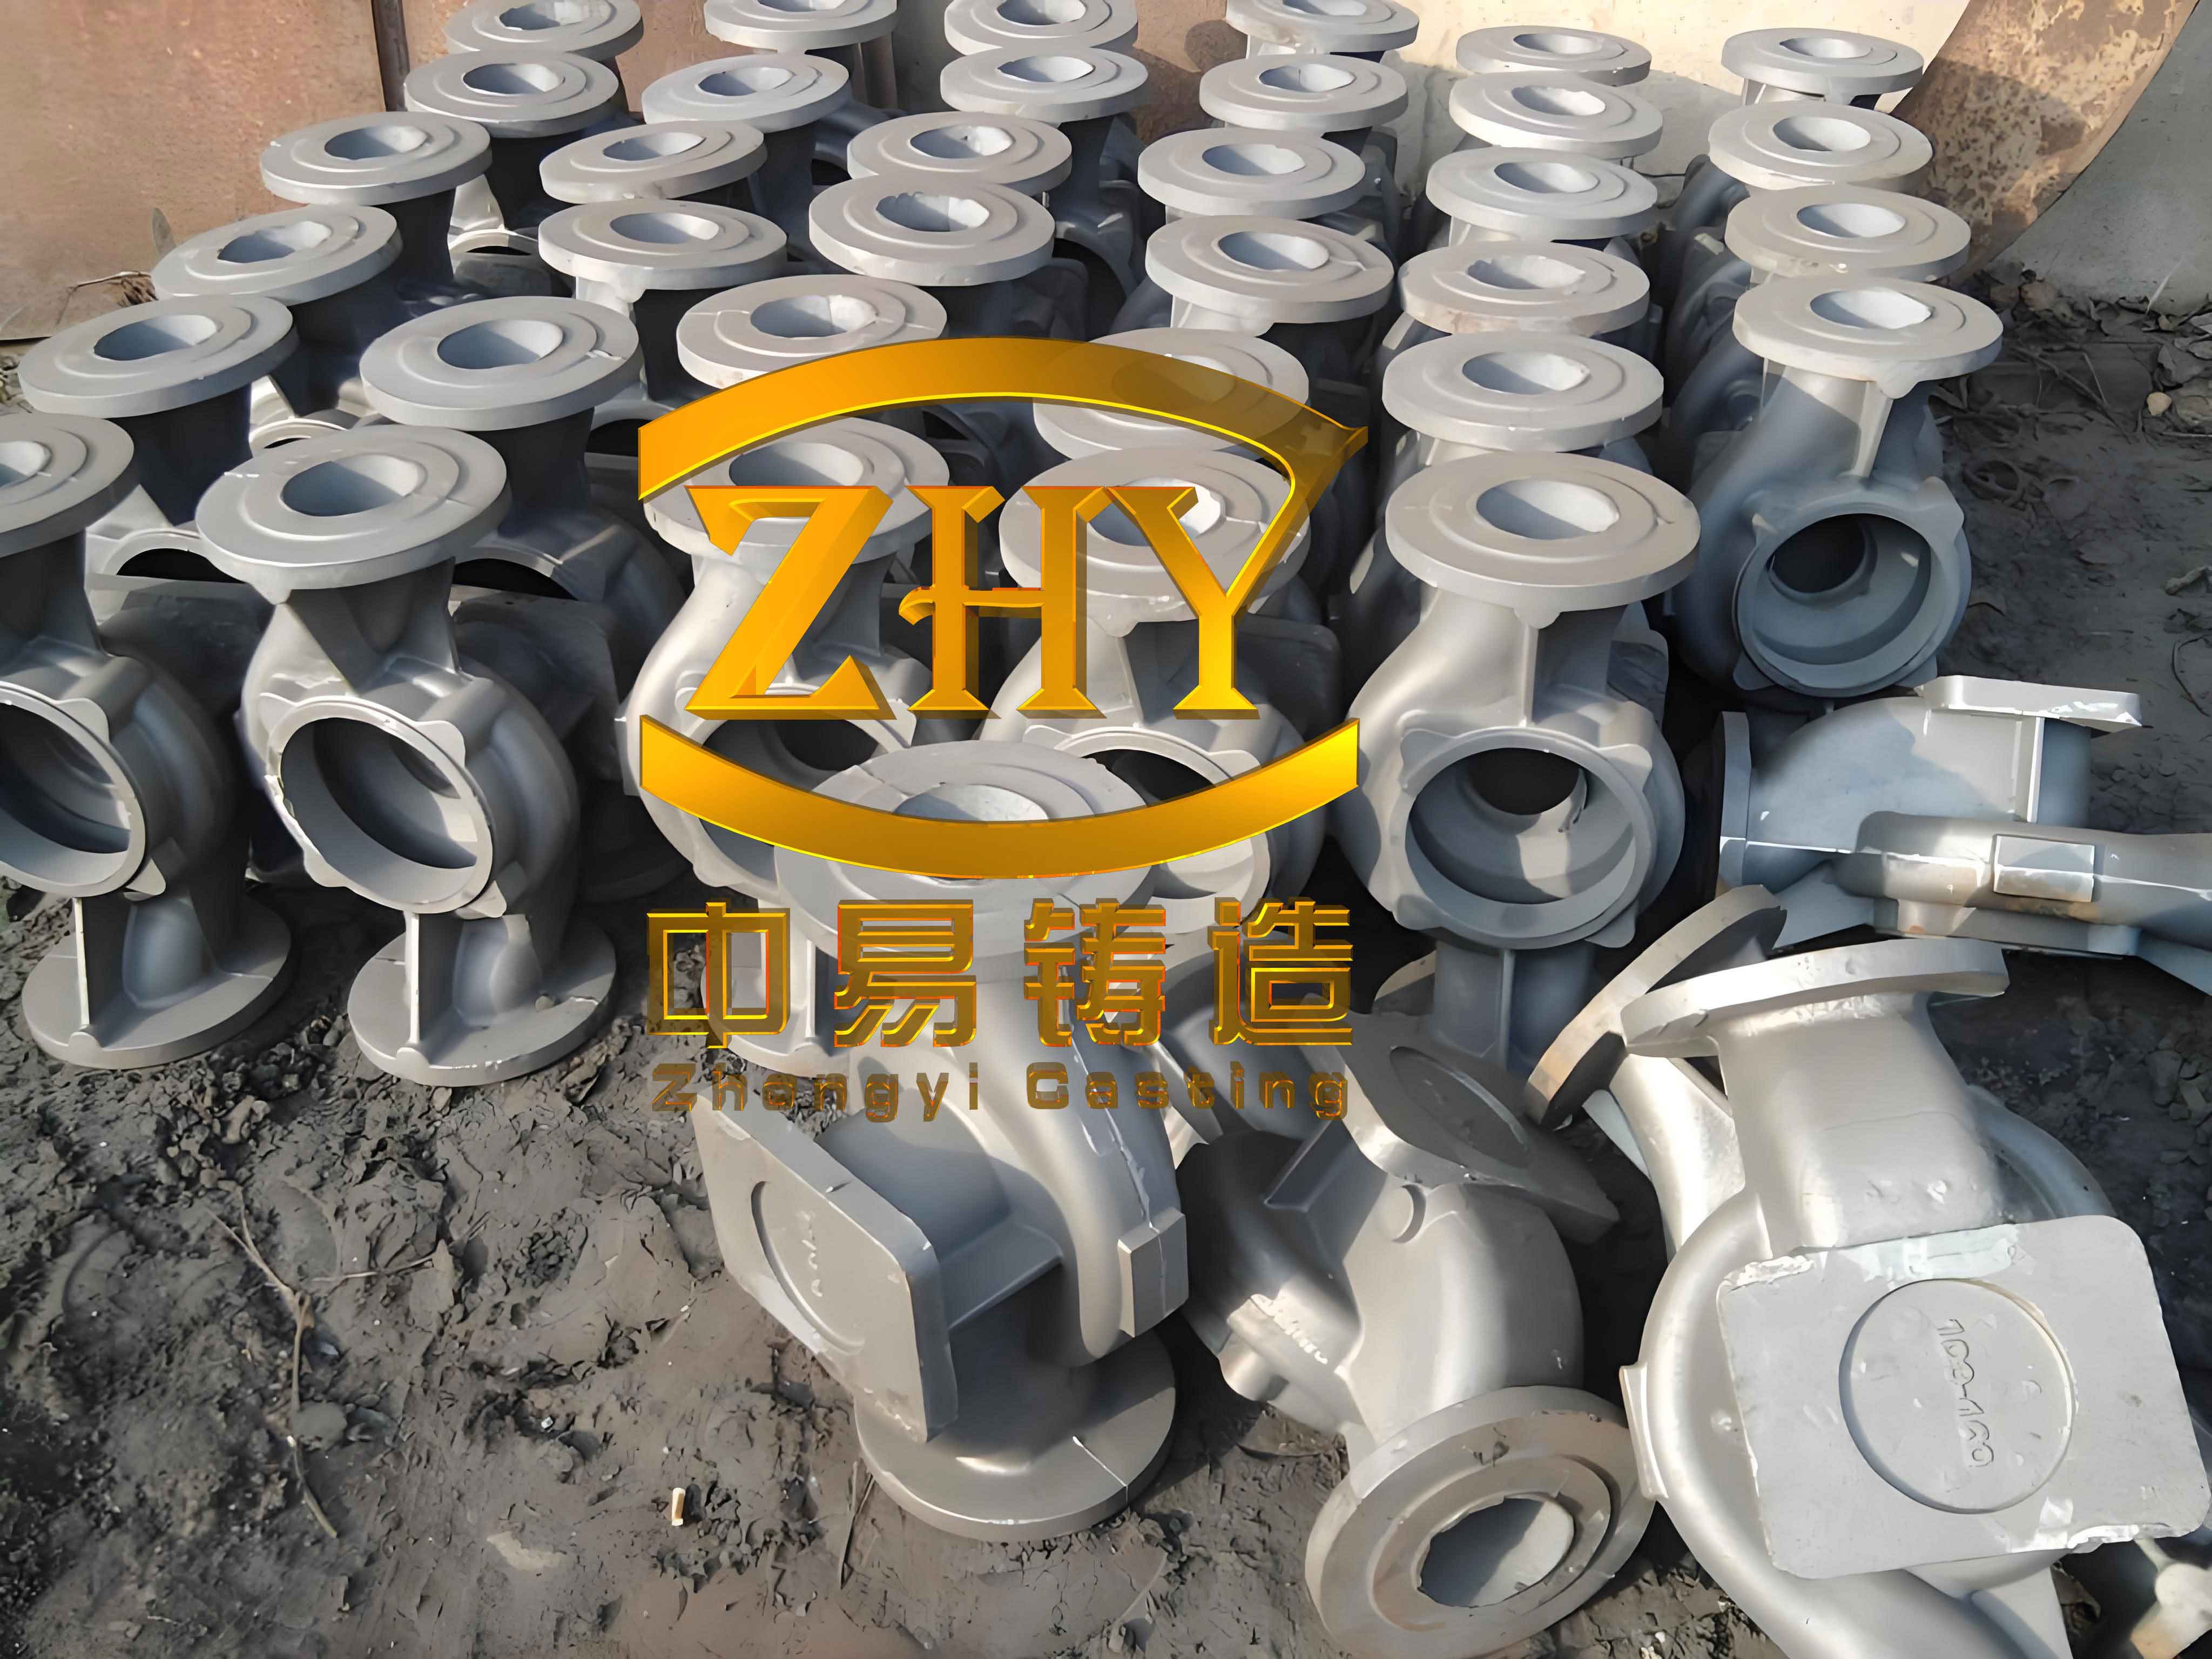
Metallographic examination provides further understanding. The microstructure of conventional Cu-Cr-Mo-Sn alloy grey iron castings shows typical Type A graphite with a length rating of 4 and nearly fully pearlitic matrix. In contrast, the high Si/C ratio Cu-Cr-Sn alloy grey iron castings display shorter graphite flakes, reducing the embrittling effect on the matrix, and a refined grain structure despite similar pearlite content. This refinement contributes to the enhanced mechanical properties. The image below illustrates the typical microstructure of grey iron castings, highlighting graphite morphology and matrix characteristics.
The microstructural differences underscore the importance of silicon-carbon balance in grey iron casting. Higher silicon content promotes ferrite strengthening and reduces graphite aspect ratio, while lower carbon decreases graphite volume. The combined effect improves tensile properties without relying on costly molybdenum. This aligns with fundamental principles in iron metallurgy, where silicon solid-solution strengthening and graphite morphology control are key levers for optimizing grey iron casting performance.
From a cost perspective, eliminating ferromolybdenum saves approximately 0.15% by weight, translating to a cost reduction of about 600 CNY per ton of grey iron casting produced. Given the volatile prices of alloys, this adjustment offers substantial economic benefits while maintaining the integrity of the castings. Furthermore, the high Si/C ratio approach reduces reliance on scarce or expensive alloys, enhancing supply chain resilience for foundries specializing in grey iron castings.
In conclusion, our exploration confirms that adjusting the silicon-carbon ratio is a viable strategy for reducing alloy content in high-strength grey iron castings. The conventional Cu-Cr-Mo-Sn alloyed grey iron casting, while effective, incurs high costs due to molybdenum. Directly removing molybdenum without compensation risks performance shortfalls. However, by increasing the Si/C ratio from 0.55 to 0.7 under constant carbon equivalent, we successfully transitioned to a Cu-Cr-Sn alloyed grey iron casting that meets HT280 specifications. The average tensile strength improved by about 5%, sufficient to offset the absence of molybdenum. This demonstrates that silicon-carbon ratio manipulation can partially substitute for alloying elements, offering a cost-effective pathway for producing grey iron castings. For foundries facing rising alloy prices, adopting a high Si/C ratio process presents a promising avenue to maintain competitiveness without compromising quality. Future work could explore optimizing inoculation practices and cooling rates to further enhance the properties of high Si/C ratio grey iron castings, potentially extending this approach to higher grades or more complex geometries.
The broader implications for the grey iron casting industry are significant. As environmental and economic pressures mount, sustainable practices that reduce material costs while preserving performance are crucial. The high Si/C ratio method not only lowers expenses but also aligns with resource efficiency goals by minimizing alloy usage. We recommend that foundries conduct pilot trials to tailor the Si/C ratio to their specific production conditions, considering factors like section thickness and cooling rates. By leveraging metallurgical principles, such as the carbon equivalent and silicon-carbon interaction, manufacturers can innovate in grey iron casting production, ensuring its continued relevance in modern manufacturing. Ultimately, this study underscores the importance of fundamental parameter control in achieving both economic and technical objectives in the realm of grey iron castings.