
In the realm of metal casting, sand casting remains one of the most widely used manufacturing processes due to its versatility, cost-effectiveness, and ability to produce complex geometries. The quality and integrity of cast components are heavily influenced by the solidification and cooling dynamics within the mold, which are governed by the thermophysical properties of the molding sand. Accurate knowledge of these properties—specifically thermal conductivity and specific heat—is paramount for reliable numerical simulations of casting processes. Such simulations guide process optimization, defect prediction, and overall production efficiency. However, molding sand is a heterogeneous, porous composite material whose properties vary significantly with composition, binder content, compaction density, and temperature. This variability often renders literature data inadequate for precise simulations, leading to errors in predicting temperature fields and solidification patterns. This study, therefore, aims to experimentally determine and numerically validate the temperature-dependent thermophysical parameters of production-grade molding sand used in sand casting, employing a combined approach of direct temperature measurement and computational inverse analysis.
The core challenge in sand casting simulation lies in the accurate characterization of the mold material. Molding sand typically consists of a base aggregate (like silica or chromite sand), binders (e.g., resins), additives (like iron oxide), and catalysts. Its structure is porous, and its thermal behavior is non-linear. The thermal conductivity ($\lambda$) dictates the rate of heat extraction from the casting, while the specific heat ($c_p$) determines the energy storage capacity of the sand. Both parameters are functions of temperature. Traditionally, constant average values are used in simulations, but this oversimplification can lead to significant discrepancies, especially for thick-section castings with prolonged cooling times. My investigation focuses on deriving these property curves from actual foundry conditions and implementing them in commercial simulation software to assess the improvement in predictive accuracy.
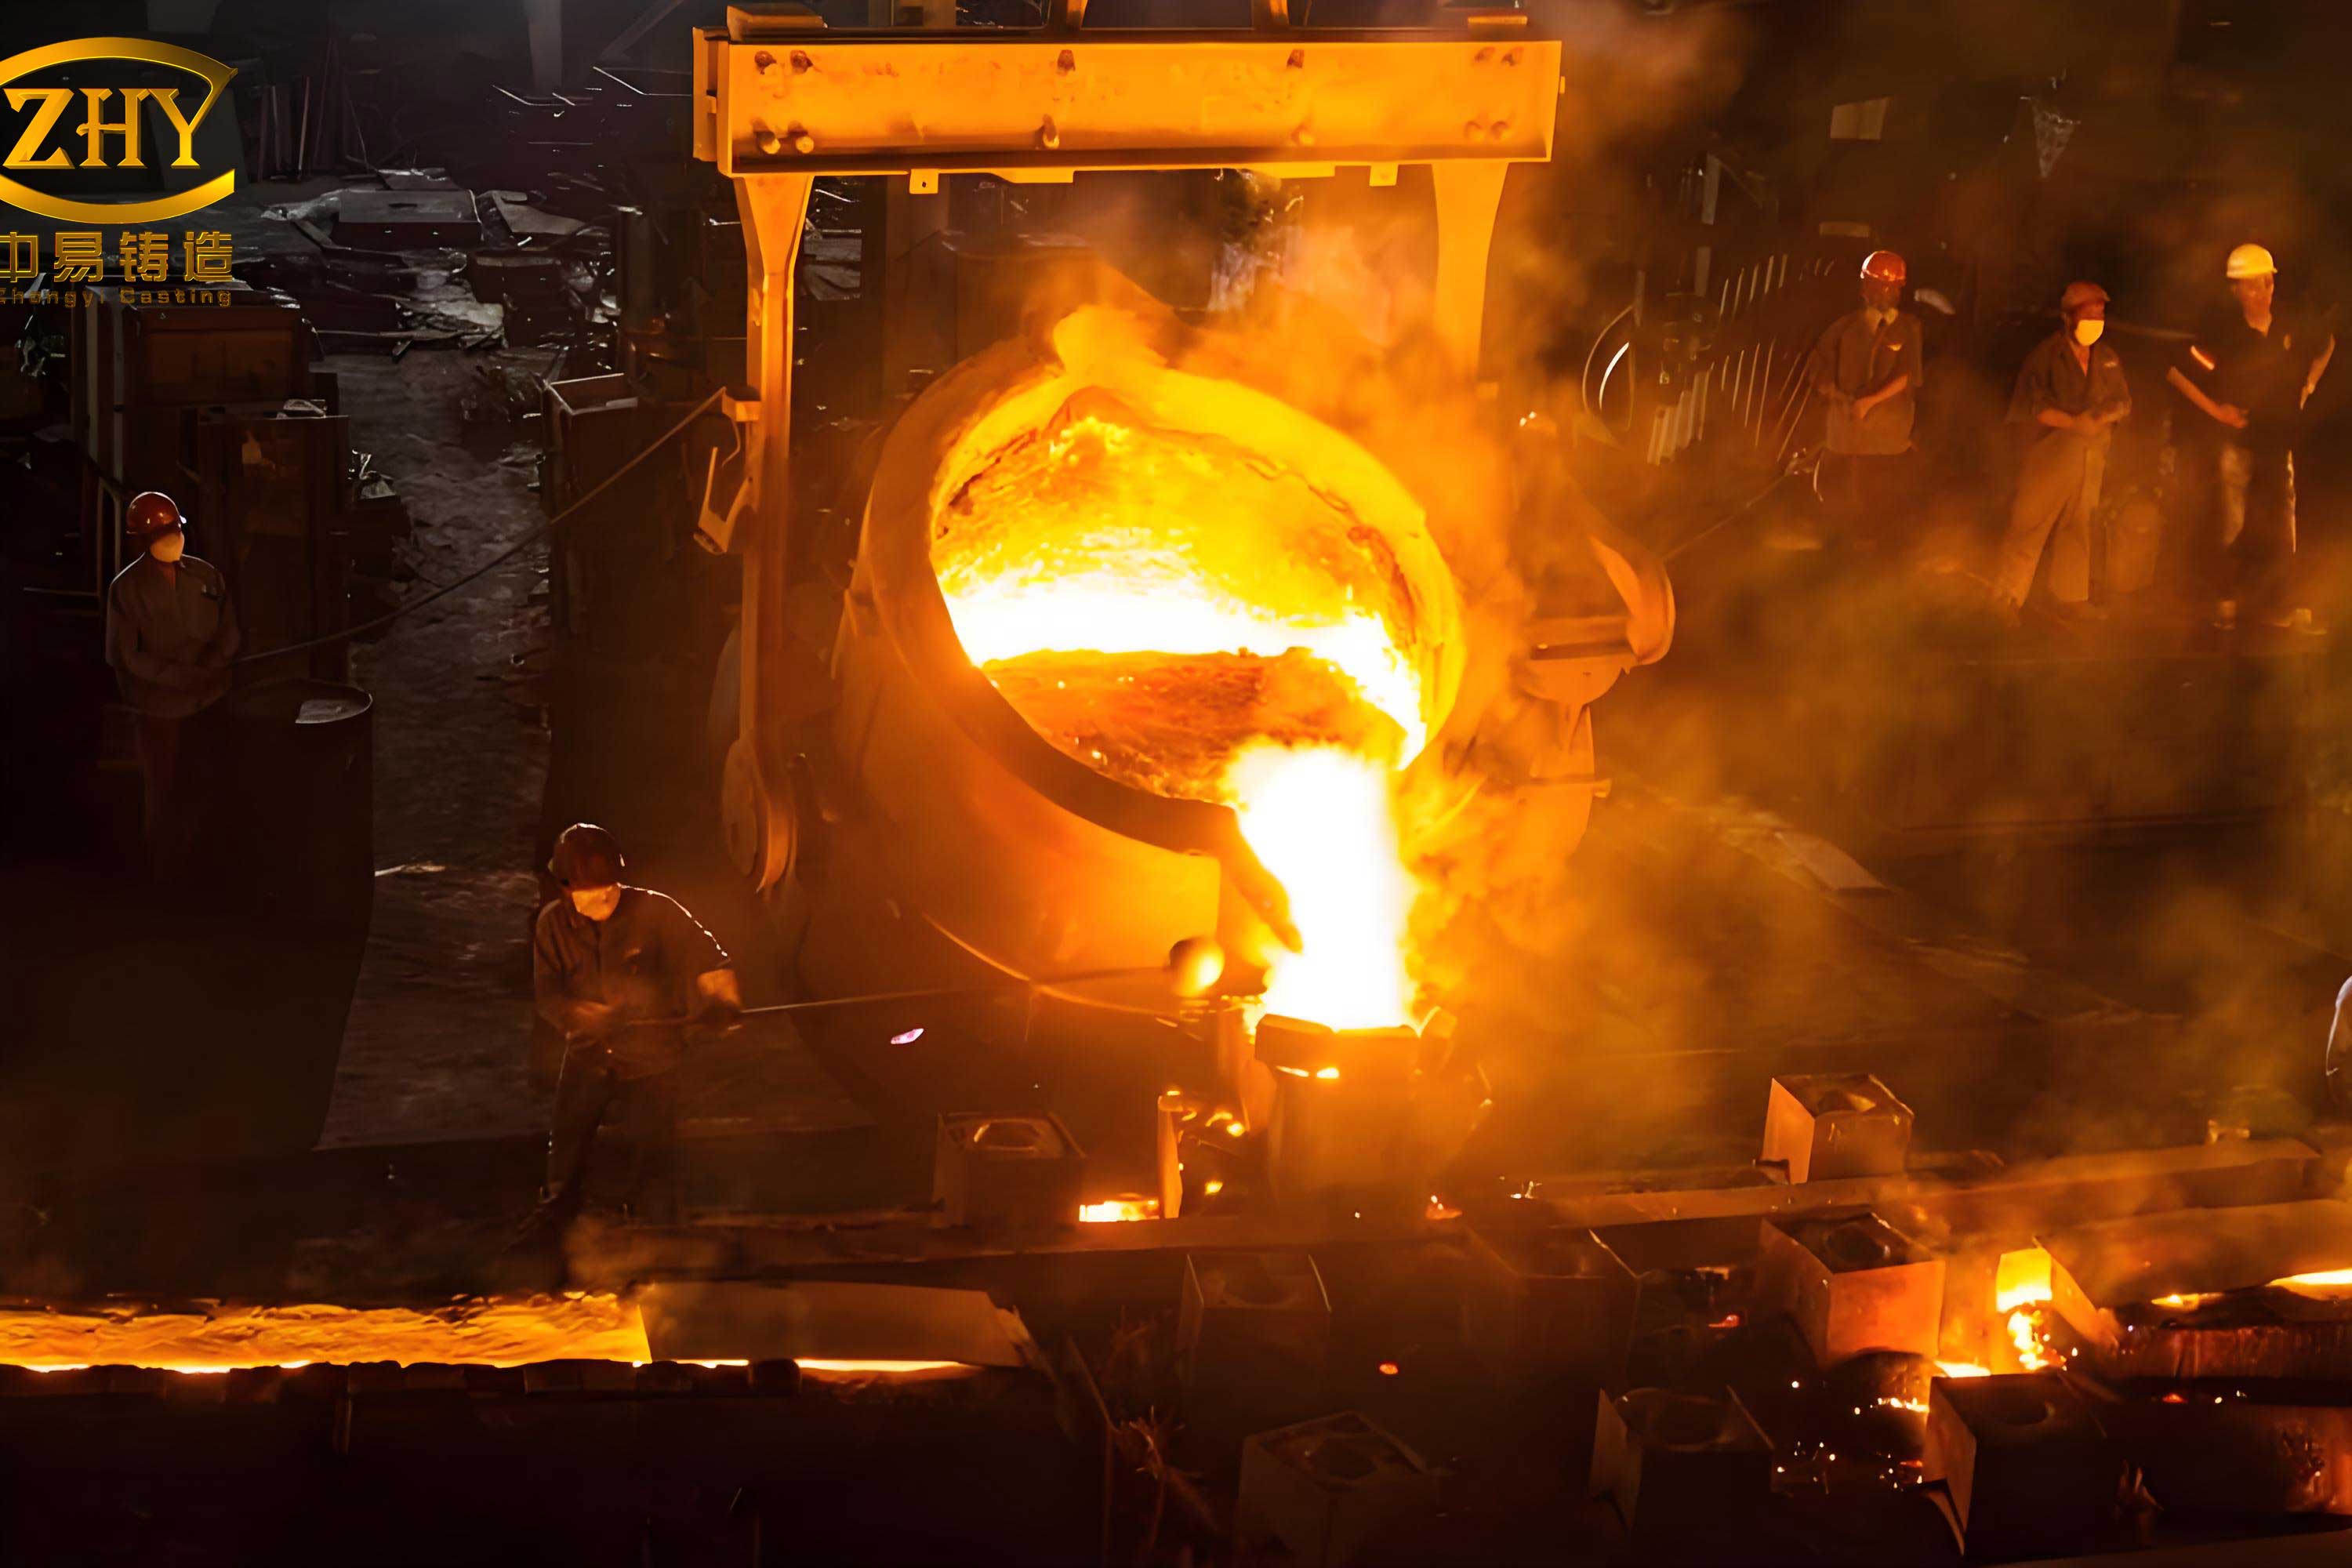
The experimental phase was conducted using standard production materials and practices. The molding sand system comprised two layers: a facing layer of chromite sand (15-25 mm thick) and a backing layer of silica sand. This is common in sand casting for steel to improve thermal resistance and surface finish. The detailed composition and grain size distribution of the sands are summarized in Table 1. The binder system was a urethane resin with an isocyanate hardener. The proportions were carefully controlled: for chromite sand, resin addition was 1 wt.% and hardener was 25 wt.% relative to the resin; for silica sand, resin was 0.65 wt.% and hardener was 40 wt.% relative to the resin. After mixing, the sand was compacted, and its properties were verified. The average compacted strength was 80-90 MPa, with chromite sand exhibiting 2.5-4.5 MPa strength and near-zero moisture, and silica sand showing 1.5-2.5 MPa strength and 0-5% moisture. The bulk density of the mold sand ranged from 2.5 to 2.9 kg/dm³.
| Type | SiO₂ (wt.%) | Fe₂O₃ (wt.%) | Cr₂O₃ (wt.%) | Others (wt.%) | Grain Size 40-70 mesh (%) | Grain Size 30-70 mesh (%) | Grain Size 30-100 mesh (%) |
|---|---|---|---|---|---|---|---|
| Chromite Sand | ≤1 | 20-25 | ≥46 | ≤20 | ≥75 | ≥85 | ≥95 |
| Silica Sand | ≥85 | ≤0.2 | ≤2 | ≤10 | ≥75 | ≥85 | ≥95 |
The test casting was a large, low-carbon steel (ACM1506) mining machinery component. To simplify the analysis for property determination, a representative section was modeled as a rectangular bar-like geometry with dimensions 6400 mm × 500 mm × 700 mm, weighing approximately 17.5 tonnes, and equipped with an elliptical riser. The pouring temperature was set at 1575°C. Key to the experiment was the placement of K-type thermocouples within the sand mold at strategic locations. Two sets of measurements were taken. First, thermocouples were placed vertically above a point on the casting (designated point A) at distances of 50 mm, 100 mm, 150 mm, and 200 mm from the casting-mold interface. These measured the temperature evolution within the sand over time. Second, for a more detailed inverse analysis, thermocouples were embedded at points A1 (20 mm from the interface) and A2 (50 mm from the interface) in a separate but identical mold setup. Temperature data was recorded from the start of pouring at a frequency of 0.5 Hz for an extended period, typically covering the entire cooling cycle to ambient temperature.
The fundamental heat transfer process in sand casting is governed by the transient heat conduction equation. For one-dimensional heat flow in the mold perpendicular to the casting surface, it can be expressed as:
$$\rho(T) c_p(T) \frac{\partial T}{\partial t} = \frac{\partial}{\partial x} \left( \lambda(T) \frac{\partial T}{\partial x} \right)$$
where:
- $\rho(T)$ is the temperature-dependent density of the molding sand (kg/m³),
- $c_p(T)$ is the temperature-dependent specific heat (J/(kg·K)),
- $\lambda(T)$ is the temperature-dependent thermal conductivity (W/(m·K)),
- $T$ is temperature (K or °C),
- $t$ is time (s),
- $x$ is the spatial coordinate from the interface (m).
Given the measured temperature histories at known locations ($T(x_i, t)$), the inverse problem involves finding the functions $\lambda(T)$ and $c_p(T)$ that minimize the difference between the simulated and measured temperatures. This is a complex optimization problem. A common simplification for such porous materials is to treat the effective properties as a function of temperature only, assuming local thermal equilibrium. The initial approach was to use the temperature data from the four distant points (50, 100, 150, 200 mm) to get a preliminary estimate. The temperature gradients and heat fluxes can be approximated from the data. The heat flux ($q$) at the interface can be related to the temperature gradient in the sand. For a semi-infinite medium approximation initially, we have:
$$q(t) = -\lambda(T) \frac{\partial T}{\partial x}\bigg|_{x=0}$$
The accumulated heat in the sand layer up to a distance $d$ can be related to the integral of the temperature rise:
$$Q(d, t) = \int_{0}^{d} \rho c_p(T) \Delta T(x, t) \, dx$$
where $\Delta T(x,t)$ is the temperature rise above initial ambient temperature. By analyzing the sequential heating of the sand layers at different distances, one can iteratively solve for $\lambda(T)$ and $c_p(T)$. A more robust method, and the one primarily used here, is the parameter estimation technique coupled with numerical simulation. The process involves assuming an initial form for the property curves, running a simulation with a detailed model of the test casting and mold, comparing the predicted temperatures at A1 and A2 with the measured ones, and then systematically adjusting the property curves until a satisfactory match is achieved.
The temperature profiles recorded at different distances from the casting surface are profoundly illustrative of the heat diffusion process in sand casting. The data, representing a critical output of the sand casting process characterization, is summarized in Table 2 and depicted conceptually here. The temperature at 50 mm from the interface rose slowly for the first 90 minutes, then surged rapidly between 100 and 200 minutes to a peak of about 500°C, plateauing thereafter. At 100 mm, the temperature increased gradually for nearly 400 minutes before a sharper rise to around 230°C. At 150 mm and 200 mm, the temperature increased monotonically at a slow rate, reaching only about 120°C and 80°C, respectively, even after 750 minutes. This clearly demonstrates that the thermal wave propagates very slowly through the sand mold. The closer the sand is to the casting, the steeper the temperature gradient and the faster the local temperature change. This slow propagation is a direct consequence of the relatively low thermal diffusivity ($\alpha = \lambda / \rho c_p$) of the molding sand, which acts as the dominant thermal resistance in the sand casting system.
| Distance from Casting (mm) | Initial Slow Heating Phase | Rapid Heating Phase | Peak Temperature Approx. (°C) | Time to Reach Near Plateau |
|---|---|---|---|---|
| 50 | 0-90 min | 100-200 min | 500 | ~200 min |
| 100 | 0-400 min | 400-600 min | 230 | ~600 min |
| 150 | Continuous slow rise | Not distinct | 120 | >750 min |
| 200 | Continuous slow rise | Not distinct | 80 | >750 min |
From this data, the effective thermal conductivity and specific heat as functions of temperature were derived through the inverse calculation procedure. The results are pivotal for accurate sand casting simulation. The thermal conductivity exhibited a distinct non-linear “V-shaped” trend with temperature, as shown in Table 3. It decreased from room temperature up to a critical point around 400°C, reaching a minimum, and then increased with further temperature rise. This behavior can be attributed to competing mechanisms: at lower temperatures, the conductivity is dominated by the solid matrix and the insulating effect of the air in pores; as temperature increases, radiative heat transfer through the pores becomes more significant, eventually outweighing the decrease in conductive transfer through the solid phase. The specific heat, on the other hand, showed a continuously increasing trend with temperature, but the rate of increase changed. Below approximately 600°C, the specific heat rose sharply, likely due to endothermic reactions of the resin binder (decomposition) and the increasing vibrational energy of the sand particles. Above 600°C, the rate of increase diminished, approaching a more constant value as these processes completed.
| Temperature Range (°C) | Thermal Conductivity, $\lambda$ (W/(m·K)) Trend | Specific Heat, $c_p$ (J/(kg·K)) Trend | Proposed Empirical Correlation* |
|---|---|---|---|
| 20 – 400 | Decreasing | Rapidly Increasing | $\lambda(T) \approx 0.8 – 1.5 \times 10^{-3}(T-20)$ $c_p(T) \approx 800 + 1.5(T-20)$ |
| 400 – 600 | Increasing | Rapidly Increasing (slowing) | $\lambda(T) \approx 0.3 + 1.0 \times 10^{-3}(T-400)$ $c_p(T) \approx 1400 + 0.8(T-400)$ |
| 600 – 1000 | Increasing | Slowly Increasing | $\lambda(T) \approx 0.5 + 1.2 \times 10^{-3}(T-600)$ $c_p(T) \approx 1800 + 0.2(T-600)$ |
*Note: These are simplified linear approximations for illustrative purposes within each range. Actual inverse analysis yields smooth curves.
To validate these derived properties, a comprehensive numerical simulation of the test casting’s solidification was performed using MAGMA software. The 3D geometry was meshed with a graded grid, finer near the interface (5 mm cubes around A1/A2) and coarser farther away (up to 20 mm cubes). Two simulation cases were run for comparison: CASE1 used the newly derived temperature-dependent thermal conductivity but assumed a constant specific heat of $c_p = 1250 \, \text{J/(kg·K)}$, a common simplification. CASE2 used both the temperature-dependent $\lambda(T)$ and $c_p(T)$ curves obtained from our inverse analysis. The simulated temperature histories at points A1 and A2 were extracted and compared against the experimental measurements. The results, quantified by the root-mean-square error (RMSE), are presented in Table 4. The comparison clearly shows that CASE2, incorporating full temperature dependence, provides a significantly better match to the experimental data, with RMSE values less than half of those in CASE1. This underscores the importance of using accurate, temperature-variable properties for predictive sand casting simulation.
| Simulation Case | Thermophysical Properties Used | RMSE at A1 (20 mm) (°C) | RMSE at A2 (50 mm) (°C) | Qualitative Match to Measured Curve |
|---|---|---|---|---|
| CASE1 | $\lambda(T)$ from study, $c_p$=constant | ~42 | ~38 | Fair; misses timing & magnitude of peaks |
| CASE2 | $\lambda(T)$ and $c_p(T)$ from study | ~18 | ~15 | Excellent; captures slope and plateau accurately |
The mathematical foundation for the inverse estimation can be framed as an optimization problem. Let $\vec{P}$ be the vector of parameters defining the property curves (e.g., coefficients in a piecewise polynomial fit for $\lambda(T)$ and $c_p(T)$). The objective function $F(\vec{P})$ to be minimized is the sum of squared errors between measured and computed temperatures:
$$F(\vec{P}) = \sum_{j=1}^{M} \sum_{i=1}^{N_j} \left[ T_{\text{sim}}(x_j, t_i; \vec{P}) – T_{\text{exp}}(x_j, t_i) \right]^2$$
where $M$ is the number of thermocouple locations (A1, A2), $N_j$ is the number of time steps for location $j$, $T_{\text{sim}}$ is the simulated temperature from the numerical model using properties defined by $\vec{P}$, and $T_{\text{exp}}$ is the experimentally measured temperature. Minimizing $F(\vec{P})$ involves running the simulation model repeatedly within an optimization loop. Given the computational cost of a full 3D sand casting simulation, a staggered approach was used. First, keeping $c_p$ constant, $\lambda(T)$ was adjusted until the early-time temperature response (governed mainly by conductivity) was matched. Subsequently, with the optimized $\lambda(T)$ fixed, $c_p(T)$ was adjusted to match the longer-term temperature rise and energy storage characteristics. This decoupled approach, while approximate, proved effective and computationally efficient.
The implications of these findings for industrial sand casting are substantial. With accurate sand property data, simulation software can more reliably predict critical outcomes such as solidification time, shrinkage porosity locations, cooling stresses, and the risk of metallurgical defects. For instance, the correct prediction of the thermal gradient is essential for designing effective feeding systems (risers and chills) in sand casting. To further generalize the results, one can consider the dimensionless Fourier number ($Fo$) and Biot number ($Bi$), which characterize transient heat conduction. For a sand casting mold:
$$Fo = \frac{\alpha t}{L^2} = \frac{\lambda t}{\rho c_p L^2}, \quad Bi = \frac{h L}{\lambda_s}$$
where $L$ is a characteristic length of the casting, $\alpha$ is the thermal diffusivity of the sand, $\lambda_s$ is the thermal conductivity of the solid casting metal, and $h$ is an effective interface heat transfer coefficient. The low $\alpha$ of sand results in low $Fo$ for the mold, meaning heat penetrates slowly. Our derived $\lambda(T)$ and $c_p(T)$ allow for a more accurate calculation of $\alpha(T)$ throughout the process, leading to better predictions of the temperature field in both the casting and the mold for any given sand casting geometry.
To further elaborate on the material behavior, the “V-shaped” thermal conductivity curve can be modeled phenomenologically. A proposed composite formula that captures the decrease and subsequent increase is:
$$\lambda(T) = \lambda_{0} \exp(-k_1 T) + k_2 (T – T_{\text{min}})^n \quad \text{for} \quad T > T_{\text{min}}$$
where $\lambda_0$, $k_1$, $k_2$, $T_{\text{min}}$, and $n$ are fitting constants. For the specific heat, a common model accounting for linear increase and possible phase change effects is:
$$c_p(T) = c_{p0} + a T + b \exp\left(-\frac{(T – T_d)^2}{2w^2}\right)$$
Here, $c_{p0}$ is the base specific heat, $a$ is a linear coefficient, and the Gaussian term (with amplitude $b$, decomposition temperature $T_d$, and width $w$) approximates the endothermic binder decomposition peak around 400-500°C. Finding these parameters was the essence of the inverse analysis. The final validated curves are crucial inputs for any high-fidelity sand casting process model.
In conclusion, this study successfully determined the temperature-dependent thermophysical properties of a production-grade molding sand system used in sand casting. The key findings are: first, the distance from the casting-sand interface drastically affects the temperature history of the mold, with thermal waves propagating slowly due to the sand’s inherent low thermal diffusivity. Second, the effective thermal conductivity exhibits a pronounced “V-shaped” dependence on temperature, decreasing to a minimum around 400°C before increasing. Third, the specific heat capacity increases monotonically with temperature, but the rate of increase is much higher below 600°C than above it. These non-linear behaviors must be accounted for to achieve accurate numerical simulations of the sand casting process. The validation through direct comparison of simulated and measured temperature profiles confirms that implementing these derived property curves significantly enhances predictive accuracy. This work provides a methodology and specific data that can be adapted or serve as a benchmark for improving simulation reliability in sand casting operations, ultimately contributing to better quality control, reduced scrap rates, and optimized production planning in foundries employing sand casting techniques. Future work could involve extending this method to different sand-binder systems, investigating the effect of compaction density on properties, and integrating these curves into real-time solidification monitoring systems for advanced sand casting process control.